Global share markets have had a muted start to 2025. US equities fell by 0.4% over the past week, Australian equities nudged up by 0.2%, Eurozone shares rose but Japanese shares fell and markets were flat in China. US bond yields have been rising, putting downward pressure on sharemarkets. The US 10-year yield is just under 4.7%, close to the highs reached in October 2023 (when there was concern about the US fiscal situation) and equal to levels seen in 2007 around the time of the GFC. US yields have been rising as Fed rate cut expectations have pared back after the December “hawkish cut” as well as expectations of an inflationary agenda from the new Trump administration (which starts on January 20). The US dollar has also been rising alongside yields (see the chart below) and the Aussie dollar has fallen to 0.619 USD – its lowest level in over 2 years.
A lower Aussie dollar is good for Australian exports (because the cost of these goods is lower for overseas buyers) but reduces purchasing power for Australian consumers going overseas and puts upward pressure on inflation through imported products. However, the Australian Trade Weighted Index (which is our currency against a basket of our trading partners) hasn’t fallen as much as the Australian dollar so the impact on inflation is not as worrisome.
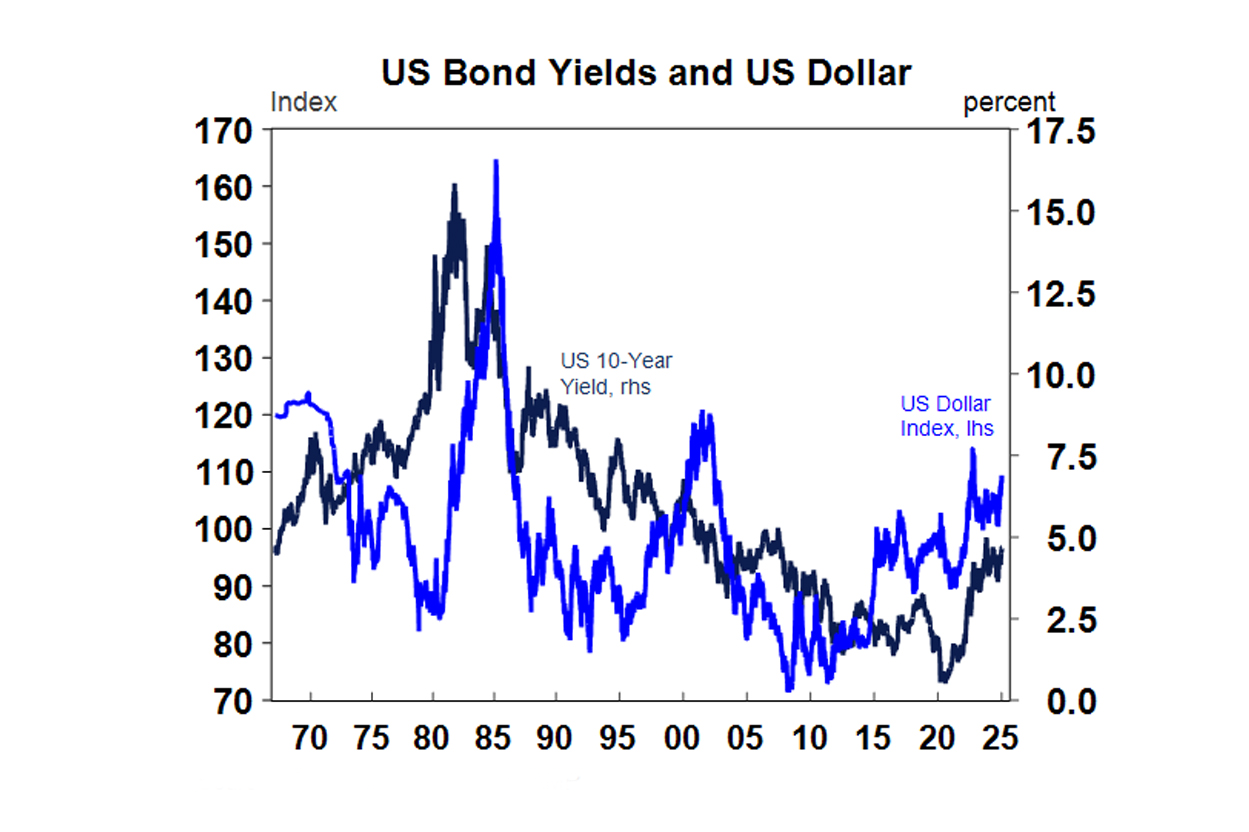
UK bond yields have also risen to their highest level since 2008 alongside the moves in the US and from concern around the UK’s own fiscal outlook. The rise in global bond yields looks a little overdone given that central banks are still in a cutting cycle and growth risks are to the downside, especially in the US. Nevertheless, the rise in bond yields is likely to put downward pressure on equity markets in the near-term.
US debt ceiling issues are back. This note from 2023 gives a good backdrop to US debt issues (because they come up all the time) and explains the difference between debt ceiling issues and “funding the government” bills which often occur at similar times. The US debt ceiling is the limit on all outstanding Federal debt. The debt ceiling was reinstated on 2 January (after it was suspended in 2023 as part of a bipartisan deal) but the US Treasury is likely to hit the debt ceiling limit between Jan 14 – 23 according to Treasury Secretary Janet Yellen. After this point, Treasury will need to take “extraordinary measures” to prevent a default. But it’s unclear how long these measures could last. Some analysts believe these measures will last until June or even August, so there is a decent amount of wiggle room. Once all these “extraordinary measures” are exhausted technically speaking the US government would technically default on its debt obligations as it could not repay interest on its debt. The US has never defaulted before and in the case of default, there end up being panic in financial markets and bond yields would likely spike. It’s a small risk for now, but one that needs to be watched.
Canadian Prime Minister Justin Trudeau resigned as leader of the Liberal Party which came after weeks of speculation following a poorly received mini-budget, negative polling for the government and the resignation of the finance minister. The issues of high inflation, poor housing affordability and the impact of high immigration (which have troubled many major Western countries in recent years) have aggravated voters. Canada was due to have an election by October but that looks likely to occur sooner, potentially as soon as May. There was little impact on Canadian shares and the currency.
Fires in Los Angeles have caused mass destruction and some deaths. Strong winds, the lack of water and poor management in the fire department region have exacerbated issues. This looks to be the worst natural disaster in LA history which will have large insurance implications (especially because of the costly nature of homes), which the sector already under pressure in recent years. The cost of the fires on estimates could be around half of Hurricane Katrina (which was $100bn).
Major global economic events and implications
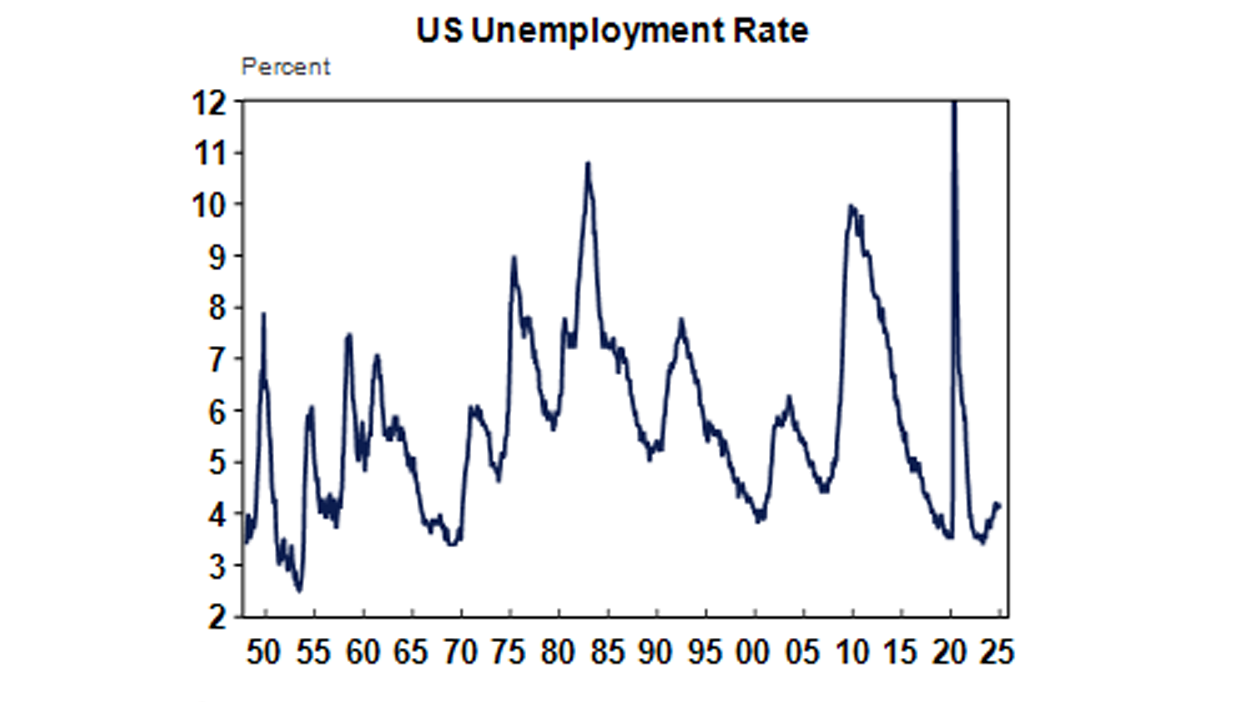
The US data released this week was mostly good. The December non-farm payrolls were very strong. Jobs rose by 256K over the month (expectations were for 165K) and the unemployment rate fell to 4.1% (from 4.2% last month). Average hourly earnings growth slowed to 3.9% over the year (from 4%).
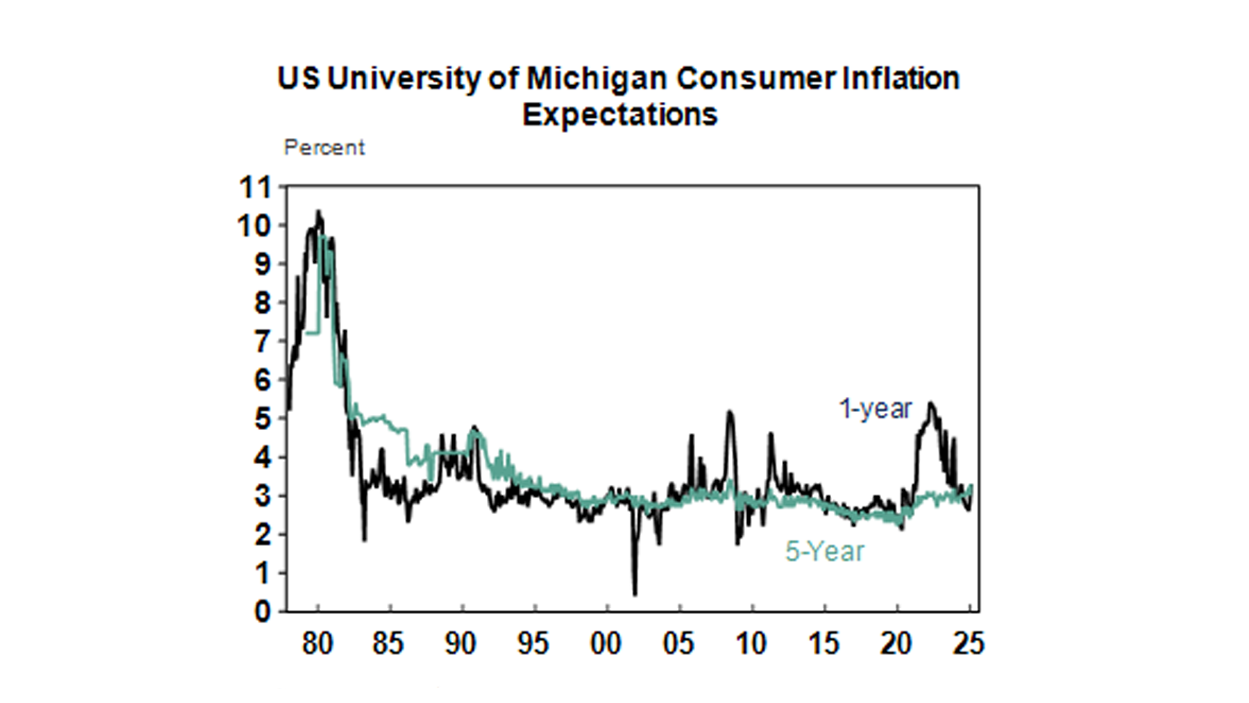
The University of Michigan consumer sentiment survey looked a little worrying with 1-year inflation expectations for January rising up to 3.3% (from 2.8% last month) and the 5-10 year also lifting to 3.3%. Any sign that inflation expectations are not anchored will worry the US Fed.
The Federal Reserve December meeting minutes had a hawkish tone, in-line with commentary after the meeting which saw the Fed cut the interest rates by 0.25% to 4.25% to 4.50%. The minutes noted that there were upside risks to inflation due to “stronger-than-expected readings on inflation and the likely effects of potential changes in trade and immigration policy”. There was only one dissenter to the December rate cut (who opted to keep rates unchanged). The Fed’s dot plots indicate an average of another 2 rate cuts in 2025 and it’s likely that the Fed will wait until March or even June to consider another rate cut.
Job openings in November were higher than expected and the ratio of job openings to the number of people unemployment was unchanged at 1.1, slightly below its pre-Covid levels which indicates that the labour market has cooled from very strong levels, but is also far from weak.
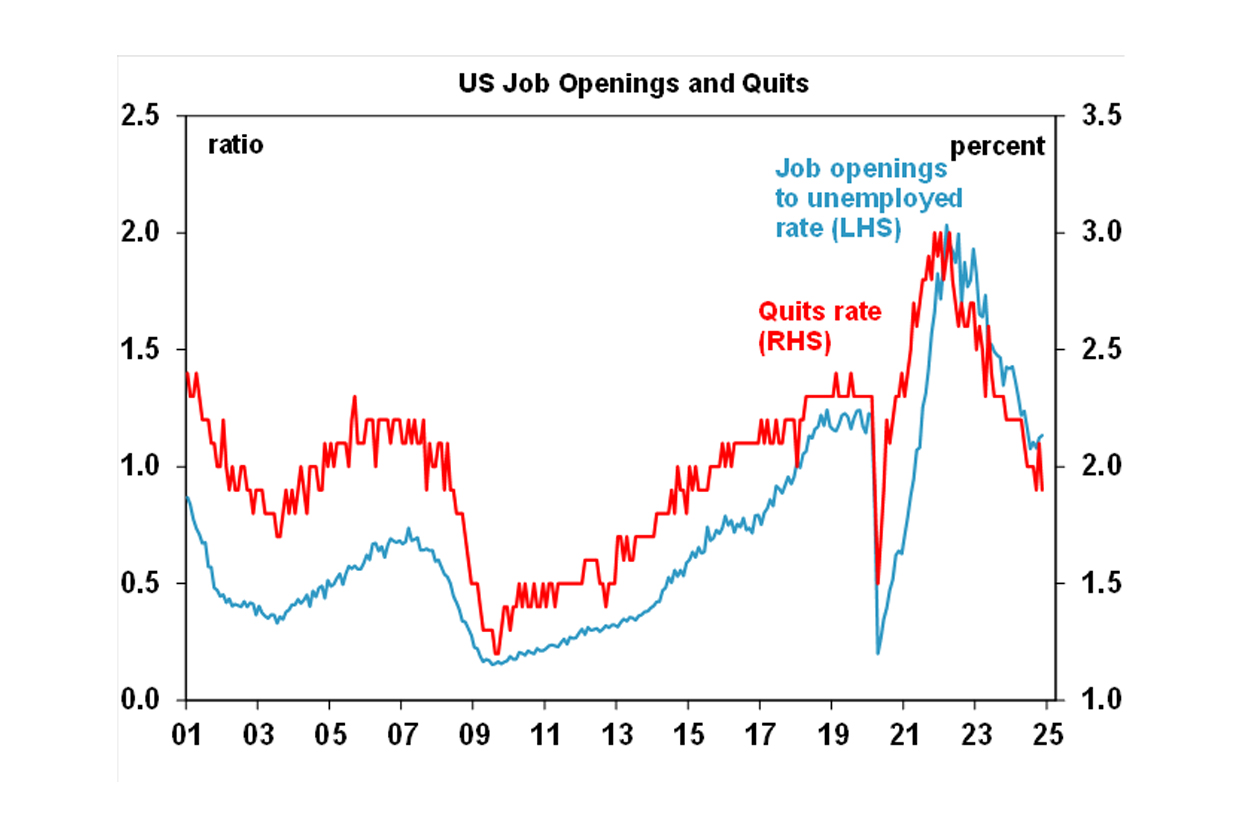
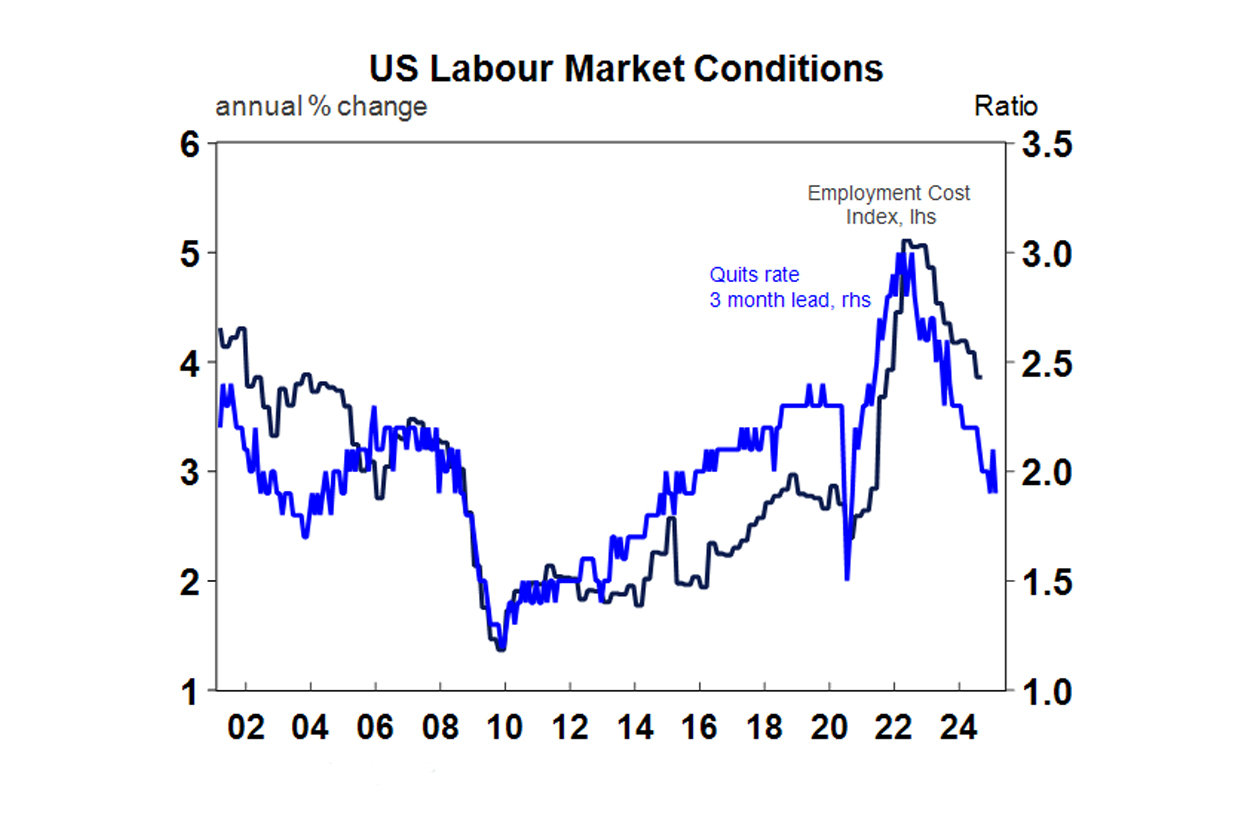
The “quits rate” which is the number of quits as a % of employment fell to 1.9%, back to its 2015 low which is a sign that workers are not confident about switching jobs and also tends to be a negative signal for wages growth (see the chart below).
Initial jobless claims fell more than expected over the week to Jan 4 and have been trending down recently, although continuing claims (more a sign of longer term unemployed) have been trending up.
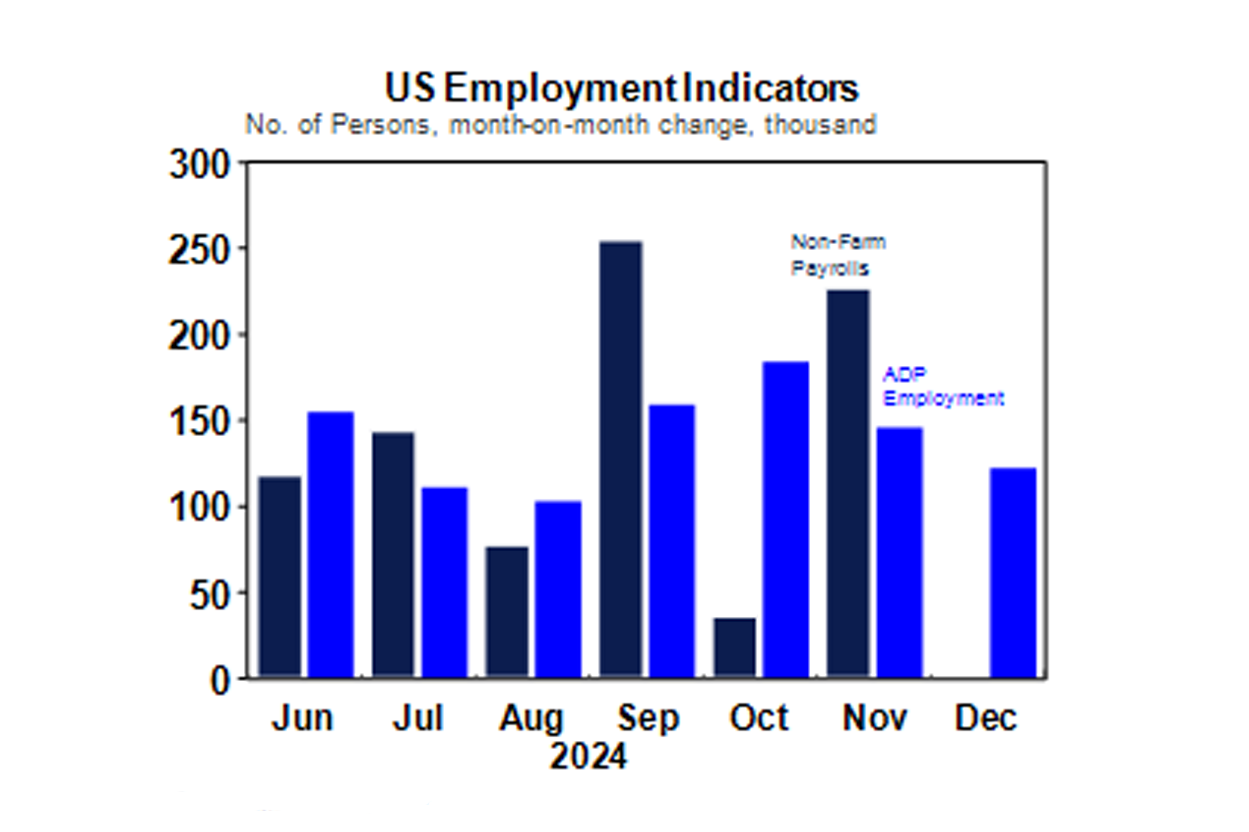
ADP employment for December rose by 122K (less than the 140K expected) before Friday’s non-farm payrolls data, which shows some downside risk to Friday’s non-farm payrolls data (although the two don’t always move in-line with one another).
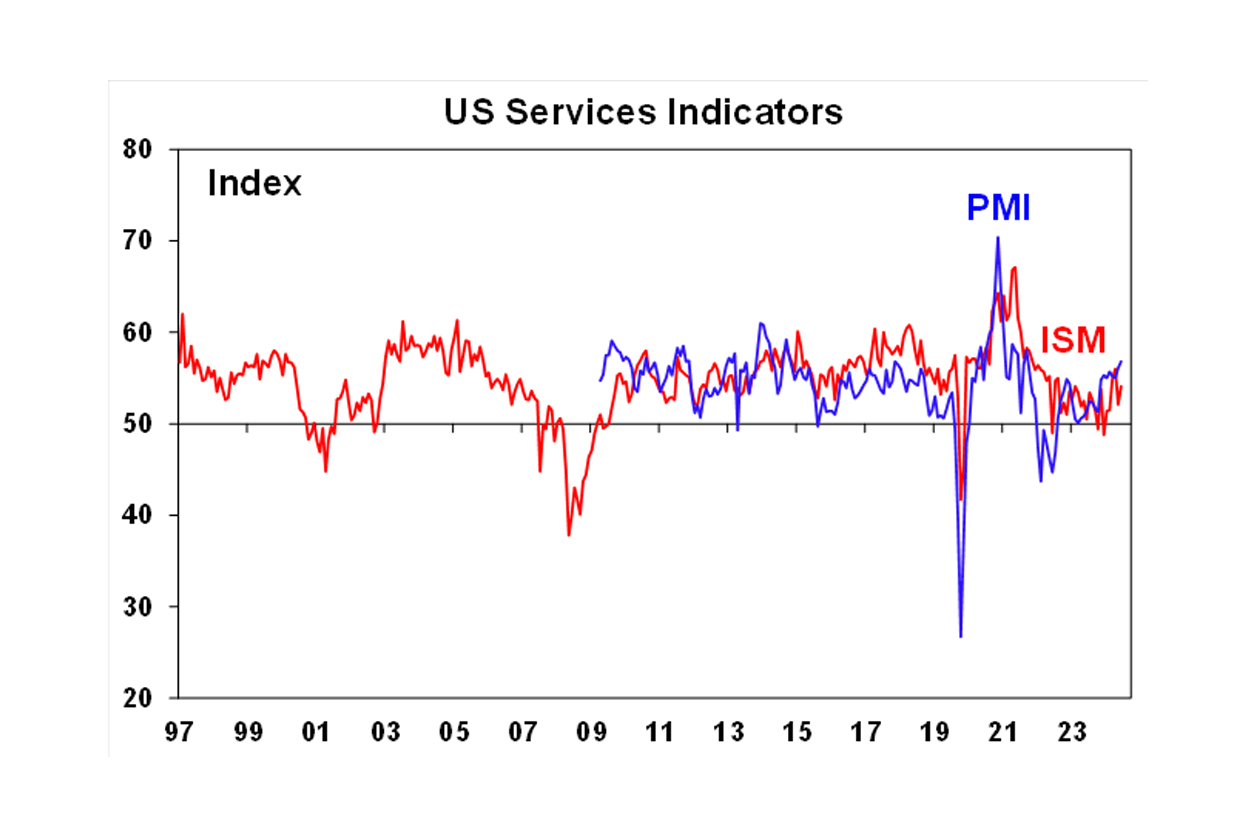
The ISM services index was a touch stronger in December, up to 54.1 in December (from 52.1 last month) but is still below the services PMI index (see the chart below).
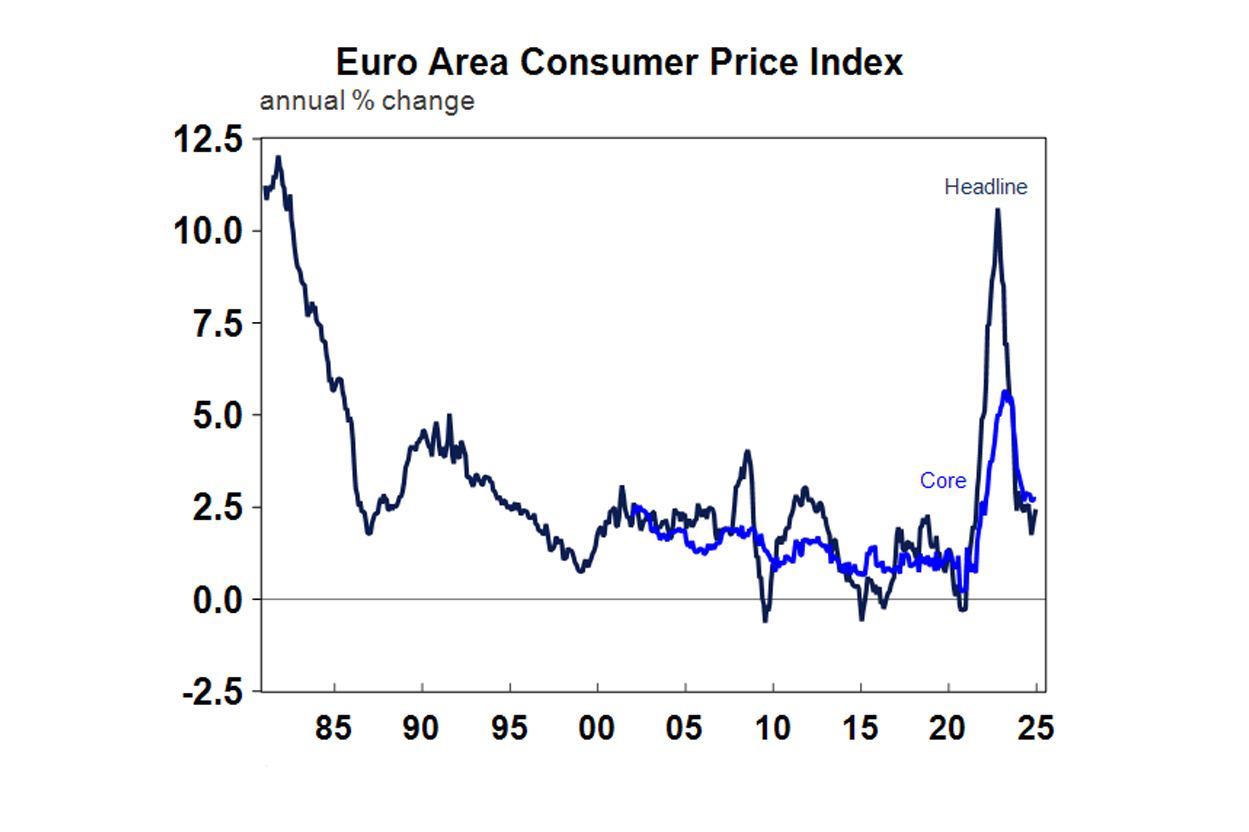
European December consumer price data came in line with expectations, rising by 0.4% over the month of December which is 2.4% year on year and 2.7% per annum on the core measure.
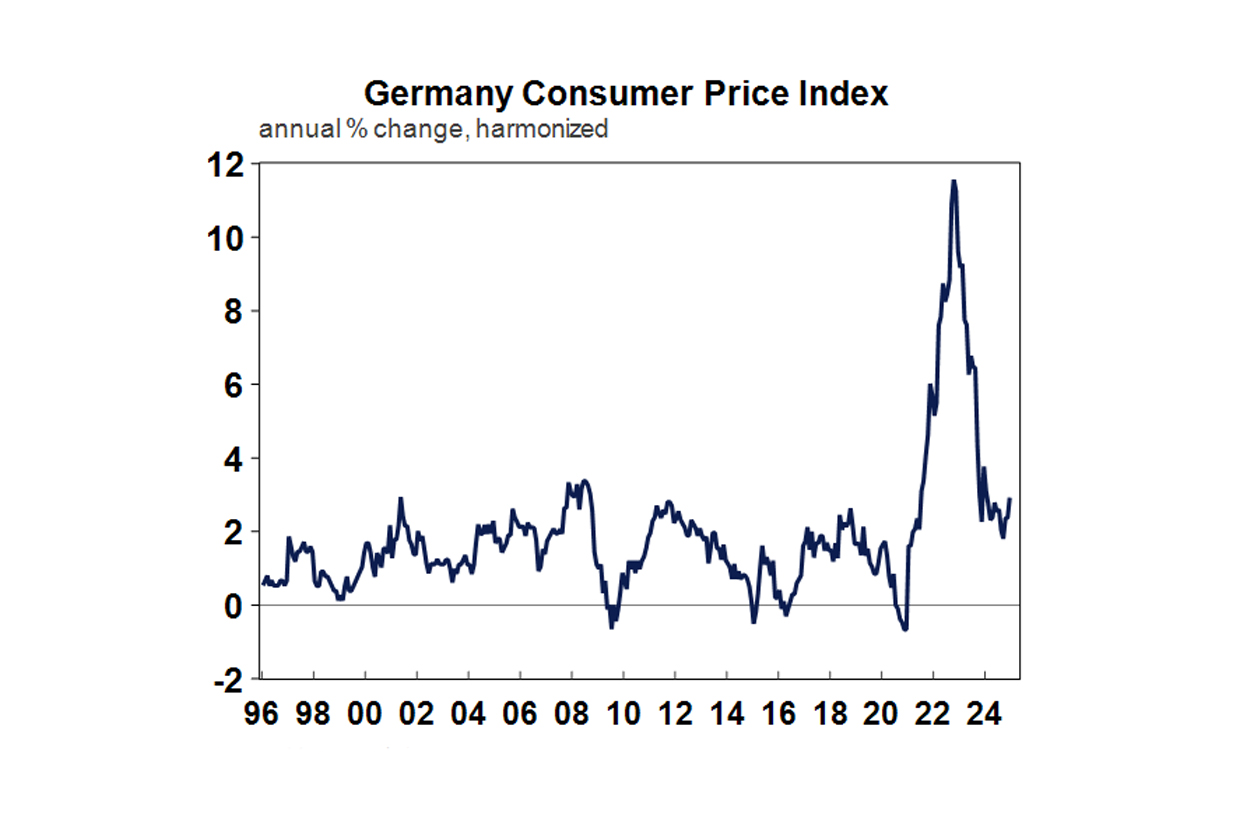
German December consumer price figures showed some re-acceleration in prices, up by 2.9% over the year (higher than the 2.6% expected), with higher energy prices contributing to higher prices.
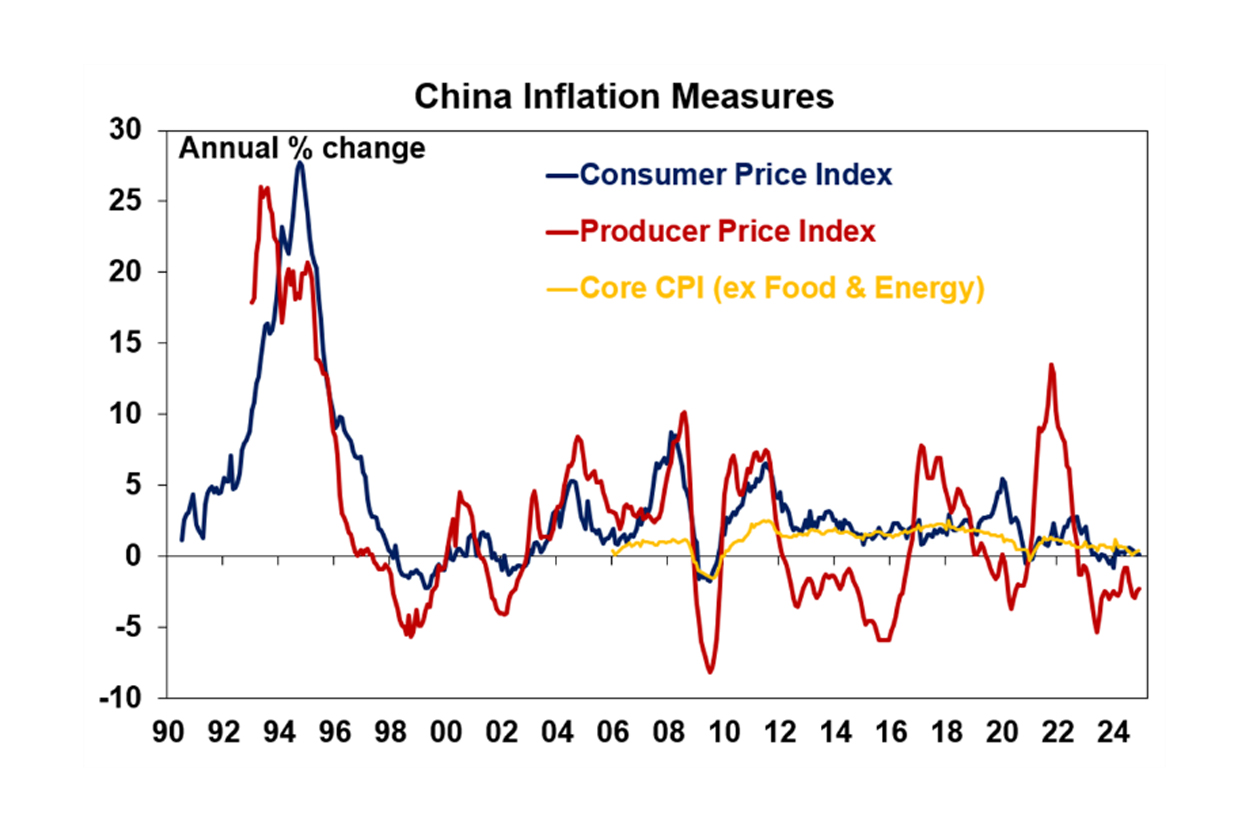
In China, December consumer prices rose by 0.1% year on year to December and producer prices fell by 2.3% over the year to December (see the chart below). Deflation has been a problem in China and reflects the weakness in parts of the economy, especially in consumer-spending dominated areas.
Australia economic events and implications
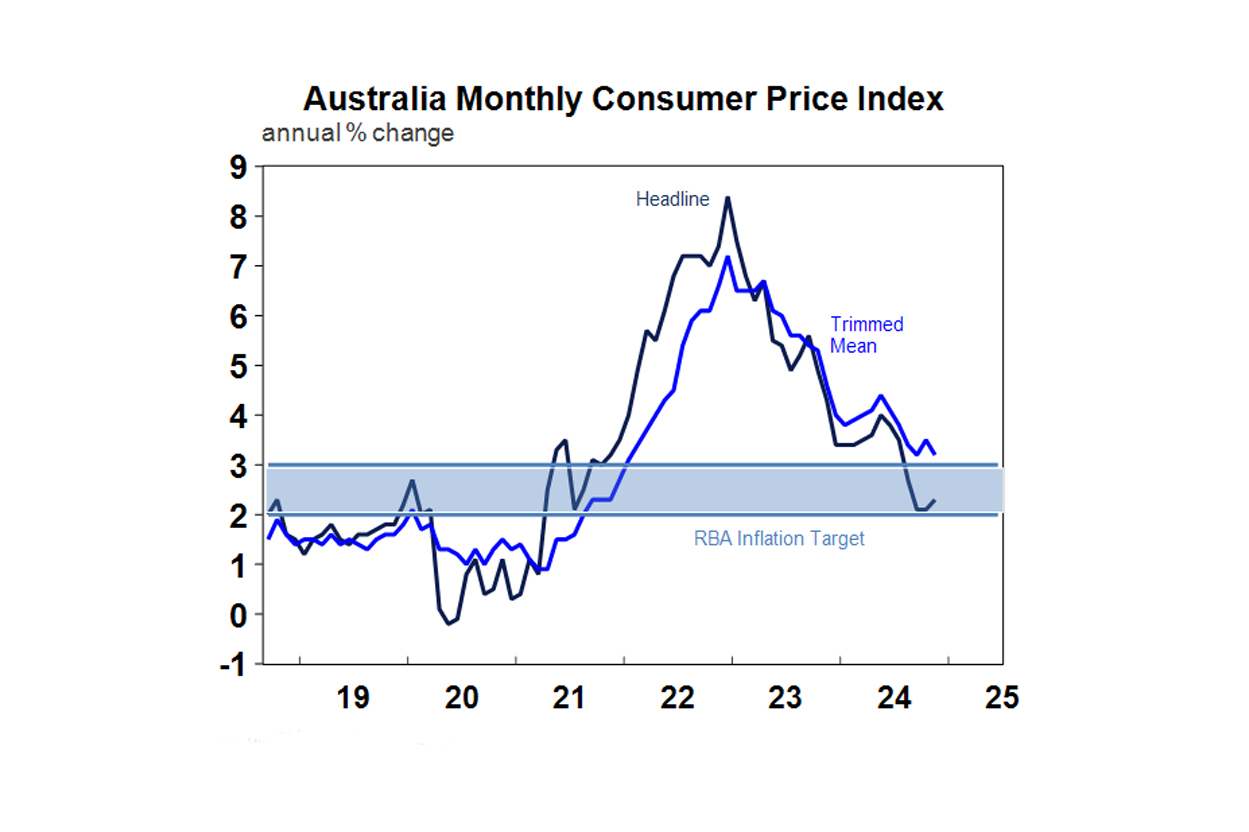
The monthly consumer price indicator for Australia showed that headline inflation rose by 2.3% over the year to November. In annual terms, this was a slight rise from 2.1% in the prior month as electricity payments mostly went back to “normal” after the large impact of the government cost-of-living subsidies. The components in the data showed that price growth in numerous services like new dwelling construction costs, eating out, holiday travel and insurance (which had previously seen high rates of inflation) were starting to moderate. The trimmed mean (or underlying) measure of inflation fell to 3.2% from 3.5% last month which is also good news and means a high chance of a 0.25% rate cut from the Reserve Bank in February, which would take the cash rate from 4.35% to 4.1%.
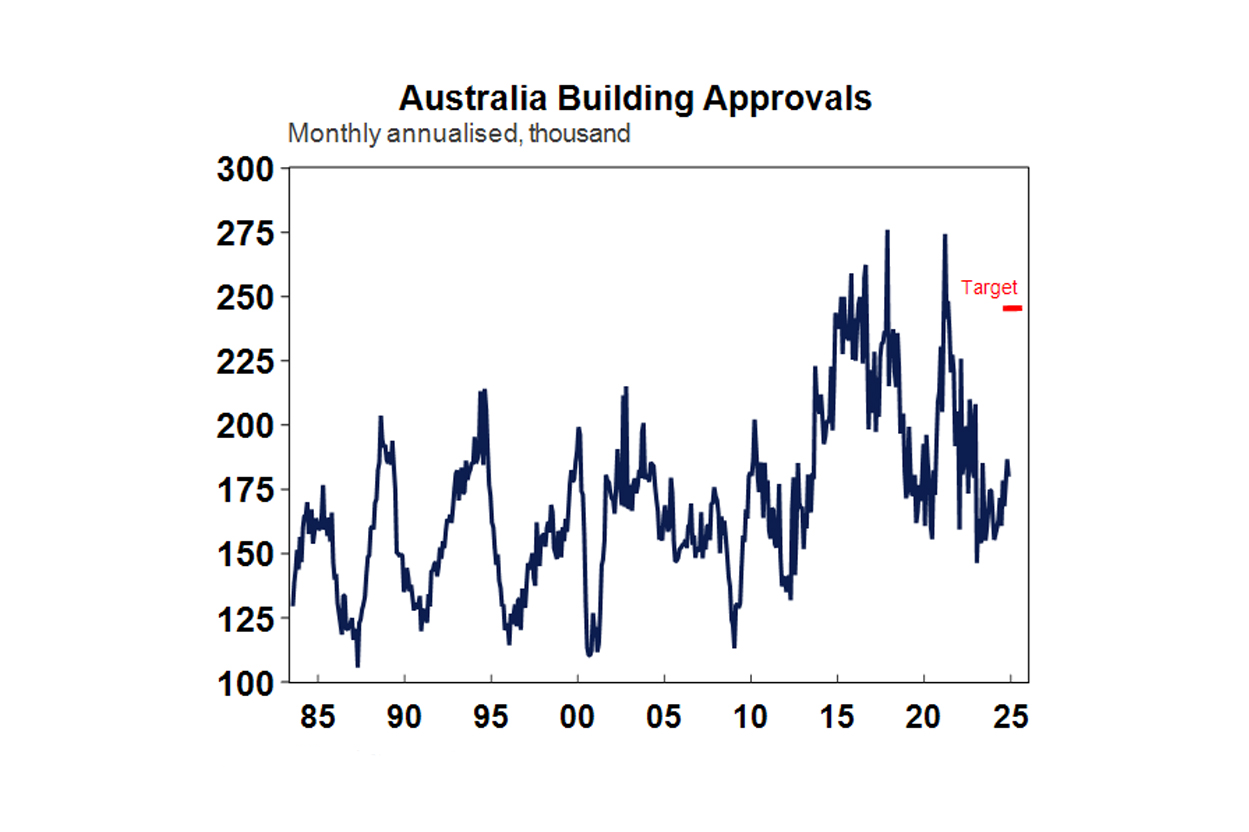
November building approvals were down by 3.6%, with non-detached homes down more than stand-alone houses although non-detached has been trending higher in recent months while houses are stalling. Over the year, total approvals are up by 3.2%. On an annualised basis, building approvals are currently running at just under 180K, well up from early 2024 lows of ~155K. Although, this number is still below the target of building 240K new homes a year (based on the National Housing Accord).
Job vacancies rose by 4.2% over the three months to November but are still down by 10.3% over the year. The ratio of job vacancies to unemployed persons is still elevated at 0.58 whereas before the pandemic it was more like 0.3. At its peak, job vacancies-to-unemployed reached nearly 1 which indicates 1 available job for every unemployed person.
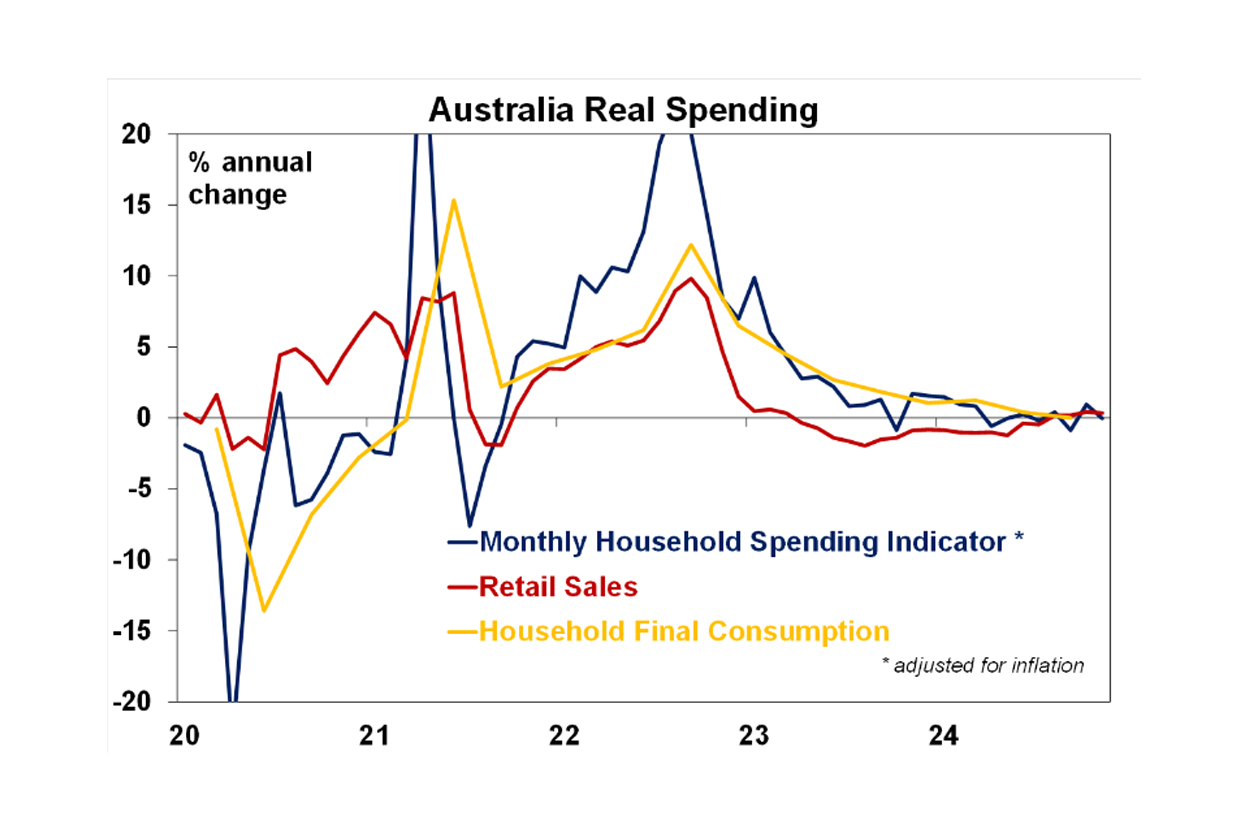
November retail sales rose by 0.8% (a little below the 1% expected by economists) after a decent 0.5% rise in the prior month. Sales periods have started earlier in Australia and consumers are shifting spending into these periods, with November driven by Black Friday sales which have not been fully reflected in seasonal adjustment. There was a big rise in furniture, restaurants, newspaper and books, footwear and accessories, clothing while recreational goods, specialised food fell over the month. Nominal retail spending is up by 3% over the year to November which looks decent, but volumes are weaker. Annual volumes have picked up and are now just positive. The other indicator of consumer spending, the monthly household spending indicator which is meant to be a broader indicator of consumer spending rose by 0.4% in November (below expectations of 0.7%) and lines up with softer-than-expected retail data. In real (or excluding inflation) terms, the household spending indicator is flat over the year which indicates that overall consumer spending growth is anaemic.
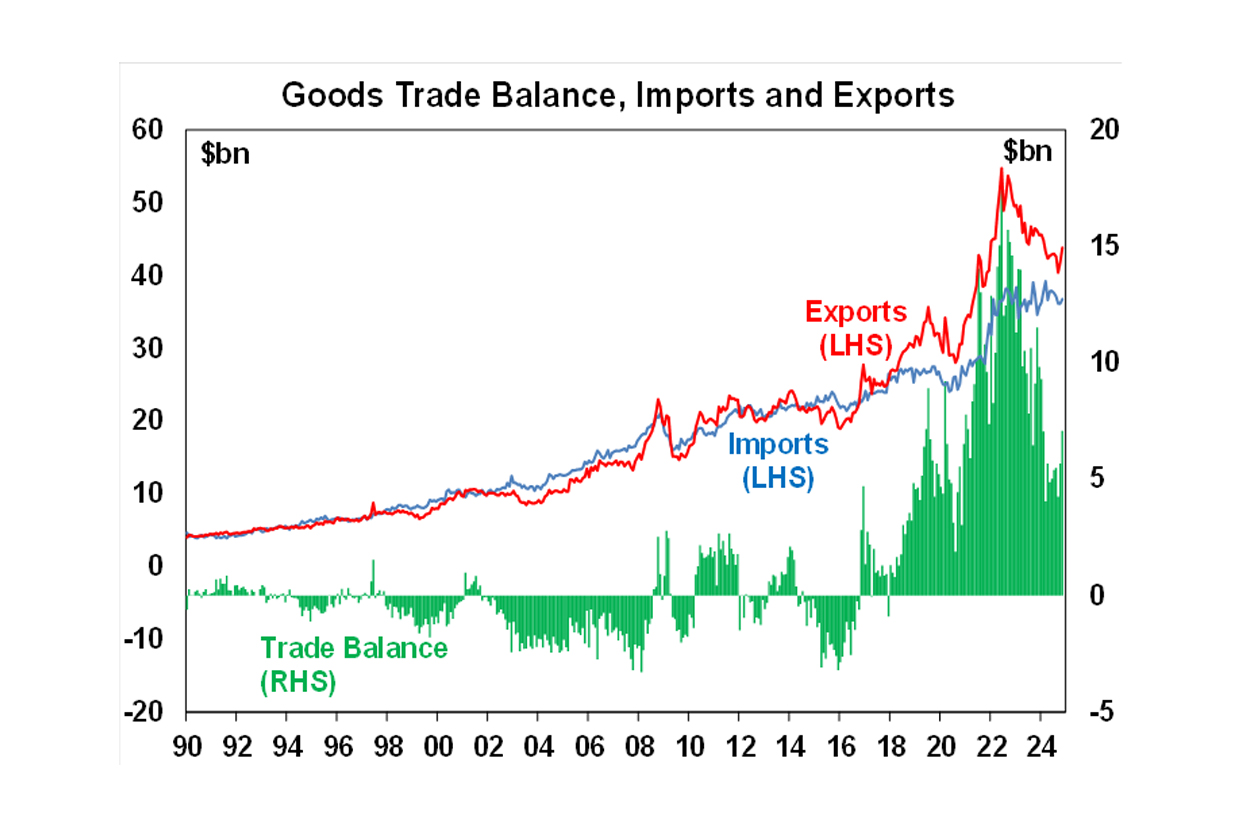
The trade surplus expanded in November to $7.1bn from $5.7bn, with a big rise in exports (both rural and commodities). Imports also rose, but by a smaller amount than exports.
What to watch over the next week?
Next week in Australia, the key release is the December employment data. The unemployment rate unexpectedly fell to 3.9% last month and we expect the unemployment rate to rise back to 4.1% in December, with the participation rate inching back up to 67.1% and employment rising by 30K. There is also the Melbourne Institute inflation gauge for December next week and the consumer confidence figures as well as November overseas arrivals and departures data.
In the US tonight December non-farm payrolls are expected to rise by 165K (below last month’s 227K) which should keep the unemployment rate unchanged at 4.2%. The January preliminary University of Michigan inflation expectations have trended a little higher lately with 1-year at 2.8% and 5-10 year at 3%. Consumer sentiment is also released and has been increasing in recent months. Next week the December consumer price index is expected to rise by 0.3% over the month (2.9% over the year) with core inflation at 3.3%. Producer prices are likely to rise by a similar rate over December. December retail sales should show moderate growth of 0.5% retail sales.
Next week is busy in China with export and import data for December, housing price figures (which are still falling), December quarter GDP is likely to be just under 5% year on year, industrial production is still holding up, retail sales should get a boost in December (up by 3.5% year on year) and property investment is likely to be down by over 10% year on year to December.
In Europe, ECB December meeting minutes are released.
Outlook for investment markets
2025 is expected to see okay but constrained global growth, but with an imbalance between strength in the US and weakness elsewhere. Expect global central banks to continue cutting interest rates as core inflation drifts further to target but expect bigger cuts in Europe and more constrained cuts by the Fed. Key uncertainties that will contribute to volatility are: Trump’s tax and tariff policies and the high risk of a trade war and/or concerns about the US deficit along with the risk of recession; geopolitical risks particularly in the Middle East; and Chinese growth.
In Australia underlying inflation is expected to fall further allowing the RBA to start easing hopefully from February but at least by May with three rate cuts though the year. The bad news is that unemployment is expected to head up to around 4.5% but growth should start to gradually pick up helped by lower interest rates and rising real incomes. The upcoming election risks a further rise in government spending but is unlikely to result in a big change in near term macro-economic policies.
Global and Australian shares are expected to return a far more constrained 7% in the year ahead. Stretched valuations after two strong years, the ongoing risk of recession, the likelihood of a global trade war and ongoing geopolitical issues will likely make for a volatile ride in 2025 with a 15% correction somewhere along the way highly likely. But with central banks still cutting rates, with the RBA expected to start cutting in the first half of 2025, and prospects for stronger growth later in the year supporting profits, shares should still see okay investment returns. Expect the ASX 200 to end 2025 at around 8,800 points.
Bonds are likely to provide returns around running yield or a bit more, as inflation slows to target, and central banks cut rates.
Unlisted commercial property returns are likely to start to improve in 2025 as office prices have already had sharp falls in response to the lagged impact of high bond yields and working from home.
Australian home prices are likely to see further weakness over the next six months as high interest rates constrain demand and unemployment rises. Lower interest rates should help from mid-year though and we see average home prices rising by around 3% in 2025.
Cash and bank deposits are expected to provide returns of around 4%, but they are likely to slow in the second half of 2025 as the cash rate falls.
The $A is likely to be buffeted between changing perceptions as to how much the Fed will cut relative to the RBA, the negative impact of US tariffs and a potential global trade war and the potential positive of more decisive stimulus in China. This could leave it stuck between $US0.60 and $US0.70.
Want to know more?
If you have any questions or want to know more, please reach out.
Kind Regards,
Diana Mousina
Deputy Chief Economist
AMP | Superannuation & Investments
Quay Quarter Tower, 50 Bridge Street, Sydney, NSW 2000
M: 0466 398 674 | diana_mousina@amp.com.au
You may also like
-

Weekly market update - 12-12-2025 Global shares were mixed over the last week with the Fed cutting rates but AI worries remaining. -

Oliver's insights - RBA holds rate with hawkish tones The RBA’s decision to leave rates on hold at 3.6% was no surprise with it being the consensus amongst all 29 economists surveyed by Bloomberg and the money market factoring in zero chance of a change. -

Oliver's Insights 2026 Predictions after 2025 success 2025 initially saw turmoil as US President Trump announced tariffs that were much higher than expected along with a bunch of other moves to upend US institutions and the global economic order. But the global economy held up okay.
Important information
Any advice and information is provided by AWM Services Pty Ltd ABN 15 139 353 496, AFSL No. 366121 (AWM Services) and is general in nature. It hasn’t taken your financial or personal circumstances into account. Taxation issues are complex. You should seek professional advice before deciding to act on any information in this article.
It’s important to consider your particular circumstances and read the relevant Product Disclosure Statement, Target Market Determination or Terms and Conditions, available from AMP at amp.com.au, or by calling 131 267, before deciding what’s right for you. The super coaching session is a super health check and is provided by AWM Services and is general advice only. It does not consider your personal circumstances.
You can read our Financial Services Guide online for information about our services, including the fees and other benefits that AMP companies and their representatives may receive in relation to products and services provided to you. You can also ask us for a hardcopy. All information on this website is subject to change without notice. AWM Services is part of the AMP group.


