


Oliver's Insights
The Seven key charts for investors to keep an eye on
Share markets have so far been fairly resilient in the face of uncertainty around Trump’s policies particularly tariffs. However, nervousness is creeping in. This note looks at seven key charts worth watching.
6 min read

Key points
So far shares have been relatively resilient, but uncertainties are mounting particularly around Trump’s policies.
We remain upbeat on a 12-month view but expect a rougher more constrained ride this year for shares, with a 15% plus correction likely somewhere along the way.
Seven key charts worth watching are: Trump’s tariffs; long term inflation expectations; inflation; business conditions PMIs; profit growth; the gap between earnings yields and bond yields; and the $US. Right now, they are mixed.
Introduction
Share markets have so far been fairly resilient in the face of uncertainty around Trump’s policies particularly tariffs. However, nervousness is creeping in. This note looks at seven key charts worth watching.
Chart 1 – US tariffs
Back in Trump 1.0 the tariff wars did not start until February 2018. So investors had a year of strong gains in 2017 with Trump’s tax cut and deregulation policies dominating before tariff uncertainty set it in 2018. This time he is moving the other way round with tariffs coming thick and fast because he wants the revenue and the pain out of the way earlier. So far tariffs have been confirmed on Chinese imports (10%) and steel and aluminium (25%) and these would take the average US import tariff to around 5%, well up from around 3% but still lowish. But there is much more to go with 25% tariffs on Canada and Mexico still “going forward” according to Trump, Trump planning a 25% tariff on auto, semi-conductors & pharmaceuticals and “reciprocal tariffs” to offset any perceived barriers against US companies and ongoing talk of more tariffs on China and Europe and a universal tariff supposedly to make other countries pay for the security the US provides.

Much of this is ludicrous and lacks economic logic (and common sense). Ultimately, we think Trump will be constrained as the tariffs impact confidence (as already becoming evident) resulting in a backlash, shares come under pressure like in 2018 and as other countries dig in and threaten to move away from the US on grounds, they don’t owe it anything. We think this will ultimately constrain the average US tariff around 10% - up from now but not the worst-case scenario. But it could initially go beyond that. The higher US tariffs go the bigger the risk for the global economy and shares – given the threat to confidence, spending and investment.
Australia is in a strong position to argue for exemptions as the US has a trade surplus with us but this is not guaranteed as Trump is concerned with other things than just the trade balance. So we are still vulnerable in relation to pharmaceuticals and to “reciprocal tariffs” if Trump takes a (mostly irrational) dislike to our GST, biosecurity laws, and news media bargaining code. Fortunately, our exports to the US are less than 1% of GDP – about the same size as the exports China restricted in 2020. Tariffs on them from a country thought of as friendly could still be a blow to confidence, but the main risk for us comes from a hit to global trade and growth from the tariffs, leading to less demand for our exports.
Chart 2 – longer term inflation expectations
A big worry for central bankers following the 2021-22 inflation surge was that medium term inflation expectations would “de-anchor” from low levels making it harder to get inflation back down. Fortunately, this didn’t happen. But lately US consumers’ inflation expectations have moved higher with the key 5–10-year inflation expectation rising to 3.5% its highest since 1995 on the back of concerns about Trump’s tariffs. This will concern the Fed. So hopefully US medium-term inflation expectations stabilise and start to come back down soon. It’s less of an issue in other countries including Australia as they are not setting of the tariffs but if they retaliate or their currencies collapse then it could become more of a global concern.
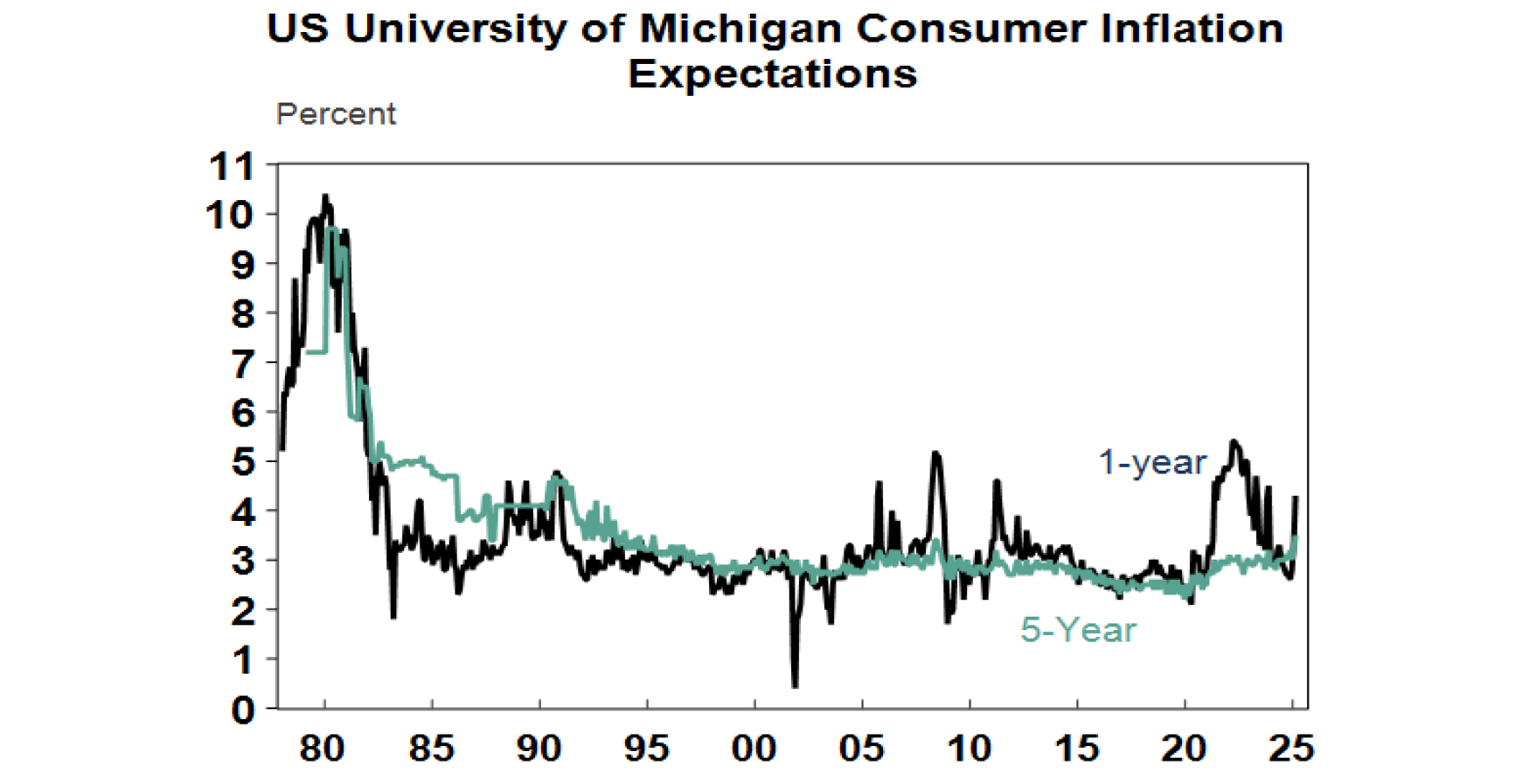
Chart 3 – inflation
Just as important is that the trend in inflation remains down. But underlying inflation still remains above most countries targets of around 2% or 2.5% in Australia. It still needs to fall further for central banks to be able to keep cutting rates. We think it will, but Trump’s tariffs pose a risk in the US although in other countries including Australia his tariffs are more of a downwards threat to growth. In Australia, we see inflation falling faster than the RBA expects resulting in three more 0.25% rate cuts – in May, August and February 2026.
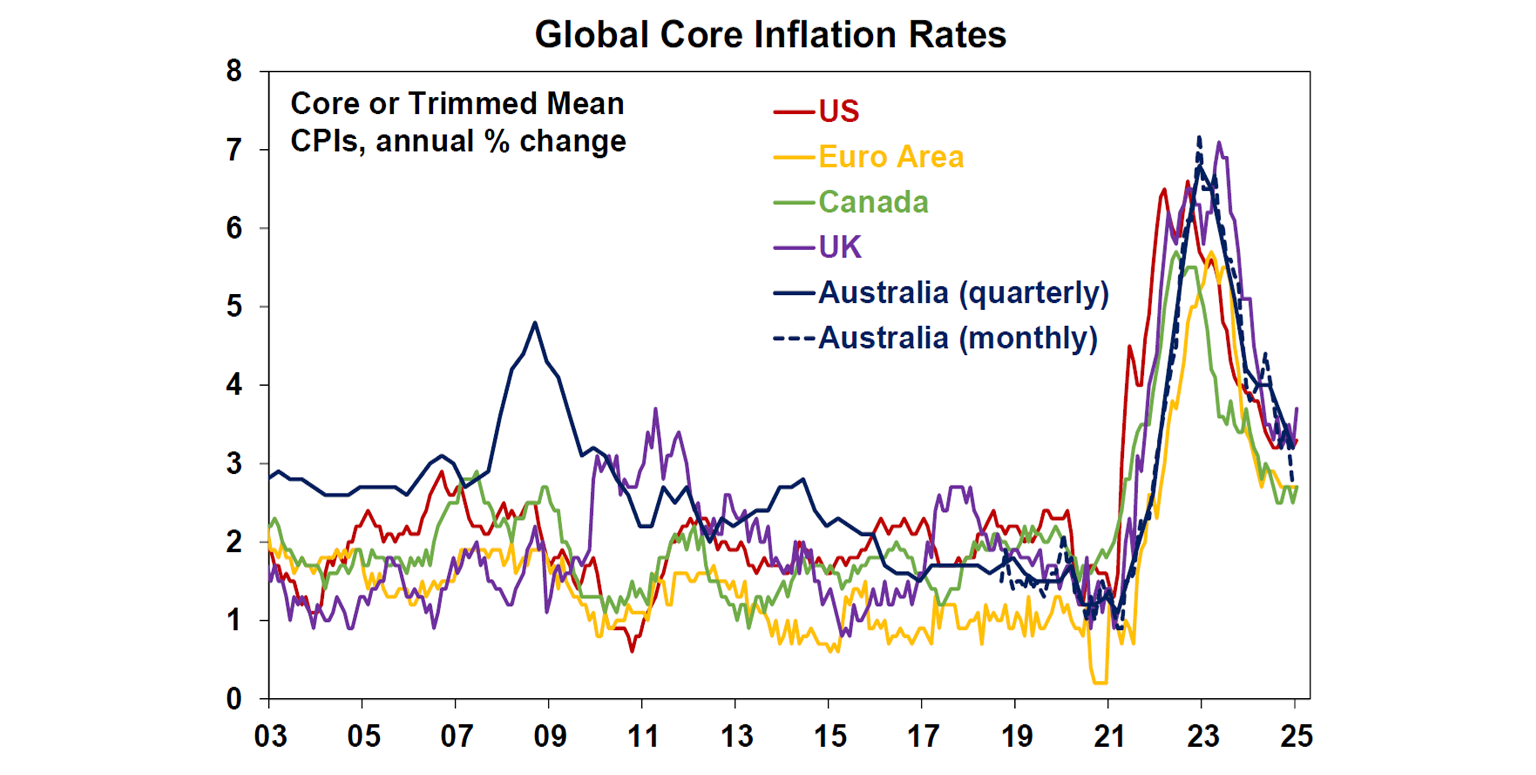
Chart 4 – global business conditions PMIs
As always, a key driver of how shares perform over the next 6-12 months will be whether major economies including Australia slide into recession. This has been much feared but avoided in recent times. However, the disruption and uncertainty posed by Trump’s tariffs & public spending cuts pose a new risk. Global business conditions indexes (PMIs) – which are surveys of purchasing managers at businesses – will be a key warning indicator. Right now, they are at okay levels, but they are softening again.
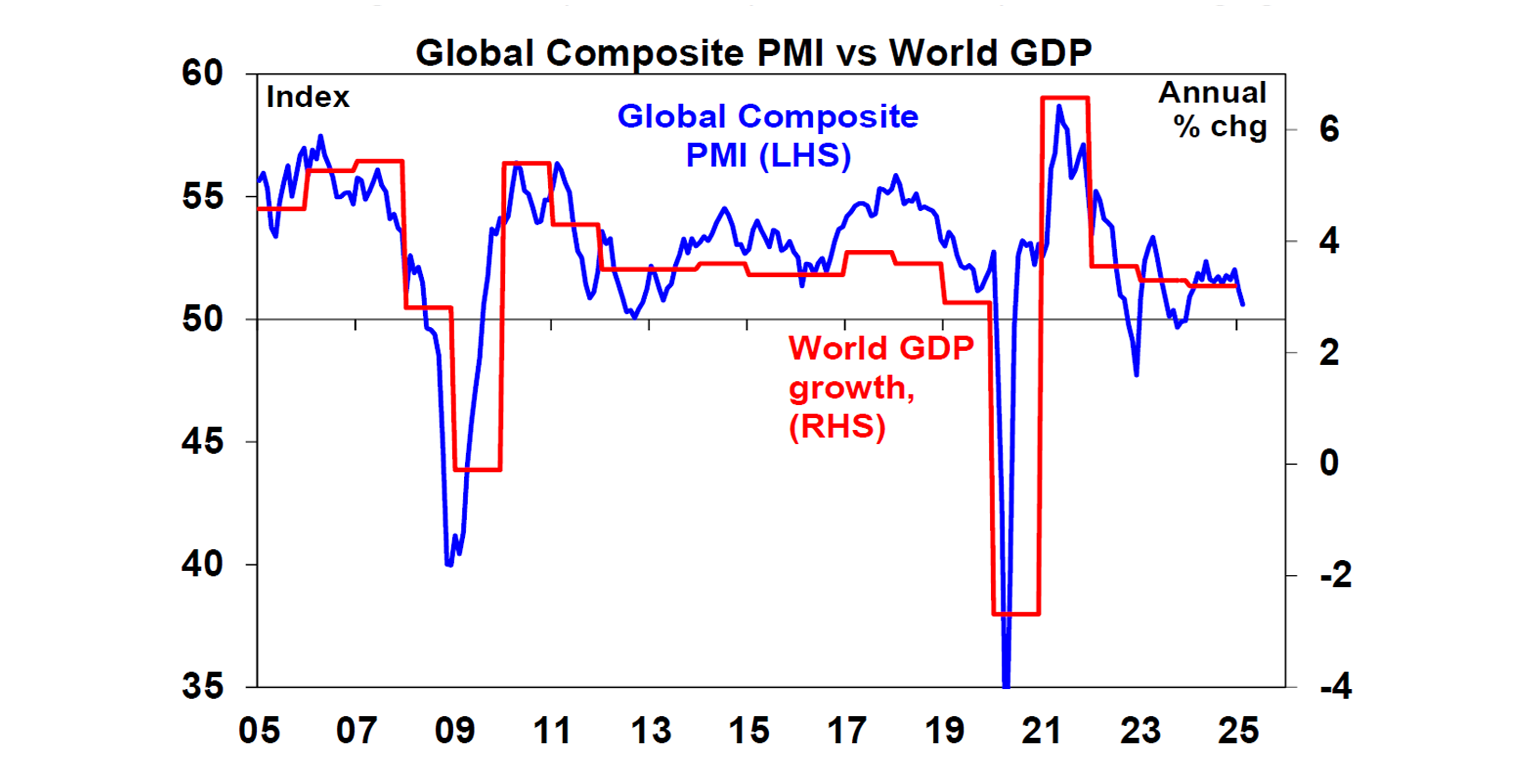
And this softening is being driven by the US!
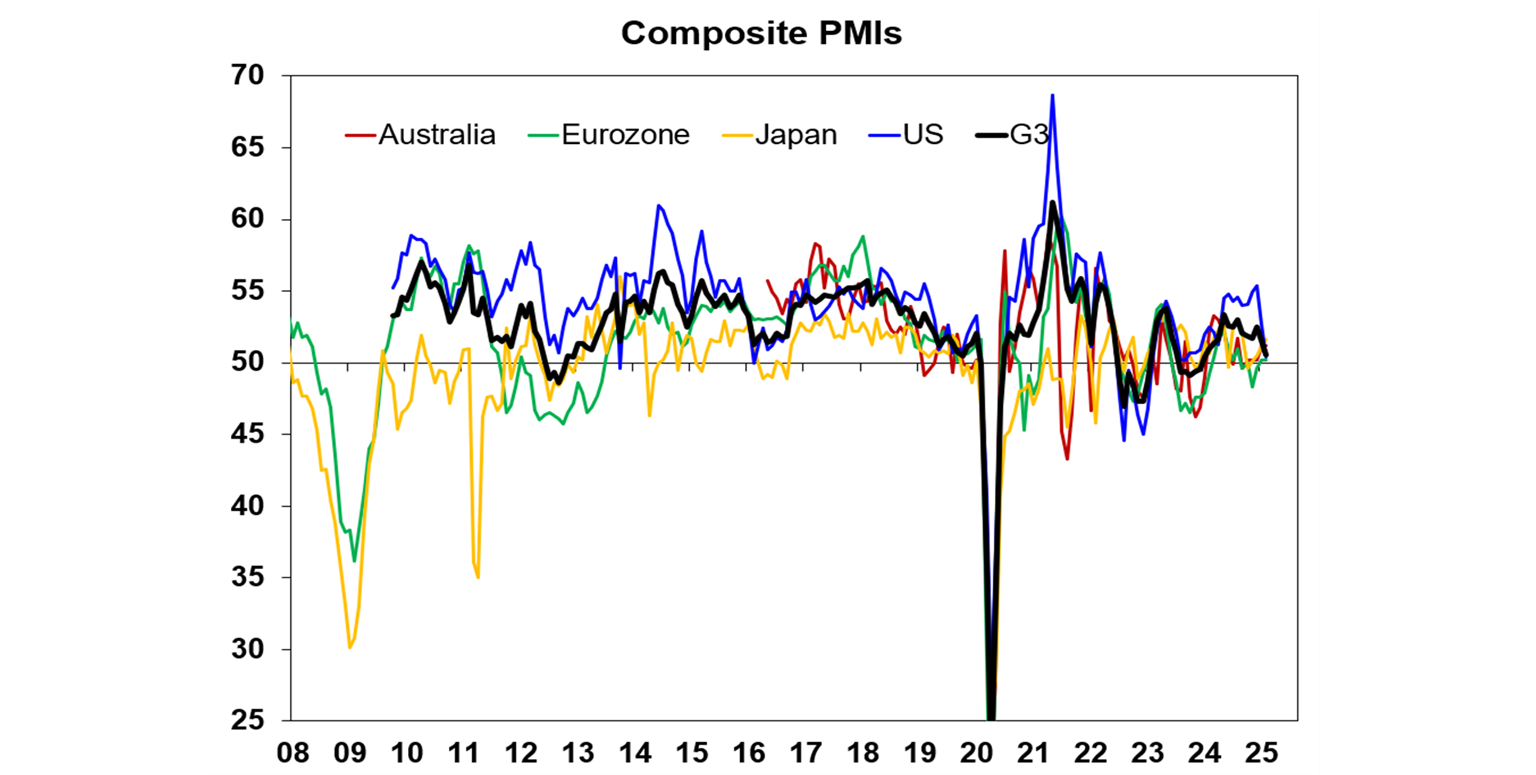
Chart 5 – company profits
Consensus global and US earnings growth expectations for 2025 are around 12% and 14% respectively, and in Australia they are around 2%. US December quarter earnings results have come in stronger than expected at around 13%yoy, but expectations for the year have been revised down reflecting mixed guidance. In Australia, the December half earnings reporting season has seen some bad news from banks and resources, but most companies are doing better with more beating expectations than missing and an increased proportion reporting profits and dividends up on a year ago, so the worst may be over after falling profits since 2022-23.
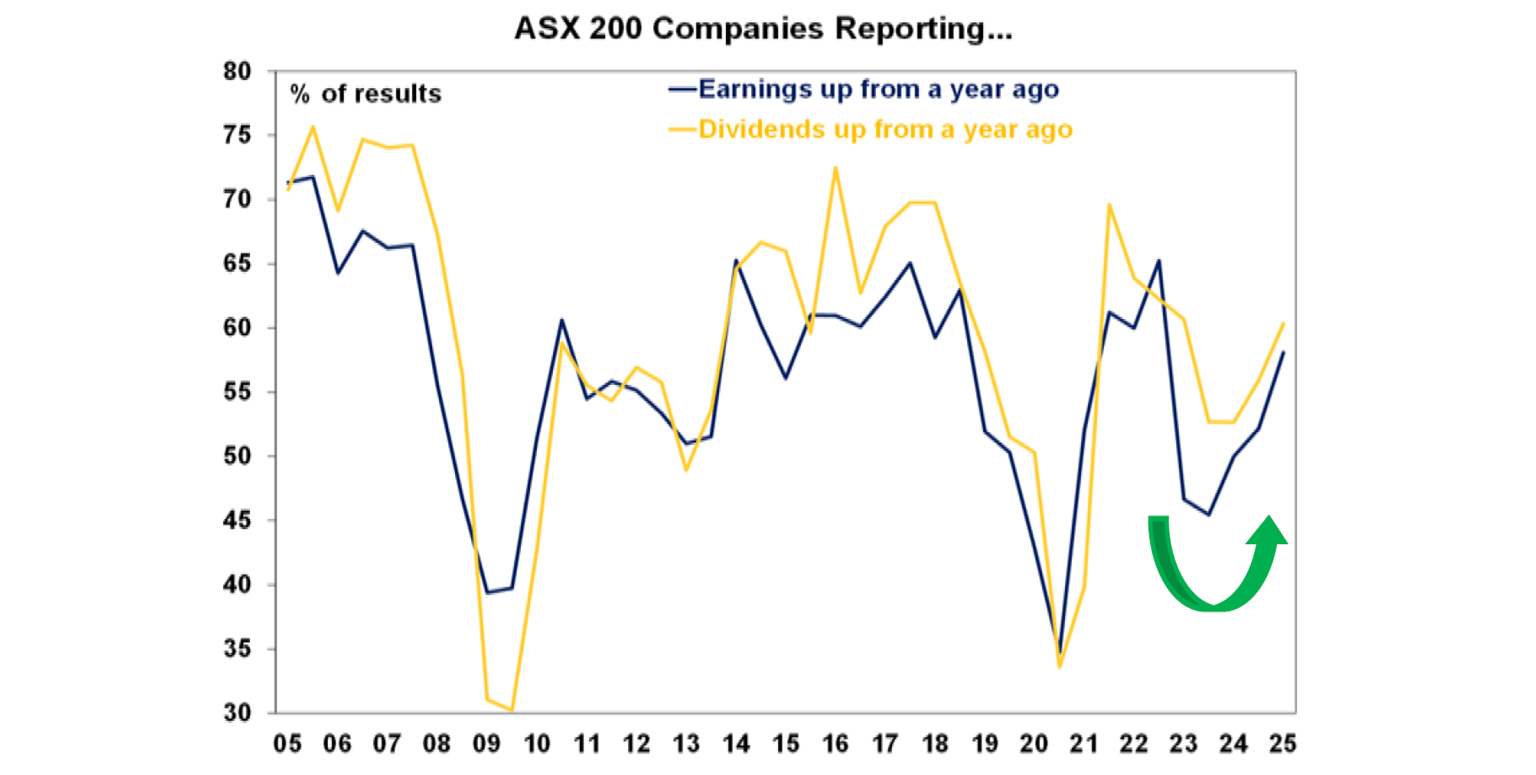
Chart 6 – the gap between earnings and bond yields
Valuation is a poor guide to timing markets but can help tell us whether markets have run ahead of themselves and how vulnerable they are. Since 2020, rising bond yields and rising PE multiples have worsened share valuations, with the gap between earnings yields and bond yields - a proxy for shares’ risk premium – around its lowest since 2002 in the US. Australia is a bit better. But both are vulnerable to bad news – eg if Trump’s tariff wars hit economic activity and hence earnings. By contrast Chinese shares are cheap. Ideally lower bond yields and higher earnings are required.
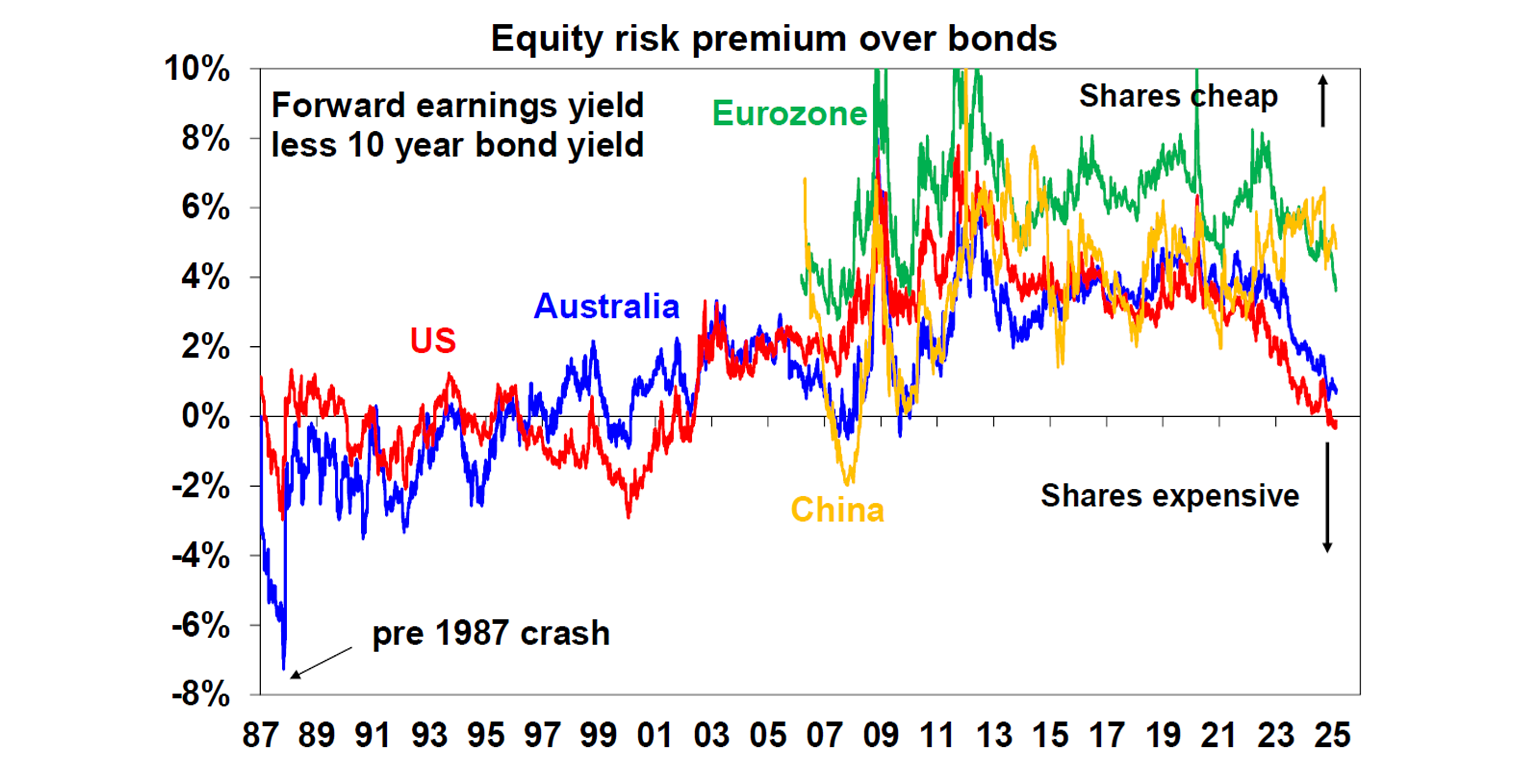
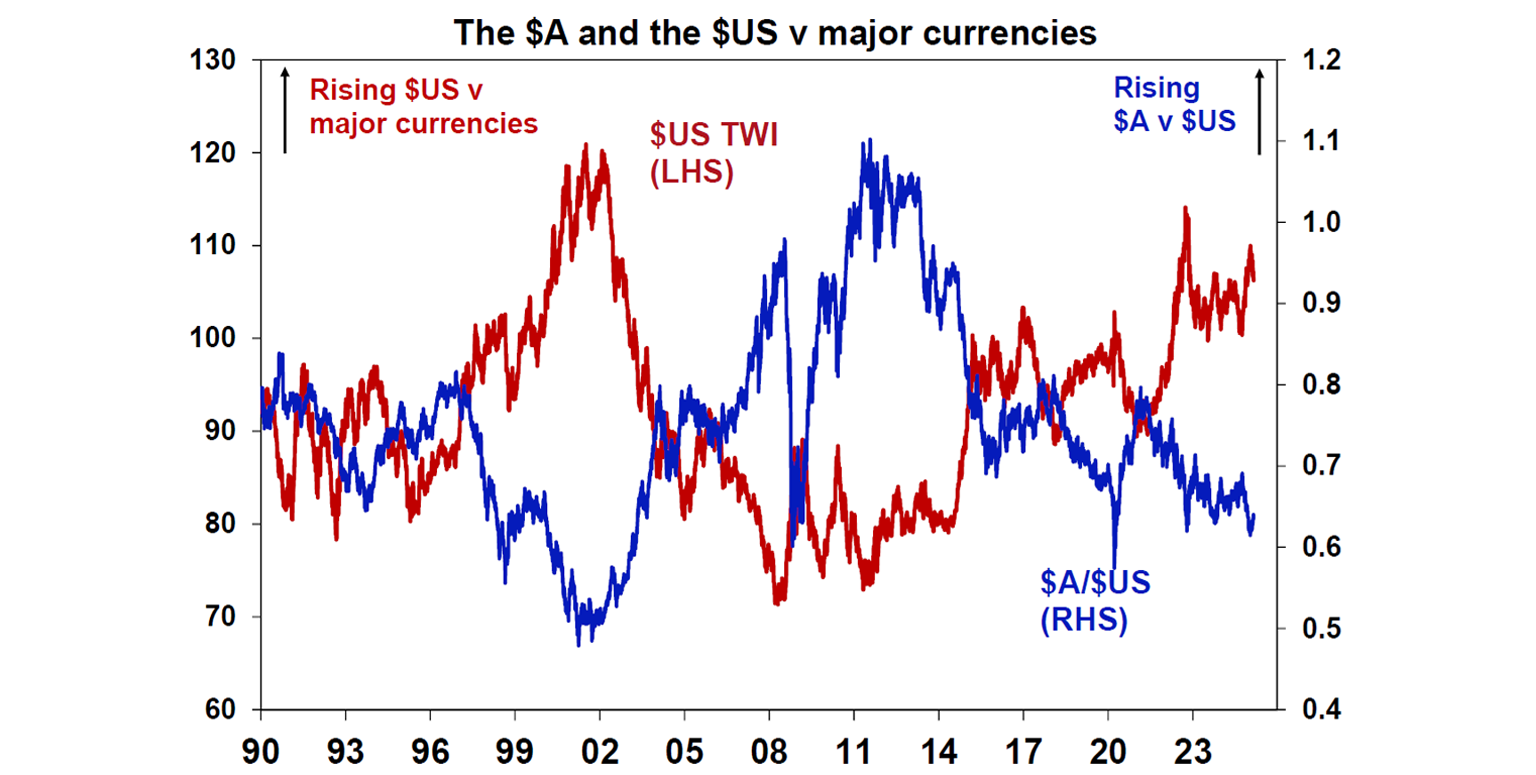
Chart 7 – the US dollar
Due to the low exposure of the US economy to cyclical sectors (like manufacturing), the $US is a “risk-off” currency. It tends to go up when there are worries about global growth and down when the outlook brightens. So, moves in it are a key bellwether of the investment cycle. Right now, it remains high. It has shown signs of rolling over since January but ideally to be confident on global growth further $US weakness would be positive. Of course, the $A is a mirror image being a growth currency.
You may also like
-

Weekly market update - 17-04-2026 Global share markets rose further over the last week on optimism for a peace deal with Iran, with US and Japanese shares rising to record highs. -

The simple money check that makes sense when you switch jobs Changing jobs is more than a career move – it’s a natural checkpoint for your super. A quick look now can help you see how your super is tracking against your goals. -
Oliver's Insights - Longer term Iran War impacts A stagflationary hit of higher inflation and weaker growth is now baked in with the uncertainty being how long it’s sustained. The flow of ships through the Strait of Hormuz remains the key - as it has been since day one of the War.
Important information
Any advice and information is provided by AWM Services Pty Ltd ABN 15 139 353 496, AFSL No. 366121 (AWM Services) and is general in nature. It hasn’t taken your financial or personal circumstances into account. Taxation issues are complex. You should seek professional advice before deciding to act on any information in this article.
It’s important to consider your particular circumstances and read the relevant Product Disclosure Statement, Target Market Determination or Terms and Conditions, available from AMP at amp.com.au, or by calling 131 267, before deciding what’s right for you. The super coaching session is a super health check and is provided by AWM Services and is general advice only. It does not consider your personal circumstances.
You can read our Financial Services Guide online for information about our services, including the fees and other benefits that AMP companies and their representatives may receive in relation to products and services provided to you. You can also ask us for a hardcopy. All information on this website is subject to change without notice. AWM Services is part of the AMP group.