


Oliver's insights
Seven key charts for investors to keep an eye on
Where are they now?
12 min read

Key points
Shares are at risk of a short term pull back and volatility will likely remain high on central bank and recession risks.
However, we remain reasonably upbeat on a 12-month view as falling inflation takes pressure off interest rates.
Seven key charts worth keeping an eye on remain: global business conditions PMIs; inflation and our Inflation Indicators; unemployment and underemployment; inflation expectations; earnings revisions; the gap between earnings yields and bond yields; and the US dollar. So far so good.
Introduction
At the start of this year, we thought shares would have reasonable returns albeit it wouldn’t be smooth sailing given ongoing issues around inflation, interest rates, the risk of recession and geopolitics. So far so good. This note updates seven key charts we see as critical for the investment outlook.
Chart 1 – global business conditions PMIs
A big determinant of whether share markets can continue to move higher or resume the bear market in US and global shares that started last year, will be whether major economies slide into recession and, if so, how deep that is. Our assessment is that the risk of a mild recession is high (particularly in Australia), but that at least a deep recession should be avoided. Global business conditions indexes (PMIs) – which are surveys of purchasing managers at businesses – will be a key warning indicator.
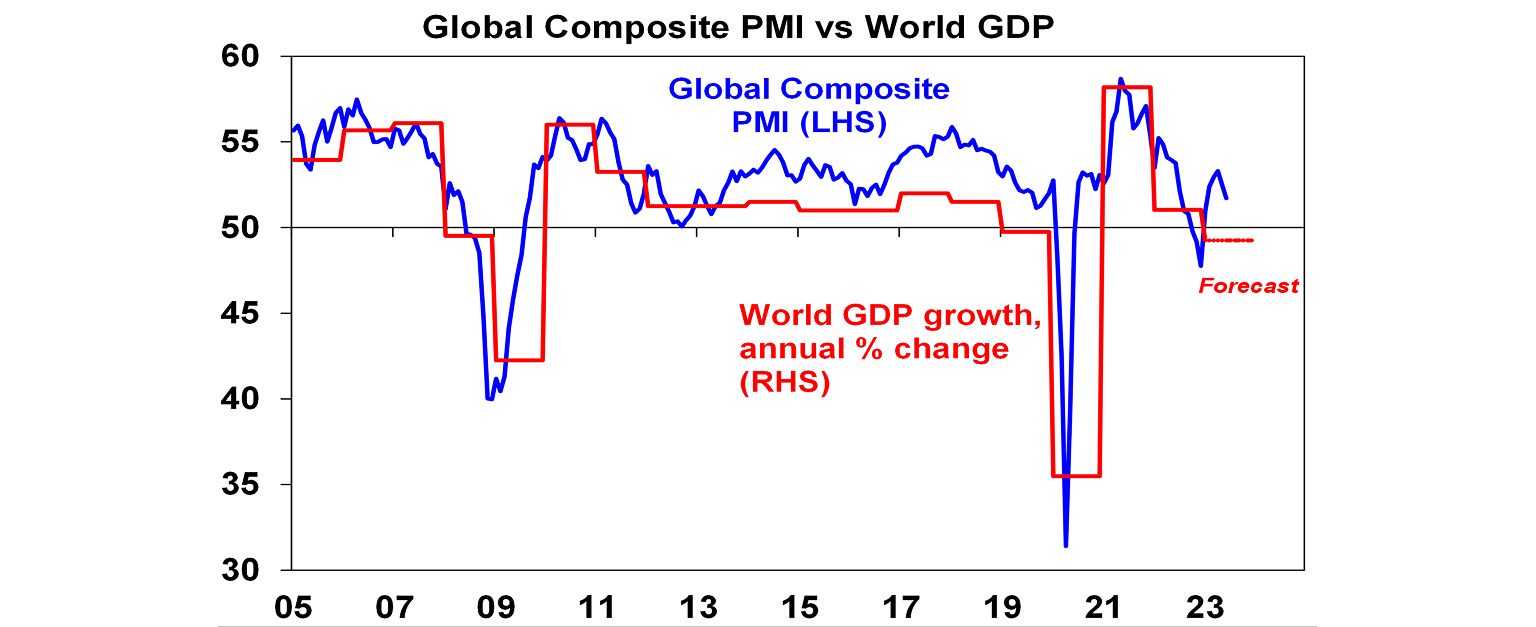
So far, they have proven resilient. While slowing again after a bounce – partly due to China - they are at levels consistent with okay global growth.
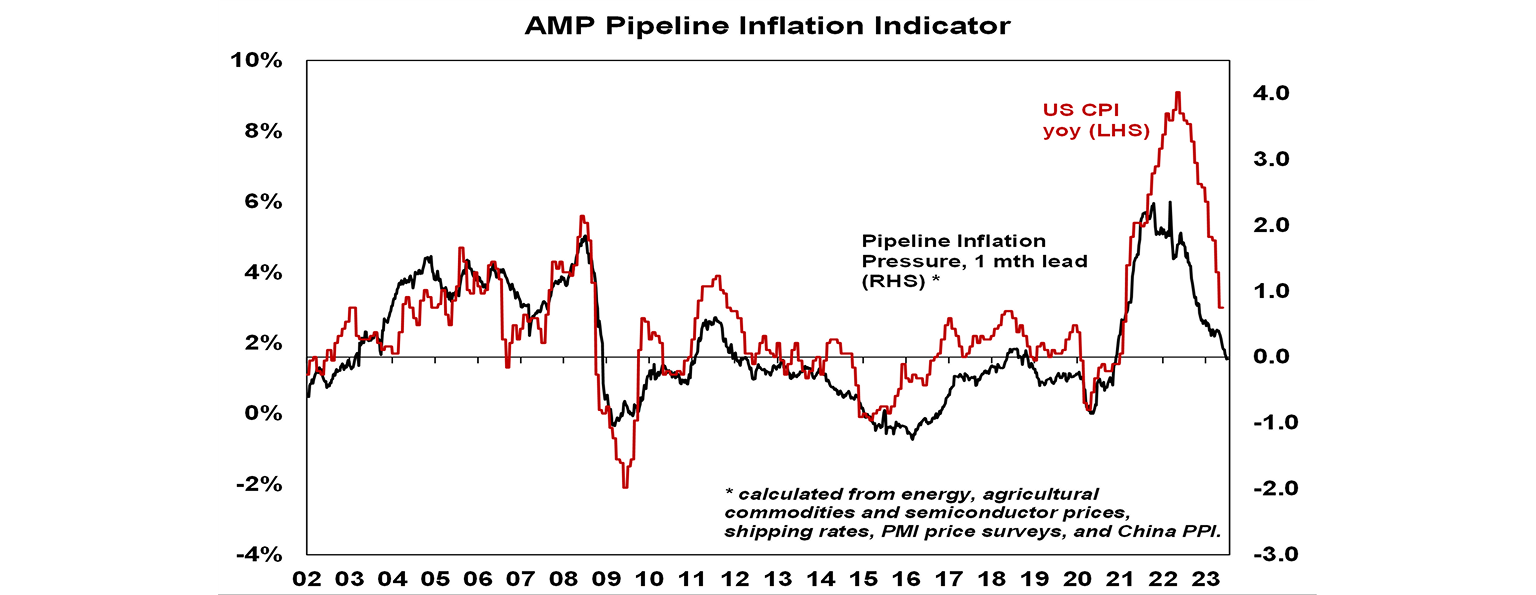
Chart 2 (and 2b) – inflation
Of course, a lot continues to ride on how far key central banks raise interest rates. And as has been the case for the last 18 months or so the path of inflation will play a key role in this. Over the last six months the news on this front has continued to improve with inflation rates in key countries rolling over. US inflation has now fallen from 9.1%yoy a year ago to 3% in June and our US Pipeline Inflation Indicator – reflecting a mix of supply and demand indicators – continues to point to a further decline. This reflects a combination of lower commodity prices, improved supply, lower transport costs and easing demand. Just as goods price inflation led on the way up, it’s now leading on the way down with services inflation rolling over as well. The Fed is likely to hike once more this month but the fall in inflation suggests that may be the peak with rate cuts next year.
Australian inflation is lagging the US by 6 months, but our Australian Pipeline Inflation Indicator suggests inflation here will continue to fall. The RBA has started to soften its tightening bias & while we are allowing for a bit more on rates (given RBA worries about still high services inflation & the high risk of stronger wages growth), our assessment is that the RBA is either at or close to the top with rate cuts starting in February next year.
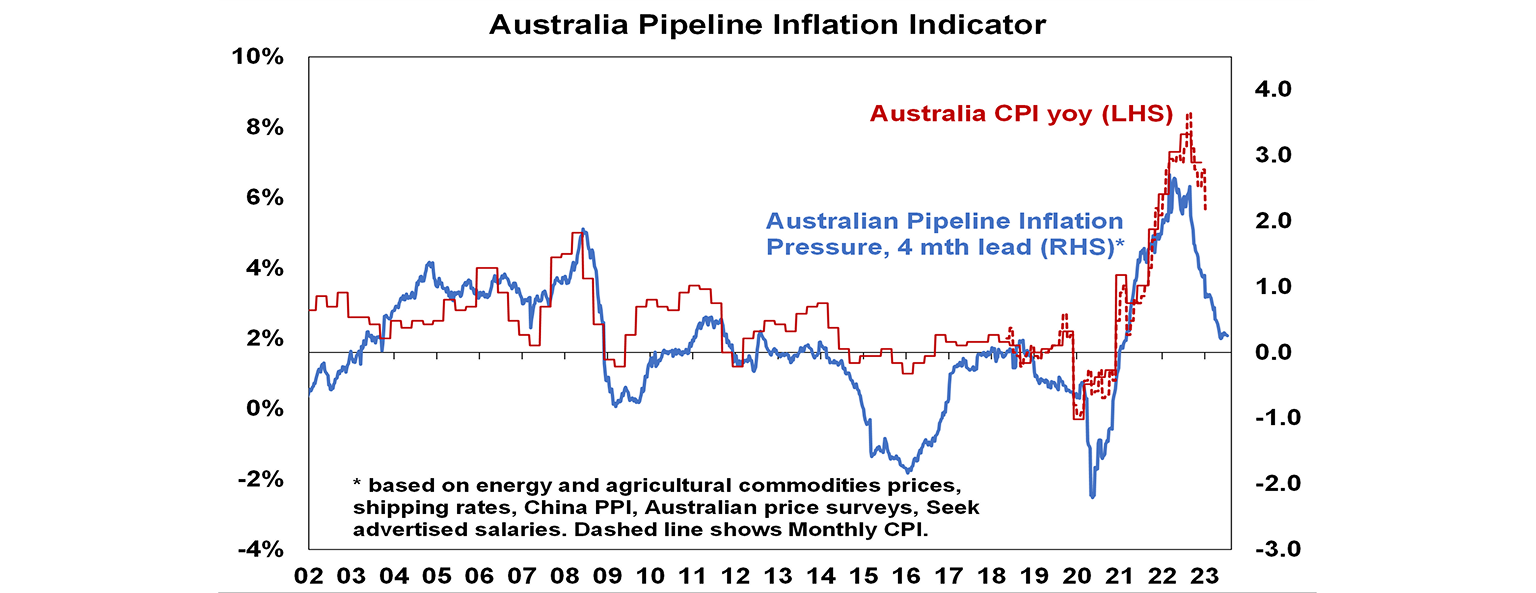
Chart 3 – unemployment and underemployment
Also critical is the tightness of labour markets as this will determine wages growth which has a big impact on services inflation. If wages growth accelerates too much in response to high inflation, it risks locking in high inflation with a wage-price spiral which would make it harder to get inflation down. Unemployment and underemployment are key indicators of whether this will occur or not. Both remain low in the US & Australia (putting upwards pressure on wages), but there is increasing evidence that labour markets are cooling. Wages growth is still rising in Australia (with the announcement effect of faster increases in minimum and award wages adding to this) but wages growth in the US looks to have peaked.
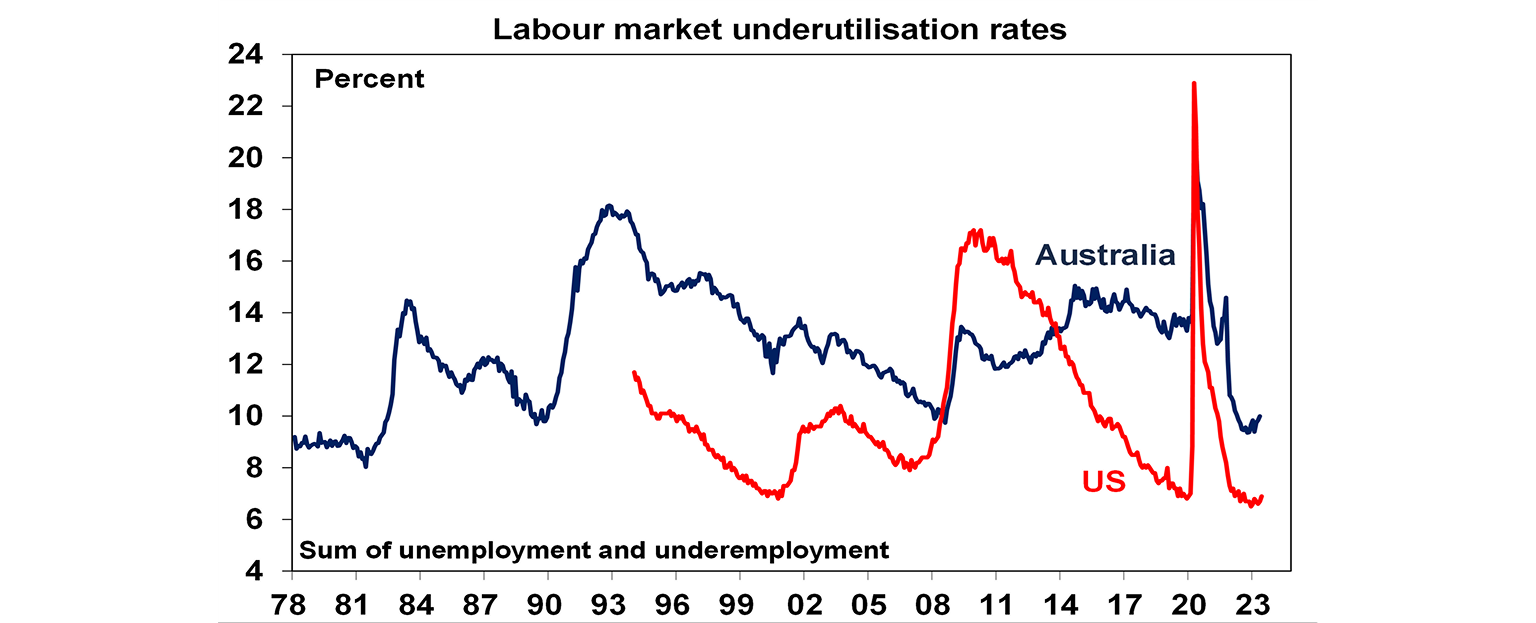
Chart 4 – longer term inflation expectations
The 1970s experience tells us the longer inflation stays high, the more businesses, workers and consumers expect it to stay high and then they behave in ways which perpetuate it – in terms of wage claims, price setting and tolerance for price rises. The good news is that short term (1-3 years ahead) inflation expectations have fallen sharply & longer-term inflation expectations remain in the low range they have been in for the last three decades. This is very different from 1980 when inflation expectations were around 10% and deep recession was required to get inflation back down.
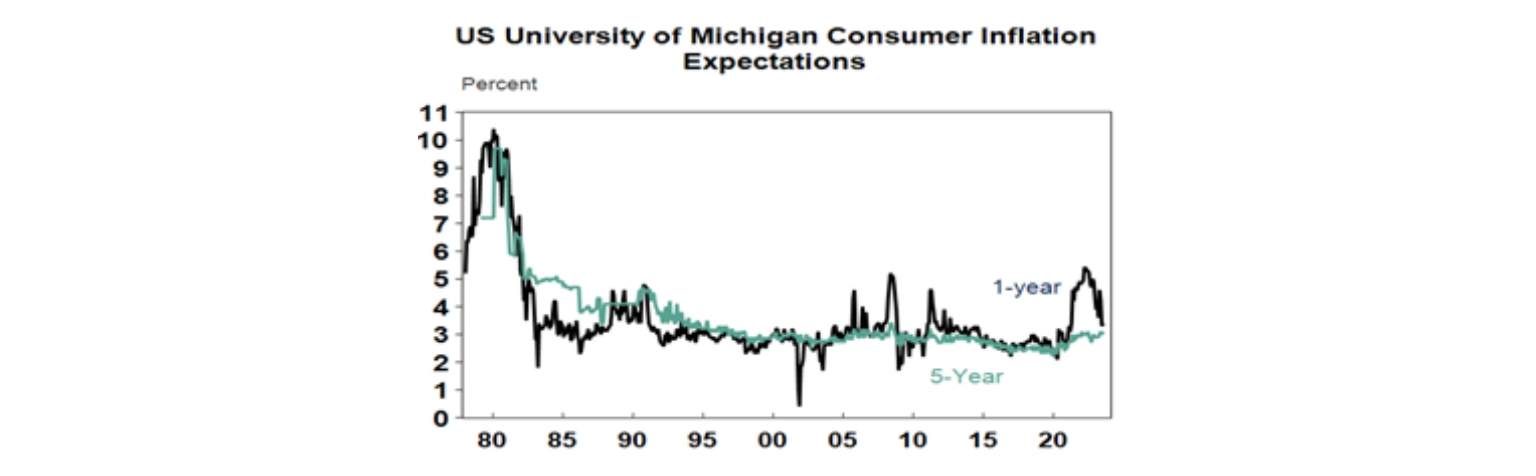
Chart 5 – earnings revisions
Consensus US and global earnings growth expectations for this year have been downgraded to around zero with a 10% rise next year and for Australia the consensus expects a 3% fall this financial year.
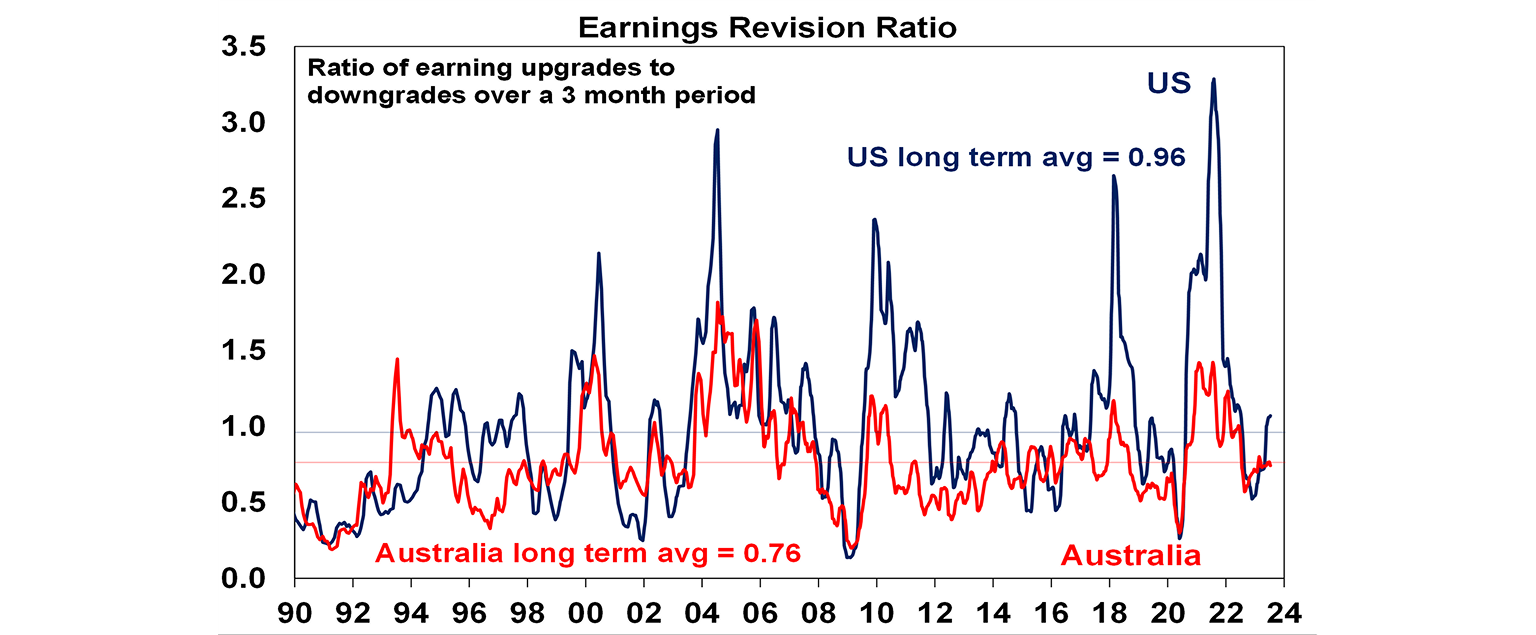
A recession resulting in an earnings slump like those seen in the early 1990s, 2001-03 in the US and 2008 would be the biggest risk but recently revisions to earnings expectations have been moving up.
Chart 6 – the gap between earnings and bond yields
Since 2020, rising bond yields have weighed on share market valuations. As a result, the gap between earnings yields and bond yields (which is a proxy for shares’ risk premium) has narrowed to its lowest since the GFC in the US and Australia. Compared to the pre-GFC period shares still look cheap relative to bonds, but this is not the case compared to the post GFC period suggesting valuations may be a bit of a constraint to share market gains as current uncertainties suggests investors may demand a risk premium over bonds similar to that seen post GFC as opposed to what was seen pre GFC. Australian share valuations look a bit more attractive than those in the US though helped by a higher earnings yield (or lower PEs). Ideally bond yields need to decline and earnings downgrades need to be limited.
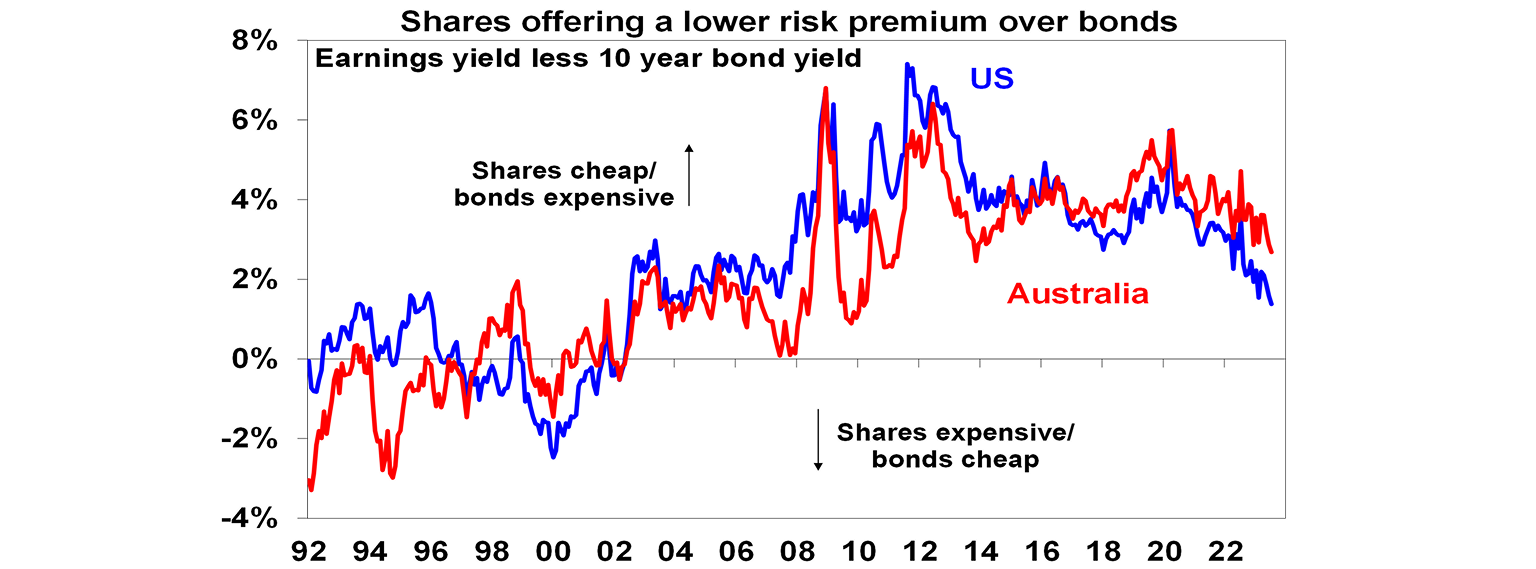
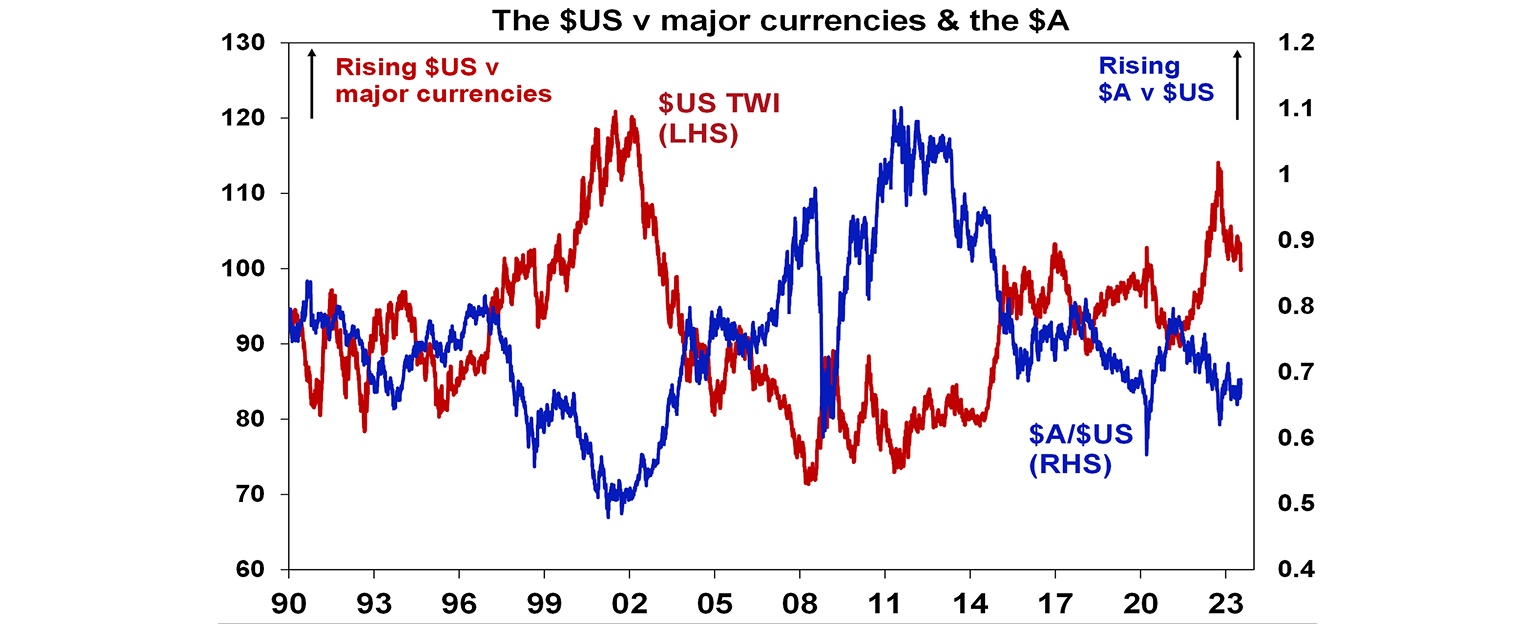
Chart 7 – the US dollar
Due to the relatively low exposure of the US economy to cyclical sectors (like manufacturing), the $US tends to be a “risk-off” currency. In other words, it goes up when there are worries about global growth and down when the outlook brightens. An increasing $US is also bad news for those with $US denominated debt in the emerging world. So, moves in it bear close watching as a key bellwether of the investment cycle. Last year the $US surged with safe haven demand in the face of worries about recession, war and aggressive Fed tightening. Since September though it has fallen back as inflation and Fed rate hike fears eased and geopolitical risks receded. And after stalling over the last six months, it’s since broken down again. A further downtrend in the $US would be a positive sign for investment markets this year, whereas a sustained new upswing would suggest they may be vulnerable. So far it’s going in the right direction.
You may also like
-

Weekly market update 02-04-2026 Financial markets were taken on a roller coaster ride this week as we started and ended the week with promises of TACOs (Trump Always Chickens Out), though it turned out that we were fed NACHOs instead (Not Actually Changing Hormuz Opening)! -

Econosights - Middle East, Inflation and GDP The biggest market impact (so far) from the war in the Middle East has been on oil prices. This is because the region in and around Iran has significant oil reserves, energy facilities and control global oil shipping routes. -

How to spot an investment scam and stay one step ahead of them As investment scams become more advanced, it’s more important than ever to understand how they work, so you can learn how to spot them.
Important information
Any advice and information is provided by AWM Services Pty Ltd ABN 15 139 353 496, AFSL No. 366121 (AWM Services) and is general in nature. It hasn’t taken your financial or personal circumstances into account. Taxation issues are complex. You should seek professional advice before deciding to act on any information in this article.
It’s important to consider your particular circumstances and read the relevant Product Disclosure Statement, Target Market Determination or Terms and Conditions, available from AMP at amp.com.au, or by calling 131 267, before deciding what’s right for you. The super coaching session is a super health check and is provided by AWM Services and is general advice only. It does not consider your personal circumstances.
You can read our Financial Services Guide online for information about our services, including the fees and other benefits that AMP companies and their representatives may receive in relation to products and services provided to you. You can also ask us for a hardcopy. All information on this website is subject to change without notice. AWM Services is part of the AMP group.