


Econosights
Why has the unemployment rate remained low? |
In this article we look at what full employment means, what it looks like in Australia, why it’s likely to have fallen since the pandemic and the implications are for interest rates.
5 min read

Key points
- The level of the unemployment rate consistent with “full employment” in Australia has fallen.
- This means that the unemployment rate may not rise too much further, but wages growth will still slow.
- This is good news for inflation and means the RBA can start the rate cutting cycle, even if the labour market is holding up.
Introduction
The strength of the Australian labour market in 2024 was a surprise to most economists, including the Reserve Bank of Australia (RBA). The unemployment rate hovered in a range of 3.7%-4.2% through 2024, despite expectations that it would reach around 4.5%, which was also most economists expectation of the level of “full employment” or the Non-Accelerating Inflation Rate of Unemployment otherwise known as “NAIRU”. In this note we look at what full employment means, what it looks like in Australia, why it’s likely to have fallen since the pandemic and the implications are for interest rates.
What is NAIRU or full employment?
NAIRU or full employment is the maximum level of employment that is consistent with low and stable inflation (according to the RBA). The unemployment rate does not necessarily equal zero when full employment is reached because there will always be “frictions” in the labour market which includes seasonal workers, people in between jobs, skills of candidates not matching requirements.
At full employment, demand for labour (employment plus job vacancies) is roughly equal to the supply of labour (the size of the labour force). When demand for labour is above the supply of labour, the economy is operating above full employment (i.e. operating above spare capacity). In this situation, it will be harder for businesses to find staff. They may start offering workers higher wages to retain them and may offer higher wages to attract new workers. This tends to put upward pressure on wages growth and therefore inflation. When the demand for labour is below the supply of labour, the economy is operating below full employment (i.e. operating below spare capacity). In this economy, businesses can easily find other staff, so there is downwards pressure on wages growth, as employees are not trying to bargain between each other.
There are economic models that can be used to estimate the NAIRU, but there tends to be large variability around these estimates because the actual level of NAIRU is not observed directly, it has to be inferred by how the labour market is behaving and the level of wages growth. The RBA had been assuming that Australia’s current NAIRU was around 4.5%, and the Commonwealth Treasury was assuming around 4¼%.
The recent Australian labour market
Over the long run in Australia, labour supply has run above labour demand, with the two lines close to converging for the first time on record in 2022 (see the chart below).
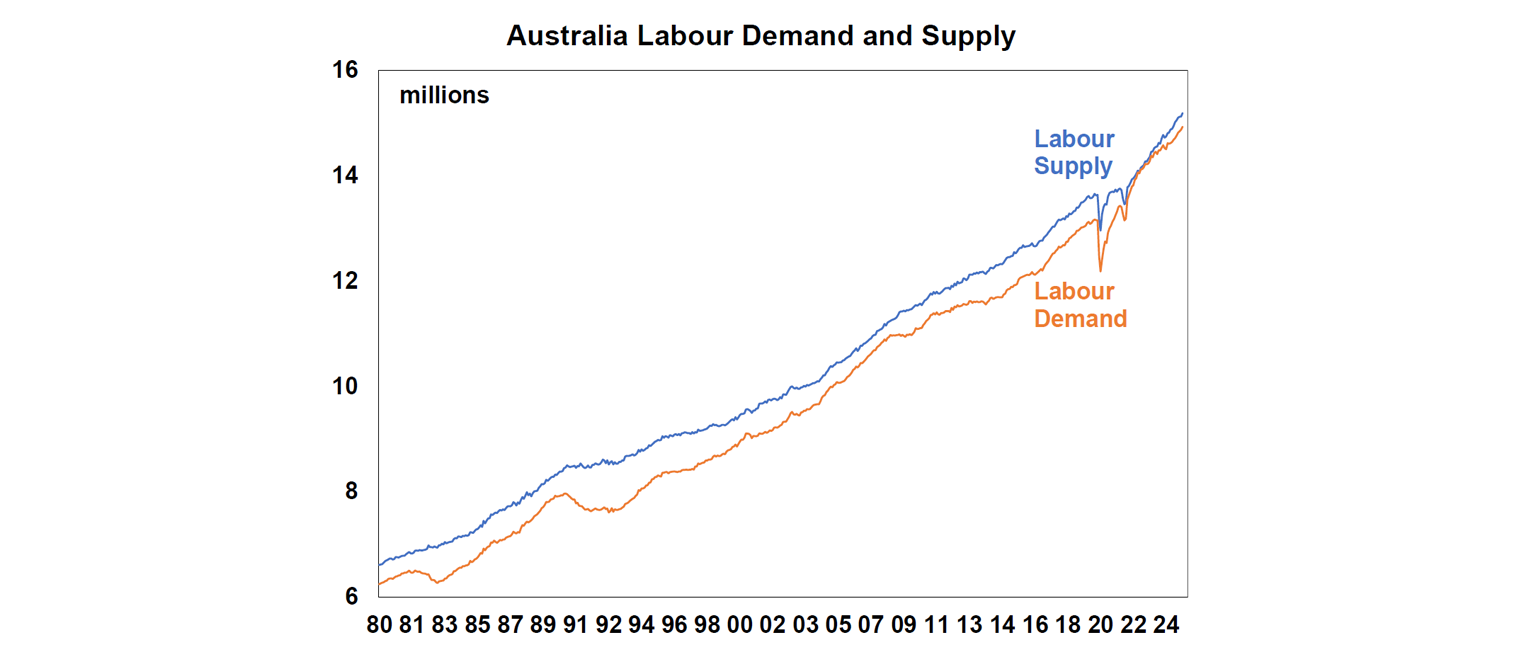
At this equilibrium point, the demand and supply of labour was close to equal. But the Australian labour market was operating like it was above spare capacity with the unemployment rate falling to a 48-year low of 3.4%, wages growth momentum picked up significantly (peaking at 4.3%pa) and leading indicators of the labour market including job vacancies, job ads and business hiring plans lifting to elevated levels.
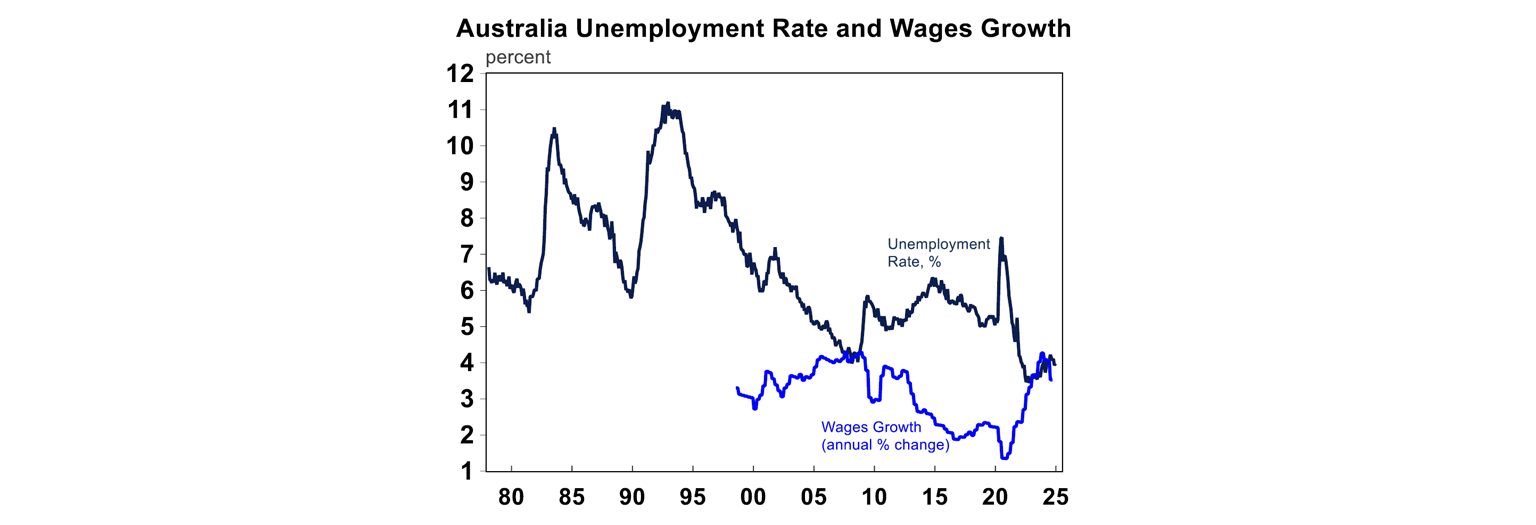
Since then, the labour market has gotten into better balance with labour supply outstripping demand again. The unemployment rate increased to a high of 4.2% in 2024 before declining a little with the December 2024 data showing the unemployment rate at 4%. Wages growth has moderated back to ~3.5%pa, coming in a little below expectations and December quarter wages growth is likely to be at just over 3%pa, which is back to its more normal long run average.
The slowing in wages growth has occurred alongside the unemployment rate not increasing significantly. This suggests that Australia’s NAIRU is lower than the 4.5% assumed by the RBA and is probably somewhere between 3.5-4%.
Factors that influence NAIRU
There are reasons for why NAIRU may have declined over time in Australia, including post-pandemic. The RBA have a comprehensive list of factors that have an impact on NAIRU here which we have summarised.
· Globalisation
A proxy for globalisation is global merchandise trade (exports and imports) as a share of GDP, which is around 46% at the moment, close to a record high. A higher supply of goods and services over time in Australia (for example players like Zara, H&M, Temu and Amazon) has increased competition for business. Businesses may find it harder to pass on price increases, as consumers can more easily switch to other supplies, which puts downward pressure on inflation. This means that NAIRU can be lower than it otherwise would have been, to see an acceleration in inflation.
· Government training and skills programs
Better government skills programs means that businesses are better able to find workers for that role, without having to increase wages. This means that NAIRU can be lower, before businesses have to start offering higher wages for staff. There isn’t much evidence that this has occurred in Australia, as the NAB business survey - which asks businesses how hard it is to find “suitable” labour - is still around its highs (meaning that businesses are still finding it hard to find the right staff).
· The ease of finding suitable work
The easier that businesses are able to find suitable workers, the quicker the “matching” process between employee and job which increases the pool of workers and means a lower NAIRU. This has probably occurred over recent years in Australia, given technological developments and the growth of digital jobs sites.
· Employee bargaining power
Lower bargaining power (for example due to lower union membership) reduces the ability of workers to demand higher wages which means that you need a lower unemployment rate to get higher wages growth. Australia has had a long-term decline in trade union membership (in 1976 51% of employees were in a union and by 2024 this was 13%) which could have lowered NAIRU. But in 2024, the Federal government introduced new industrial relations laws “Secure Jobs, Better Pay” which arguably gives more power back to employees so this may have some long-term upside impacts for NAIRU.
· The level of underemployment
Underemployment is a measure of those who want and are available to work more hours. When underemployment is high, businesses could increase the hours of existing workers, rather than compete with other businesses to hire new workers by increasing wages. This means that high underemployment puts downward pressure on NAIRU (and vice versa). Australia had high underemployment prior to the pandemic, ~8.5% (versus a long-run average of 6%) which may have pushed down NAIRU.
· Long-term unemployment
The long-term unemployed are those that have been unemployed for 52 weeks or more. If there are periods of high long-term unemployment, this can reduce the number of suitable workers available, and lift NAIRU as businesses have to compensate good workers with higher wages. However, if businesses find that it is too hard to find appropriate workers, then they may hire people with lower skills which could actually reduce NAIRU over time. Australia’s long-term unemployment rate was trending up in the 10 years prior to the pandemic (with 25% of unemployed persons being long-term) but has fallen since then.
Most of these factors suggest that over many years, Australia’s NAIRU has declined. Since the pandemic, NAIRU looks to have fallen even further, most probably because the availability of workers was hard to get, so businesses had to hoard onto workers and employ any available workers (that were previously out of the labour force or underemployed). The big boost to public sector jobs (which tend to have lower average wages) probably also played a role in reducing NAIRU.
Implications for investors
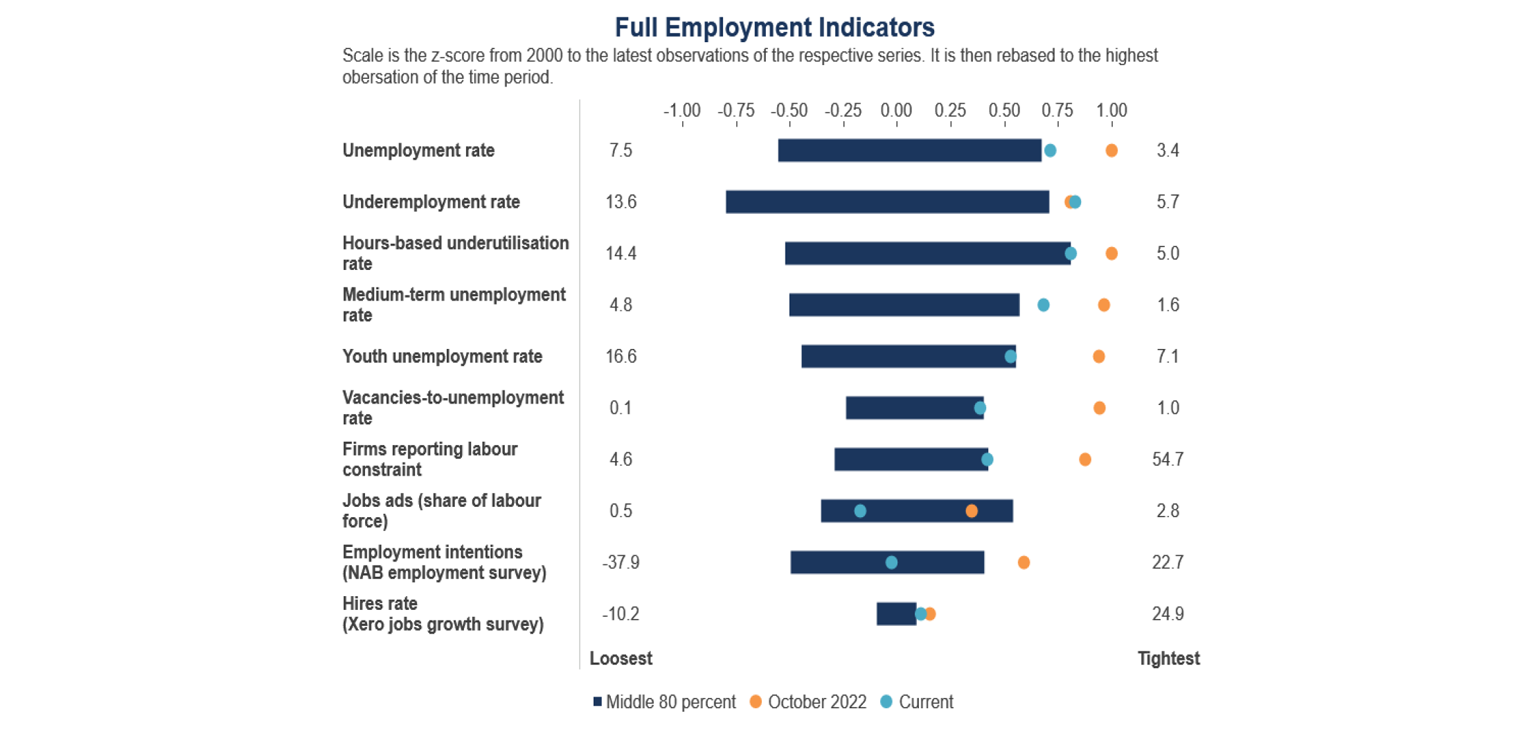
The RBA has a dual mandate of price stability and full employment (the full employment mandate was made more explicit following the RBA review). While there is no formal targeted level of NAIRU, the RBA looks at a whole list of full employment indicators (see the table below) and most of these suggest that the labour market has moved away from operating above spare capacity. Given the likelihood that NAIRU has fallen in Australia over the long-term (and more specifically since the pandemic), it appears like Australia can sustain an unemployment rate around 4% (we expect the unemployment rate to peak around 4.2%) without causing unnecessary upwards pressure on wages growth and therefore inflation. In this sense, the strength in the labour market data recently may not end up being an obstacle for the RBA to cut interest rates sooner, rather than later.
There is a high chance of a 0.25% rate cut at the February RBA meeting, which would take the cash rate from 4.35% to 4.1%. If the December quarter inflation data (released before the RBA board meeting) shows trimmed (or core) inflation up by 0.5% over the quarter (or 3.2% year on year), this should be enough for the RBA to cut the cash rate, despite the good jobs data report for the month of December.
Diana Mousina, Deputy Chief Economist, AMP
Important note
While every care has been taken in the preparation of this document, neither National Mutual Funds Management Ltd (ABN 32 006 787 720, AFSL 234652) (NMFM), AMP Limited ABN 49 079 354 519 nor any other member of the AMP Group (AMP) makes any representations or warranties as to the accuracy or completeness of any statement in it including, without limitation, any forecasts. Past performance is not a reliable indicator of future performance.
This document has been prepared for the purpose of providing general information, without taking account of any particular investor’s objectives, financial situation or needs. An investor should, before making any investment decisions, consider the appropriateness of the information in this document, and seek professional advice, having regard to the investor’s objectives, financial situation and needs.This document is solely for the use of the party to whom it is provided.
This document is not intended for distribution or use in any jurisdiction where it would be contrary to applicable laws, regulations or directives and does not constitute a recommendation, offer, solicitation or invitation to invest.