Investment markets and key developments
It was another negative week across most global sharemarkets as central banks remain hawkish and economic data holds up better than expected which means higher interest rates (at least in the near-term). Sharemarkets also ran up too far in January, so some pull-back from high levels was likely. US markets were down by 2.6% over the week (and are around 17% below their 2021 highs), Australia was 0.5% lower (and 4% below its record highs), Eurozone shares were 2.3% lower (and are around 5% below their record highs), Japanese shares fell by 0.9% (with uncertainty around the implications for the Bank of Japan’s monetary policy settings with Ueda taking over as Governor in April) while Chinese share managed to rise by 0.7%. The $US rose this week and the $A declined to 0.6726 US dollars.
Global yields moved higher this week, especially in the short-end with US 2-year bonds back up to 4.8%, back up to 2007 highs. US 10-year bond yields are just over 3.9%, still below their October highs of 4.2%.
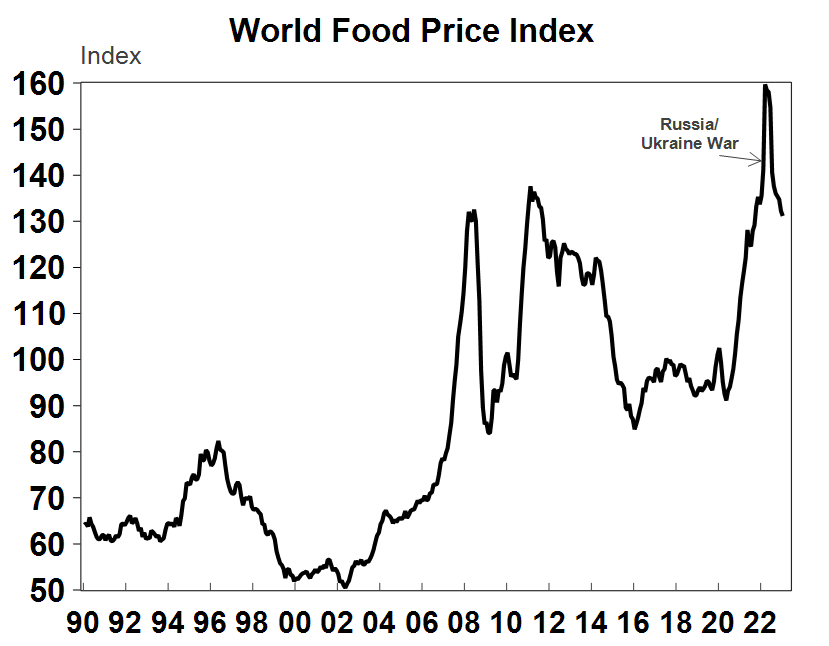
Global commodity prices were mixed this week. Oil prices remain down on their recent highs (with WTI prices at $83/barrel), gas prices continue to tumble and are 43% lower than a year ago, while iron ore prices rose remain high at $120/tonne. Global commodity prices have fallen by around 22% from their 2022 highs which are leading to fall in food prices (see the chart below) and will lead to lower food inflation.
Source: Macrobond, AMP
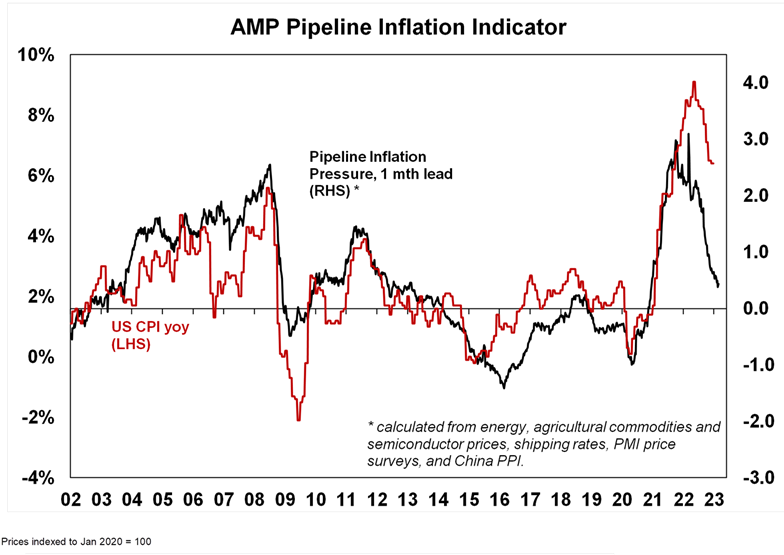
Lower commodity prices are feeding into our inflation indicator which is continuing to decline (see the chart below).
Source: Bloomberg, AMP
Geopolitical tensions remain high. US President Biden made an unexpected visit to Ukraine this week to meet with President Zelensky before the 1-year anniversary of the war. This comes ahead of a potential meeting between Chinese President Xi and Putin soon. Political tensions still remain a big downside risk for sharemarkets.
There was a lot of talk about superannuation reform in Australia this week after Treasurer Jim Chalmers made comments around the need to make the superannuation system “equitable” and “sustainable”. While there were no new policy announcements on the back of this, it did cause some concerns that there would be changes to the tax treatment of retirement savings. There are likely to be some minor changes to superannuation announced in the May Federal Budget, around caps on very large super balances (over $3mn) but no changes to concessional tax rates are likely.
Economic activity trackers
Our Economic Activity Trackers declined in the US and Europe and rose in Australia over the past week (see the chart below). In the US, job advertisements and mortgage applications declined. Europe saw an improvement in consumer confidence but restaurant bookings and truck mileage were down. While the Australian tracker has been volatile over recent weeks, but this week there was a lift in restaurant bookings, credit card spending and weekly consumer confidence.
Based on weekly data for eg job ads, restaurant bookings, confidence, mobility, credit & debit card transactions, retail foot traffic, hotel bookings. Source: AMP
Major global economic events and implications
Global PMI’s improved in February, confirming other signs that the global economy was hotter than expected at the start of the year (see the chart below). The Australian composite PMI rose to 49.2 in February (from 48.5) although it is still below 50 which means that activity is contracting. Services activity accounted for the bulk of the improvement in February. The US composite PMI rose significantly to 50.2 (from 46.8) which means it is back in “expansion” while the Eurozone composite reading rose to 52.3, from 50.3 in January.

Source: Bloomberg, AMP
PMI price measures showed a decline in input prices while output prices ticked up slightly (see the chart below) which shows the current mixed inflation environment.

Source: Bloomberg, AMP
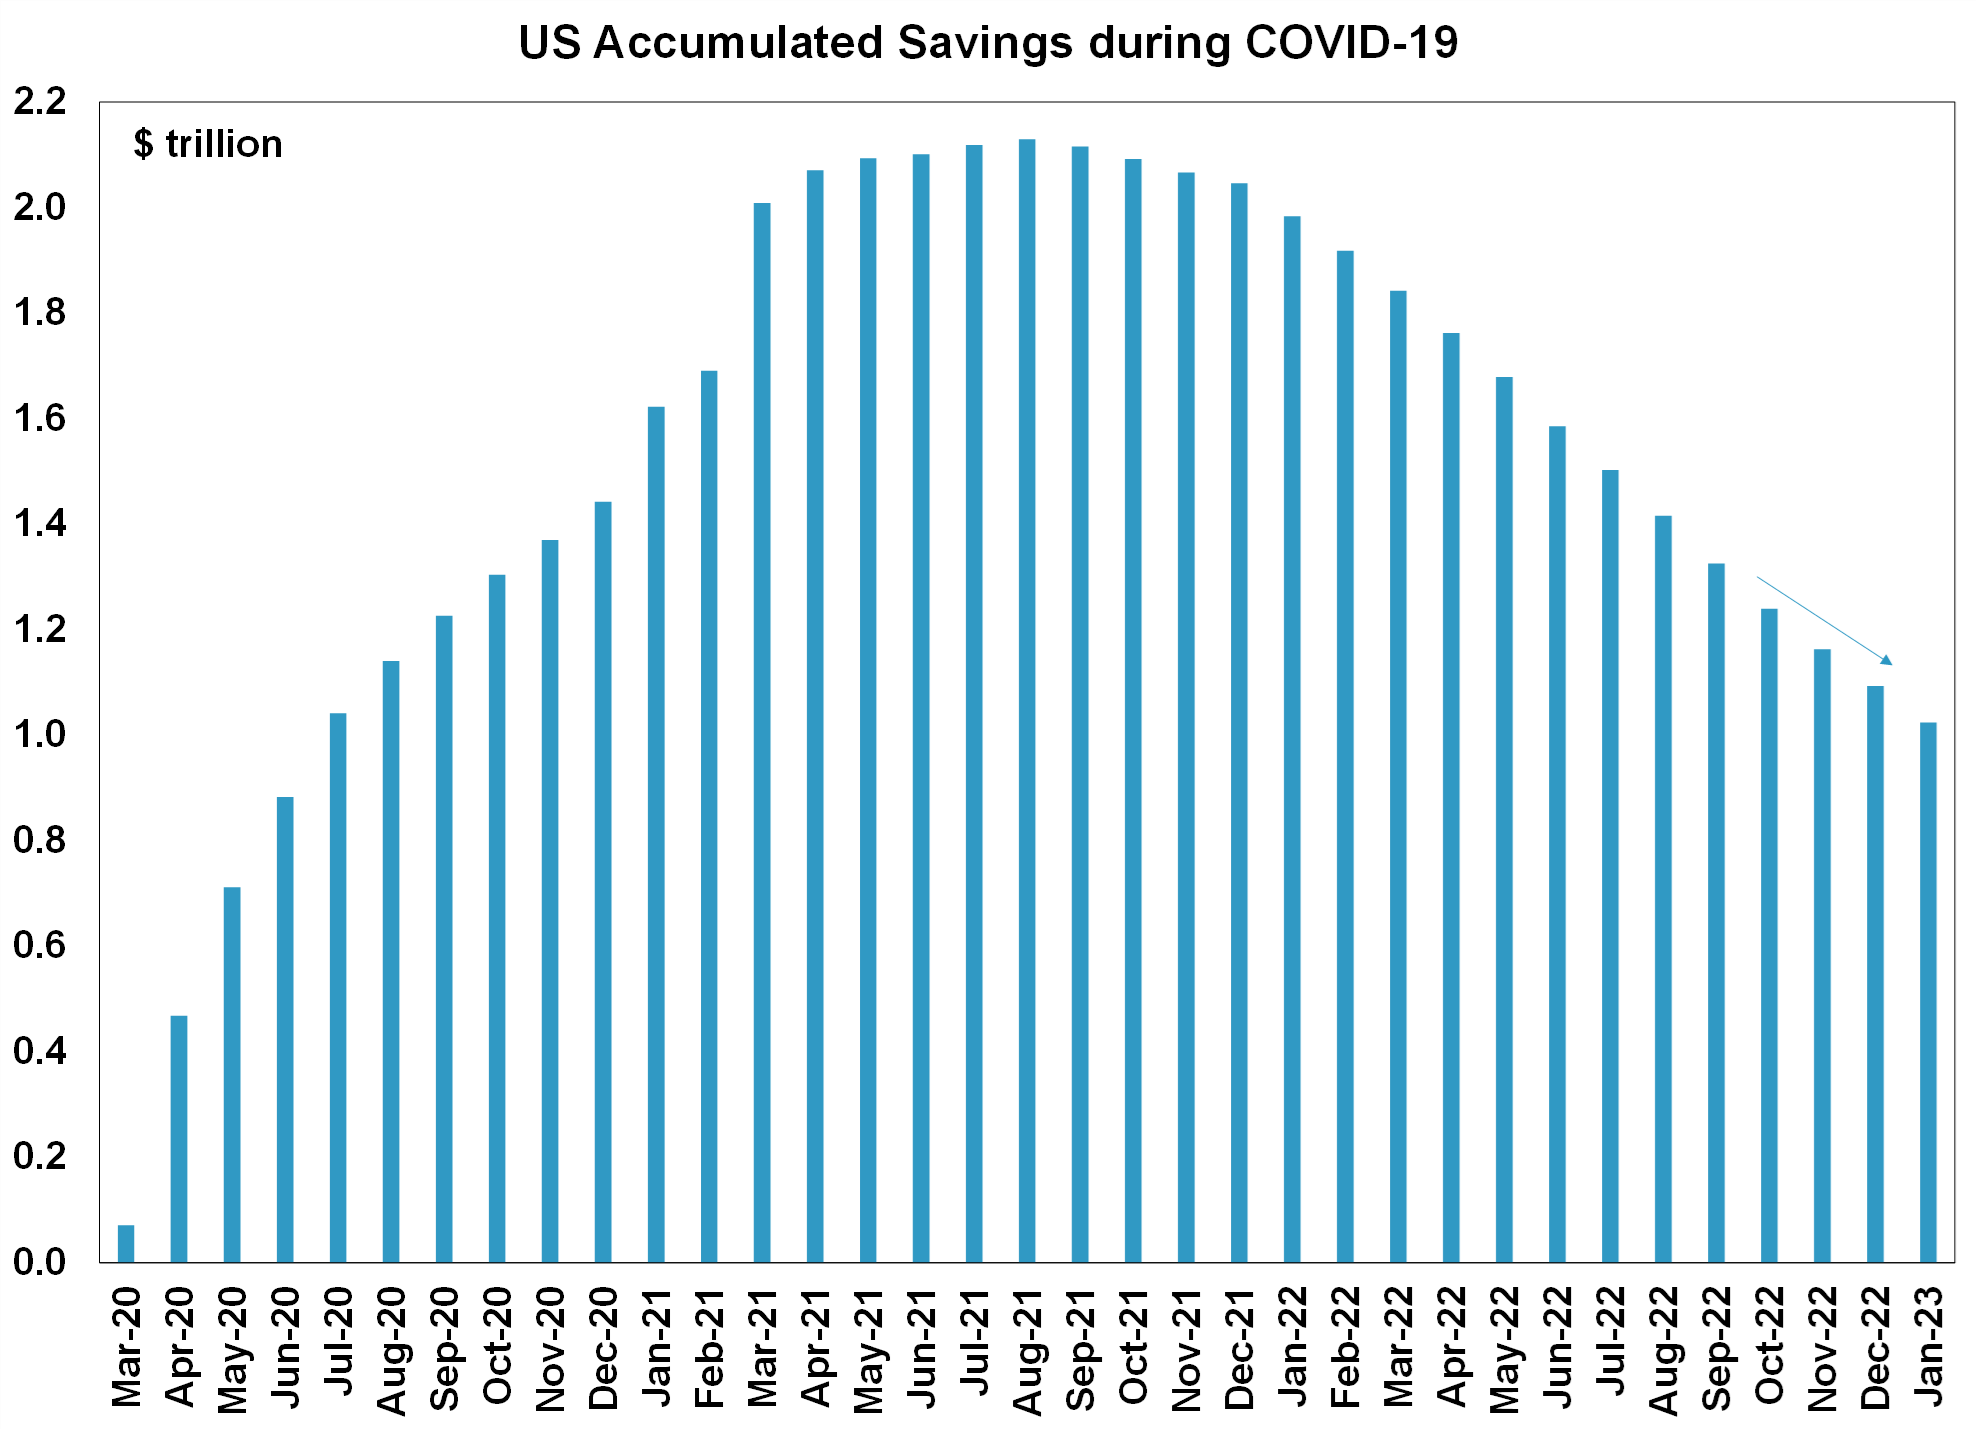
In the US, the February FOMC meeting minutes showed relatively little disagreement amongst members around hiking by a softer 0.25% (same as the increase to the Fed Funds rate in February), despite comments from some FOMC members last week that indicated desire for higher (0.50%) rate increases. Fed members still anticipate a few more interest rate increases from here, which is consistent with recent market pricing. We expect the Fed Funds to reach a target band of 5.25-5.5%. The January Personal Consumption Expenditure (PCE) deflators were hotter than expected. The headline PCE was 5.4% higher than a year ago (consensus was looking for 5% and the core deflator was 4.7% higher while consensus was looking for 4.3%.). This is another confirmation that inflation turned up again at the beginning of 2023 (although the trend is still down) which will keep pressure on the Federal Reserve to raise rates further. US March quarter earnings are close to wrapping up, with 93% of companies finished reporting results. Around 69% of earnings have surprised on the upside, compared to a historical average of 76% and earnings growth is still running around -2% compared to a year ago. December quarter GDP was revised down to 2.7% annualised (from 2.9% previously) because of weaker consumer spending, weekly jobless and continuing claims fell again and January existing home sales declined in January. US income/spending data showed that another fall in consumer accumulated savings, which have halved from their Covid peak (see the chart below).
Source: Macrobond, AMP
Eurozone data continues to show some improvement in the economy from late 2022. Consumer confidence was up in February (although it is still negative) but is now back to its highest level since March 2022, ZEW expectations of economic growth rose in February, up to its highest level in a year and the German IFO business climate survey showed an improvement in current conditions and for the outlook.
The Reserve Bank of New Zealand increased the overnight cash rate by 0.50%, to 4.75% which was expected by markets. The central bank discussed doing a 0.75% rate rise, but opted for a smaller increase, although still expects the overnight cash rate to reach a peak of 5.5%. The recent cyclone in New Zealand will put more upward pressure on inflation (although the central bank will look through these impacts as they are temporary).
Canadian December retail sales (excluding autos) were weaker than expected, down by 0.6% over the month, a sign of interest rate rises impacting consumer demand. Consumer prices were up by 0.5% in January (below consensus) and by 5.9% over the year, which is well down from its high of 8.1% in mid-2022.
In China, the People’s Bank of China kept the loan prime rate unchanged at 3.65%.
In Japan, consumer prices rose by 4.3% over the year or 3.2% in core terms, the highest rate of growth since the 1990’s and with more inflation pressure likely, given recent talk around wage increases potentially reaching 3% per annum.
Australian economic events and implications
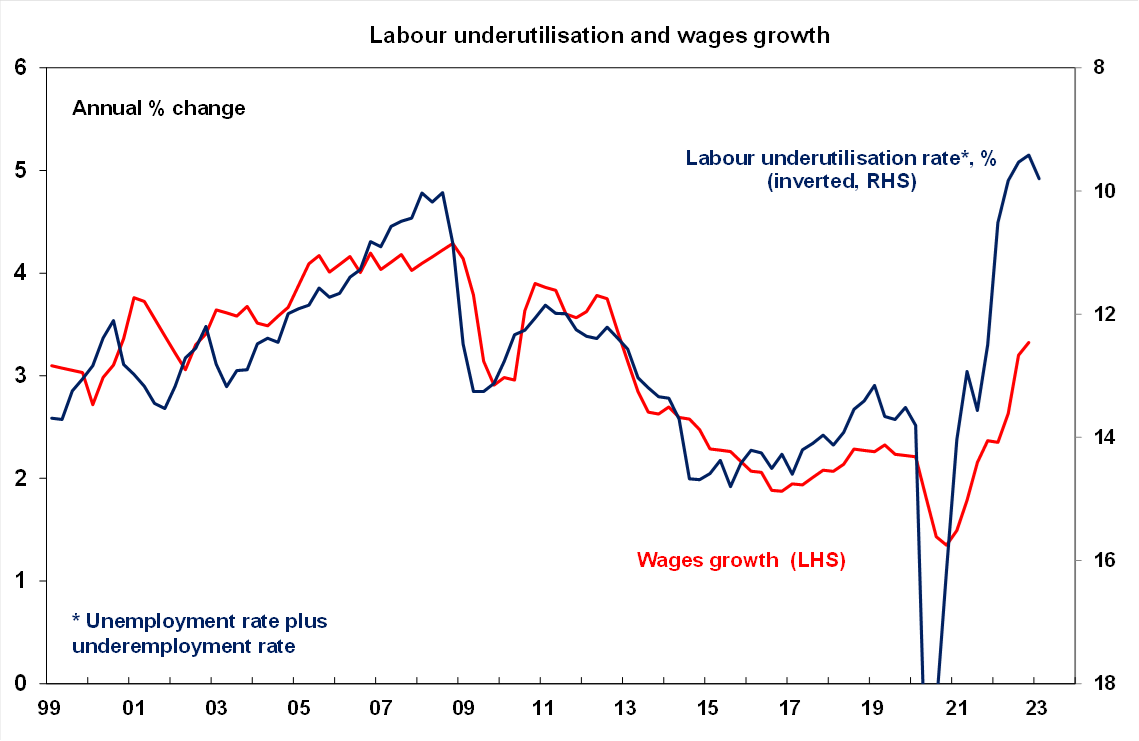
Australian March quarter wages data disappointed expectations, rising by 0.8% (below the 1% anticipated by economists) which took annual growth to 3.3%. While annual wages growth is running at its highest pace in 10 years, it was expected to be higher given the tightness in the labour market (the unemployment rate is close to a 48-year low, labour underutilisation is around its lowest levels since the early 1980’s and the participation rate is close to a record high – see the chart below). We expect wages growth will end the year around 3.8%, which would be its highest pace since 2012 but it would be below the RBA’s forecasts of ~4.2%. The RBA’s hawkishness will be challenged by the wages data and we expect that the RBA is closer to a pause in its tightening cycle than the market is predicting. We see one more rate rise in March, taking the cash rate to a restrictive level of 3.6%. But, increases in the cash rate after that time will be hard to justify if the data continues to show a slowing in the jobs market, weakening retail spending and a decline in forward-looking inflation indicators.
Source: ABS, AMP
Another measure of wages growth, average weekly earnings rose by 3.7% over the year to November. This measure accounts for changes in the composition of the labour force, so it accounts for churn in the labour force (for example changing jobs) so is not a pure price measure, like the wage price index.
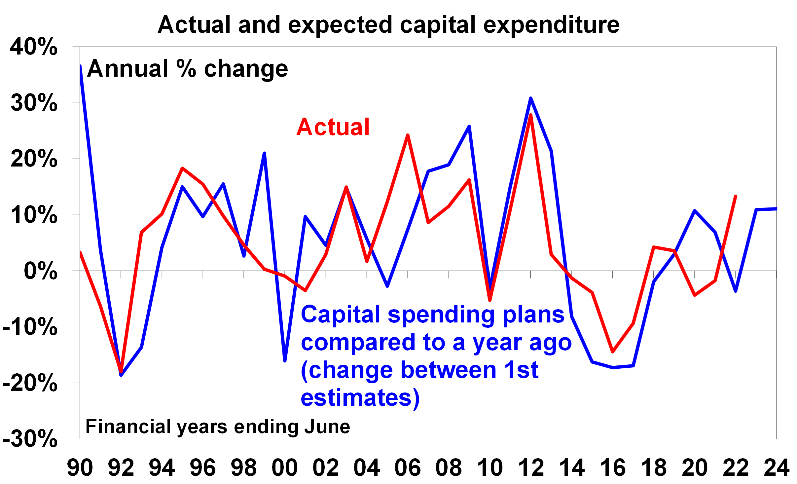
The February RBA Board minutes were hawkish, showing that Board participants debated a 0.25% and a 0.50% increase to the cash rate, which was a departure from the consideration to pause at the December board meeting. This was due to the higher-than-expected December quarter underlying inflation readings. As a result, market pricing for the peak cash rate lifted and is now showing a peak of around 4.3% and pushing back rate cuts into 2025 (rather than in 2024). Construction work done data was weak, down by 0.4% in the December quarter which will weigh on GDP growth (released next Wednesday), capital expenditure data rose by a solid 2.2% in the December quarter, with machinery and equipment up 0.6% and other structures 3.6% higher. The first estimate of 2023-24 capital spending showed that firms expected to spend $129.7bn, higher than expectations and indicates that capital spending over 2023 24 will be around 11% higher (see the chart below). Business investment continues to hold up well. However, business investment is typically a less interest rate sensitive area and mining investment is doing well thanks to high commodity prices.
Source: ABS, AMP
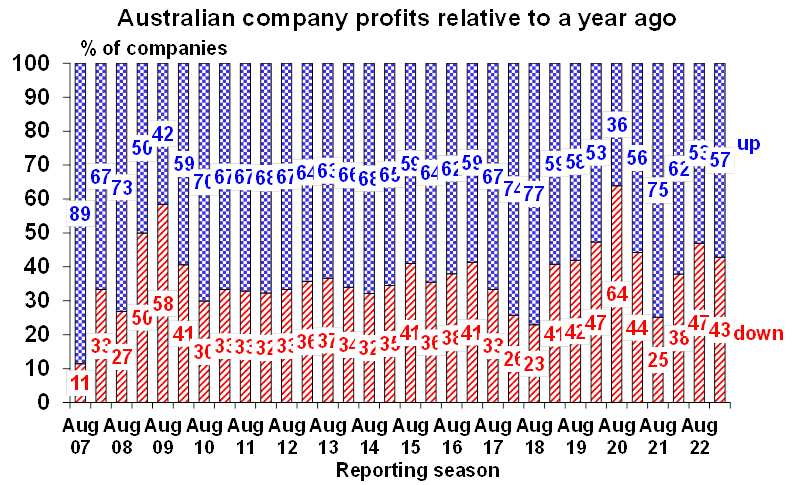
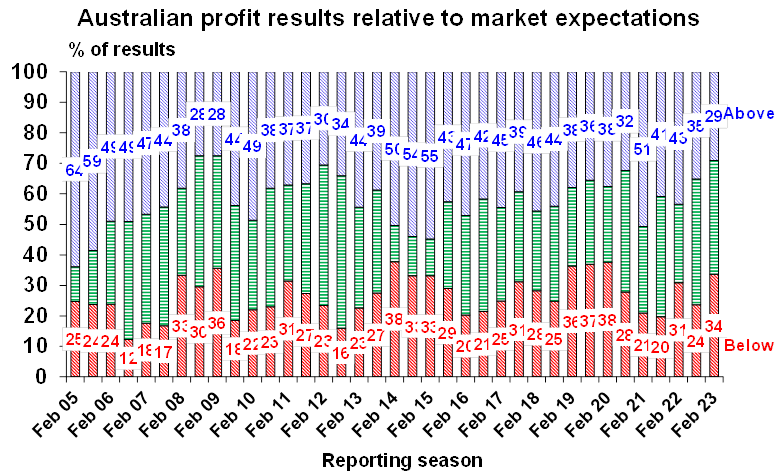
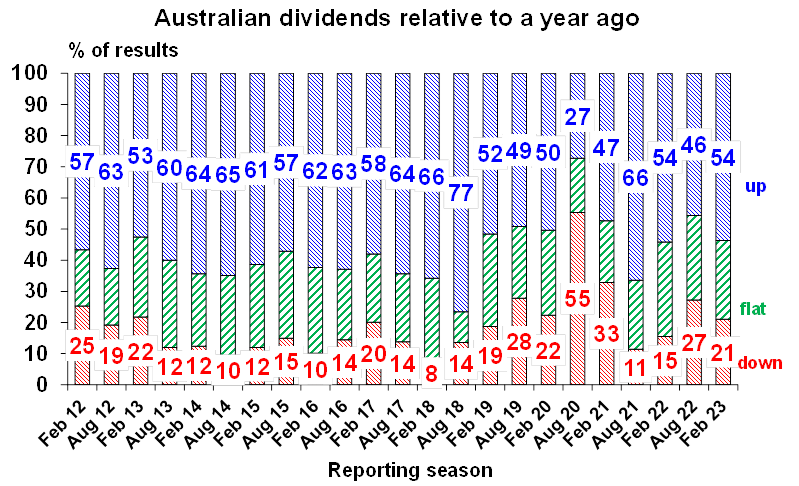
The Australian December half earnings reporting season is nearly done, with 86% of companies reporting results and so far, it’s been pretty mixed resulting in downgrades to earnings growth expectations. The good news is that 57% of companies have seen earnings up on a year ago and 54% have increased their dividends both of which is an improvement on the August reporting season although both were still below average. While companies appear to have so far weathered cost pressures and rate hikes reasonablywell, corporate comments suggest that the post Christmas trading environment for consumer facing companies appears to be getting tougher with increasing resistance to buying big ticket items and some shifting to discount stores. Bank earnings are also showing signs of having peaked with credit growth slowing, interest margins likely to deteriorate and bad debts likely to rise. As a result, consensus earnings expectations for this financial year have been revised down from 7.7% to 7.2%.
Source: AMP
What to watch over the next week?
There is plenty of activity data to watch in Australia. Business inventories are expected to decline slightly in the December quarter, company profits are likely to be down by 2% over the December quarter given the fall in the terms-of-trade and net exports should add 1.3 percentage points to quarterly GDP growth. The December quarter balance on payments is expected to show the current account moving back into a surplus, worth $8.3bn or 1.3% of GDP. December quarter GDP (released on Wednesday) is expected to be solid, we are forecasting a 0.9% lift in growth over the quarter or 2.9% over the year. The Australian economy looks to have ended 2022 on a solid footing but is likely to deteriorate in 2023 as impacts of rate hikes flow through to the consumer. January retail sales will be closely watched after the fall in December, we expect a bounce back of 1.5% over the month. The monthly consumer price index is likely to be soft, after the large lift in December and we expect flat growth over the month or 7.9% year on year. January building approvals are likely to fall by 12% after a big lift in the prior month from a big boost in apartment approvals. January private sector credit is expected to rise by 0.3%, February home prices look to be flat over the month (with Sydney prices up for the first time in 12 months) and January housing lending data is likely to fall by 1.5%, following months of declines.
US economic data next week includes January durable goods which are expected to decline, the February Conference Board consumer confidence data should improve marginally in February, the manufacturing ISM is expected to improve (although remain below 50) in February while the services ISM is expected to soften (but is still outpacing manufacturing and is positive). There are also some speeches from US Fed members.
European data includes January money supply, economic confidence readings which should rise again, February consumer and producer price data which will show a further easing in inflation and the unemployment rate for January.
In China, data includes the official February manufacturing/non-manufacturing PMI’s and the non-official Caixin PMI releases (which more reflect small businesses). The Chinese National People’s Congress also begins on 5 March, which will see new economic policy targets, agendas and near-term policies as well as a reshuffling of government officials.
In Japan watch for January industrial production (expected to decline) and retail sales (likely to show a small increase over the month).
Outlook for investment markets
2023 is likely to see easing inflation pressures, central banks moving to get off the brakes and economic growth weakening but proving stronger than feared. This along with improved valuations should make for better returns in 2023. But there are likely to be bumps on the way – particularly regarding interest rates, recession risks, geopolitical risks and raising the US debt ceiling around mid-year.
Global shares are expected to return around 7%. The post mid-term election year normally results in above average gains in US shares, but US shares are likely to remain a relative underperformer compared to non-US shares reflecting still higher price to earnings multiples (17.5 times forward earnings in the US versus 12 times forward earnings for non-US shares). The $US is also likely to weaken which should benefit emerging and Asian shares.
Australian shares are likely to outperform again, helped by stronger economic growth than in other developed countries and ultimately stronger growth in China supporting commodity prices and as investors continue to like the grossed-up dividend yield of around 5.5%. Expect the ASX 200 to end 2023 at around 7,600.
Bonds are likely to provide returns a bit above running yields, as inflation slows and central banks become less hawkish.
Unlisted commercial property and infrastructure are expected to see slower returns, reflecting the lagged impact of weaker share markets and last year’s rise in bond yields (on valuations).
Australian home prices are likely to fall another 8% or so as rate hikes continue to impact, resulting in a top to bottom fall of 15-20%, but with prices expected to bottom around the September quarter, ahead of gains late in the year as the RBA moves toward rate cuts.
Cash and bank deposits are expected to provide returns of around 3.25%, reflecting the back up in interest rates through 2022.
A rising trend in the $A is likely over the next 12 months, reflecting a downtrend in the overvalued $US, the Fed moving to cut rates and solid commodity prices helped by stronger Chinese growth.

Weekly market update 22-11-2024
22 November 2024 | Blog Against a backdrop of geopolitical risk and noise, high valuations for shares and an eroding equity risk premium, there is positive momentum underpinning sharemarkets for now including the “goldilocks” economic backdrop, the global bank central cutting cycle, positive earnings growth and expectations of US fiscal spending. Read more
Oliver's insights - Trump challenges and constraints
19 November 2024 | Blog Why investors should expect a somewhat rougher ride, but it may not be as bad as feared with Donald Trump's US election victory. Read more
Econosights - strong employment against weak GDP growth
18 November 2024 | Blog The persistent strength in the Australian labour market has occurred against a backdrop of poor GDP growth, which is unusual. We go through this issue in this edition of Econosights. Read moreWhat you need to know
While every care has been taken in the preparation of this article, neither National Mutual Funds Management Ltd (ABN 32 006 787 720, AFSL 234652) (NMFM), AMP Limited ABN 49 079 354 519 nor any other member of the AMP Group (AMP) makes any representations or warranties as to the accuracy or completeness of any statement in it including, without limitation, any forecasts. Past performance is not a reliable indicator of future performance. This document has been prepared for the purpose of providing general information, without taking account of any particular investor’s objectives, financial situation or needs. An investor should, before making any investment decisions, consider the appropriateness of the information in this document, and seek professional advice, having regard to the investor’s objectives, financial situation and needs. This article is solely for the use of the party to whom it is provided and must not be provided to any other person or entity without the express written consent AMP. This article is not intended for distribution or use in any jurisdiction where it would be contrary to applicable laws, regulations or directives and does not constitute a recommendation, offer, solicitation or invitation to invest.
The information on this page was current on the date the page was published. For up-to-date information, we refer you to the relevant product disclosure statement, target market determination and product updates available at amp.com.au.