

Investment markets and key developments
The swerve in market attention from recession risks and volatility just a few weeks ago back to hopes for a soft landing shows how fast and fickle financial markets can be! The focus was on central bank communication this week, in anticipation of comments from Fed Chair Powell at the Jackson Hole Economic Symposium which ended up conforming the imminent start to the US rate cutting cycle. Economic data was mostly okay which helped to lift equities, with most major equity indices up (Australia +0.7% and US +1.5%). The market is still pricing in multiple Fed rate cuts before the end of the year and a rate cut from the RBA (despite the central bank’s rhetoric otherwise). US 10 year-bond yields are at 3.8%, well below their 2024 highs (of 4.7%). And the US dollar has weakened over the past two months alongside lower bond yields and expectations or rate cuts, with the $A now just under 0.68 US dollars.
What about the risks related to the Yen carry trade? The risks around this seem to have disappeared (for now at least) after the Bank of Japan said it would not raise rates further amidst the volatility. The large market moves around this event are a reminder that periods of changes to interest rates are a source of risk to markets, particularly if there are crowded trades.
Commodity price performance has been very mixed. Gold prices remain around a record high (see the chart below), with the value of a gold bar reaching $1million this week.
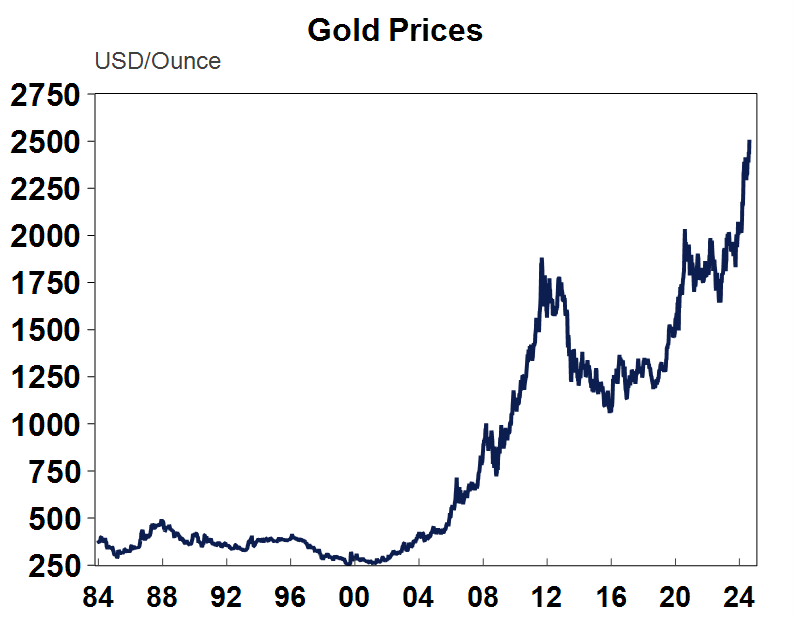
Source: Macrobond, AMP
After weakening in recent weeks, the iron ore price rose this week to $91/tonne after dropping to $88/tonne last which. Although, this is still down from over $100/tonne at the beginning of July, so it’s been a decent decline in price which is mostly due to concern around the Chinese economy. Commodities revenue is a big swing factor in Australia’s budget receipts. But, the iron ore price is basically tracking in line with Treasury’s forecasts in the budget (see the chart below) which expect prices to fall to $80 by September and $60 by March 2025. So, a hit to the budget will only occur if prices go below these assumptions.
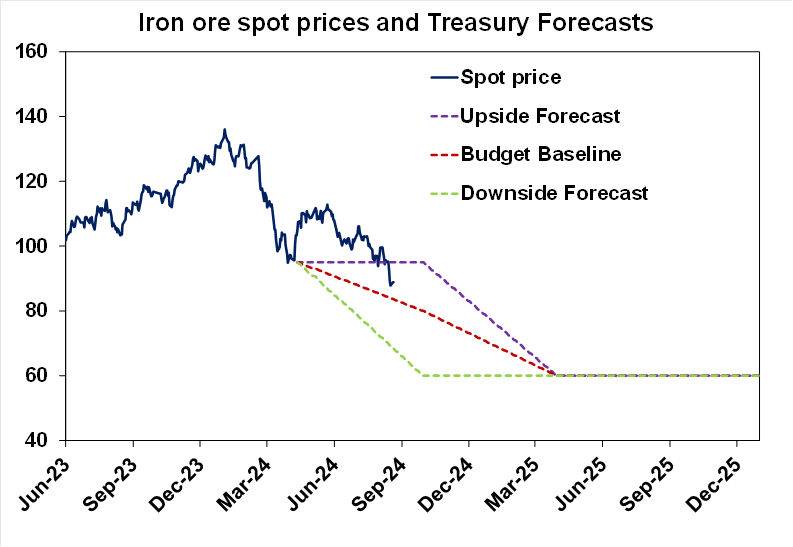
Source: Bloomberg, Treasury, AMP
Iron ore remains Australia’s single largest export. Metal ores and mineral (which is largely iron ore) exports make up 7% of GDP in both volume and value terms, although this share has fallen from its highs (see the chart below).
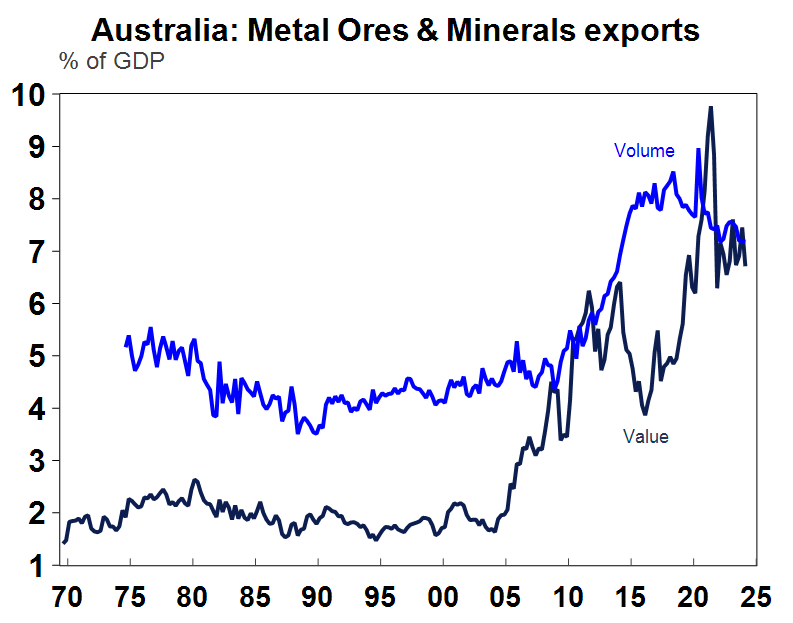
Source: Macrobond, AMP
The Democratic National Convention was on in Chicago this week where Vice President Kamala Harris and her running mate Governor Walz got the official nod as the Democratic Presidential and Vice Presidential nominees for the election in November. After strong momentum in support for the Democrats after Biden dropped out, the honeymoon appears over with betting odds narrowing again (see the chart below) and running at basically even probabilities. Independent candidate Robert F Kennedy Junior dropped out of the race this week and endorsed Trump which gave the Republicans a boost. If the economy can hold up (with inflation coming down and unemployment flat), the Democrats should get more support as the incumbent party. We are also yet to see many of Harris’s campaigns policy specifics which will change polling. Basically, the election remains a coin-toss!
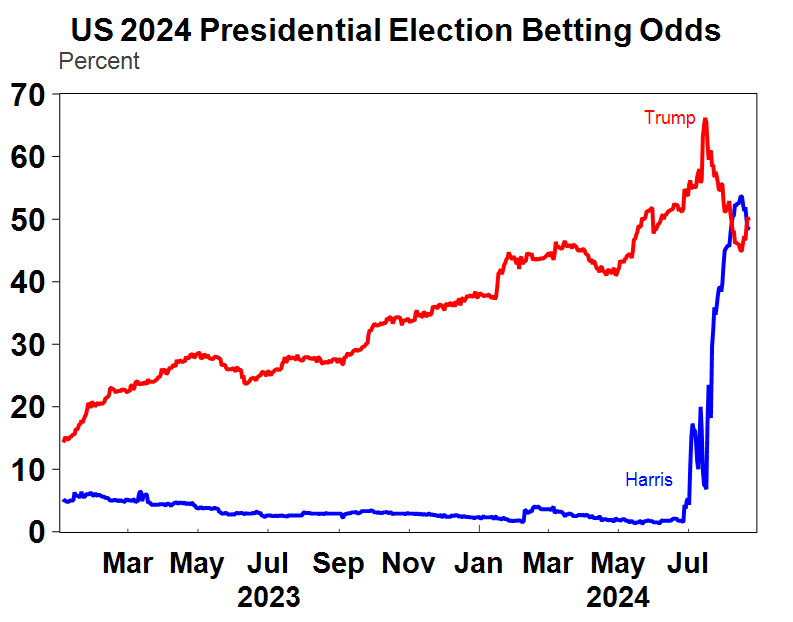
Source: Macrobond, RealClearPolitics, AMP
Major global economic events and implications
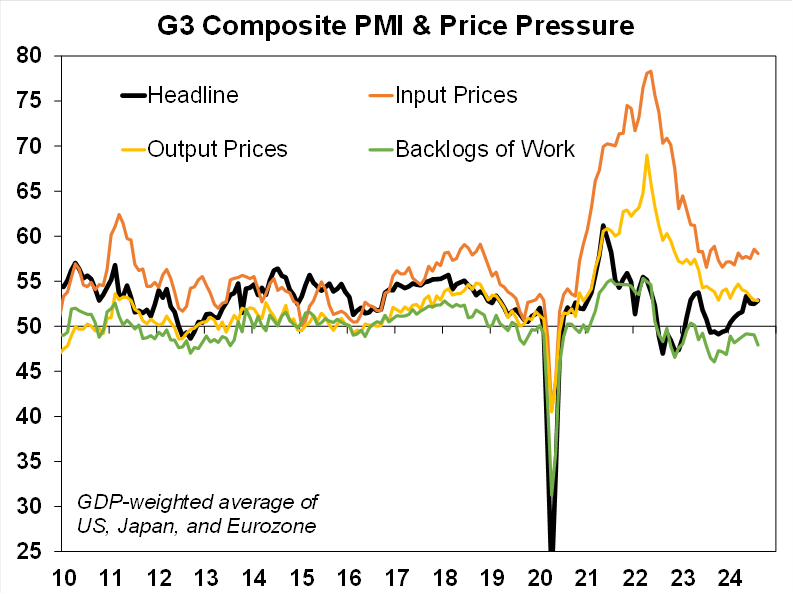
The global Purchasing Manages Indices (which are a great guide to global business conditions) showed that global activity is positive in the services industry but remains negative for manufacturing according to the August data. Eurozone services received a boost (related to the Olympics in France). US and Eurozone manufacturing indicators look very weak. Input prices have been trending a little higher in recent month, reflecting higher shipping costs related to the Red Sea conflict and some bad weather in Asia but output prices have trended down. Manufacturing activity tends to lead services, and the slowdown in global manufacturing means that services readings may weaken in coming months.
Source: Bloomberg,, AMP
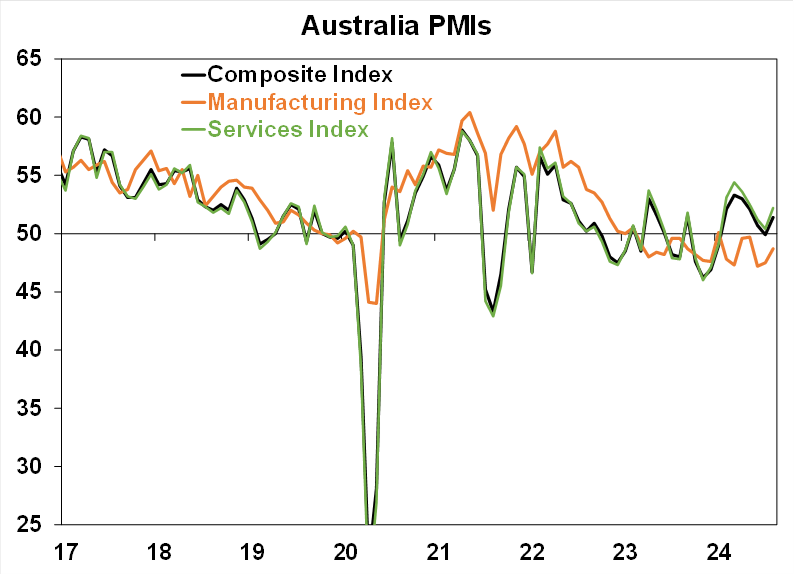
The Australian composite PMI rose in August to 51.4 (from 49.9 last month), with a rise in both manufacturing and services. However, manufacturing is still negative (see the chart below).
Source: Bloomberg, AMP
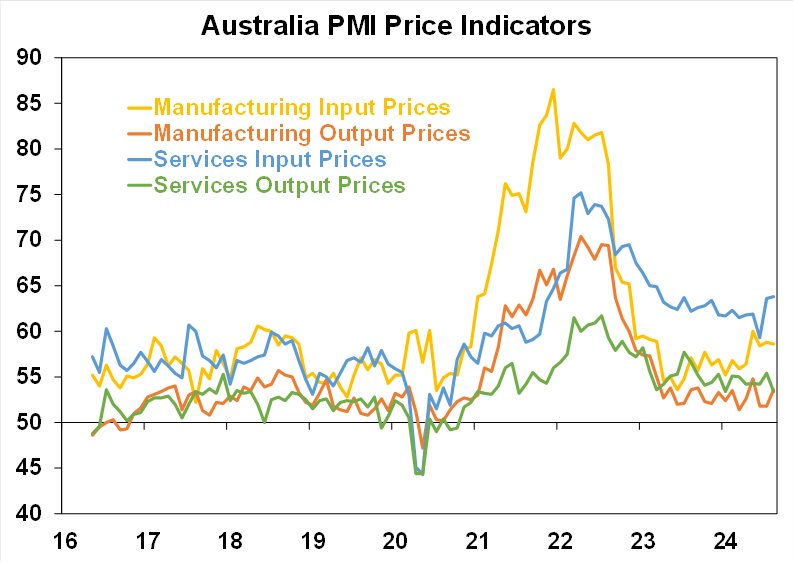
In August, the employment sub-index rose, new orders improved and price indicators were mixed with input prices rising (particularly in manufacturing) but output prices moderating (see the chart below). So, there wasn’t too much of a new signal from the PMI data – manufacturing remains weak and services activity is holding up and there are no signs of increasing price pressures.
Source: Bloomberg, AMP
Powell’s Jackson Hole speech on the “Economic Outlook” was bullish-dovish, as he said that “the time has come for policy to adjust” (i.e. it is time to start cutting interest rates) but also maintained that the central bank will “do everything [it] can to support a strong labour market. This was message was also confirmed in the July meeting minutes. The “vast majority” of members considered a rate cut in September as “likely appropriate”, and “several” even saw the case for easing in July. The Fed’s priorities have shifted from reducing inflation to maintaining the gains made in the labour market. Given that a September rate cut looks like a “done deal” now, the question will go to whether the next move in the Fed Funds rate should be a 25 or a 50 basis point interest rate cut. Powell did not give any signs about the size of the cut, noting that “the timing and pace of rate cuts will depend on incoming data, the evolving outlook and the balance of risks”.
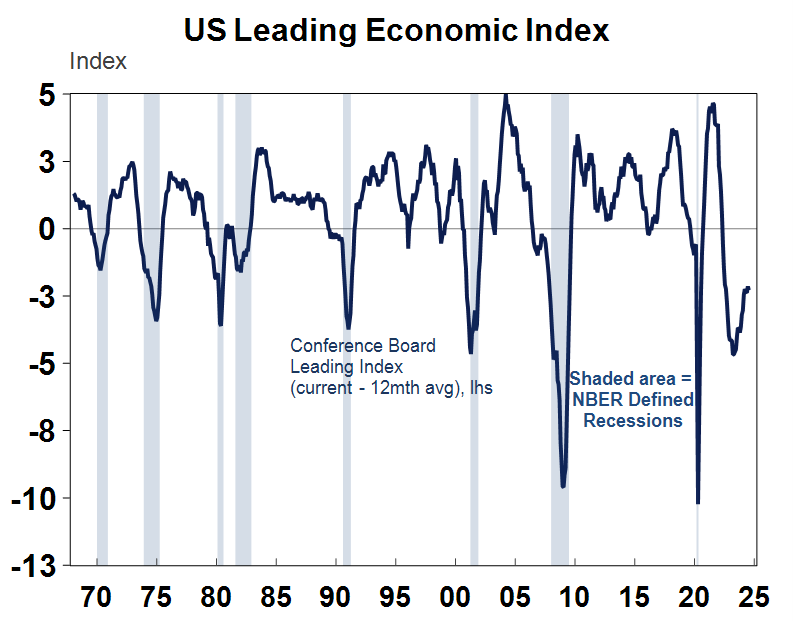
The US Conference Board leading index fell again in July, down by 0.6% and is lower compared to a year ago. Usually, when the Leading Index has been continually below its levels from a year ago has lined up with a US recession (see the chart below). But like other indicators like the yield curve, these “recession signals” have proven less relevant in the post-pandemic cycle.
Source: Macrobond, AMP
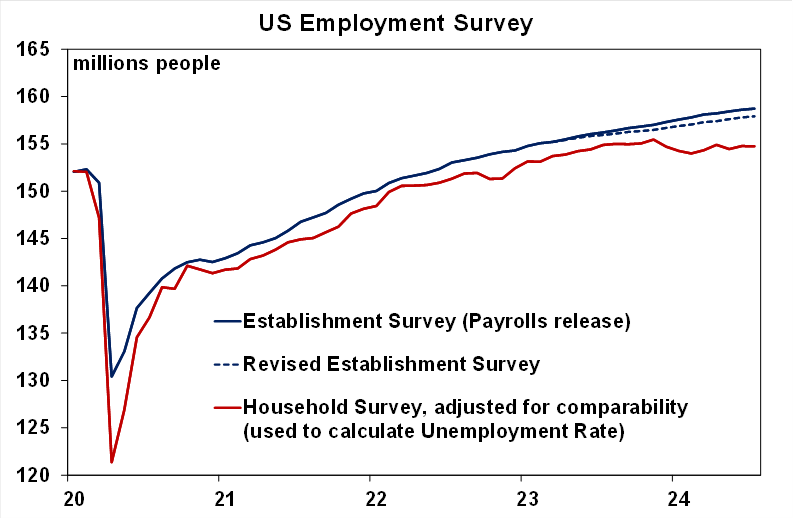
The annual benchmark revision to US payrolls generated some excitement before the event because of the recent concern about the US labour market (I don’t remember the last time that revisions to economic data generated so much interest). The US labour market data is derived from two different releases. Payrolls data uses the “Establishment Survey” which uses business data to assess jobs growth and the unemployment rate uses the “Household Survey” which uses demographic detail through a household survey. Employment growth in the two surveys has been diverging recently (see the chart below), with payrolls growth appearing stronger than employment in the household survey.
Source: Bloomberg, BLS, AMP
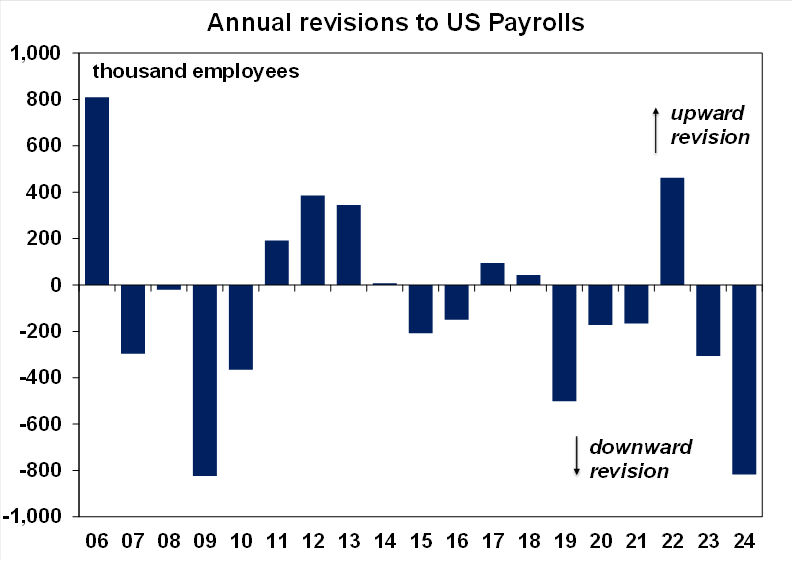
Payrolls were revised down by 818K over the 12 months to March 2024 which is the biggest downward revision since 2009 (see the chart below).
Source: Bloomberg, BLS, AMP
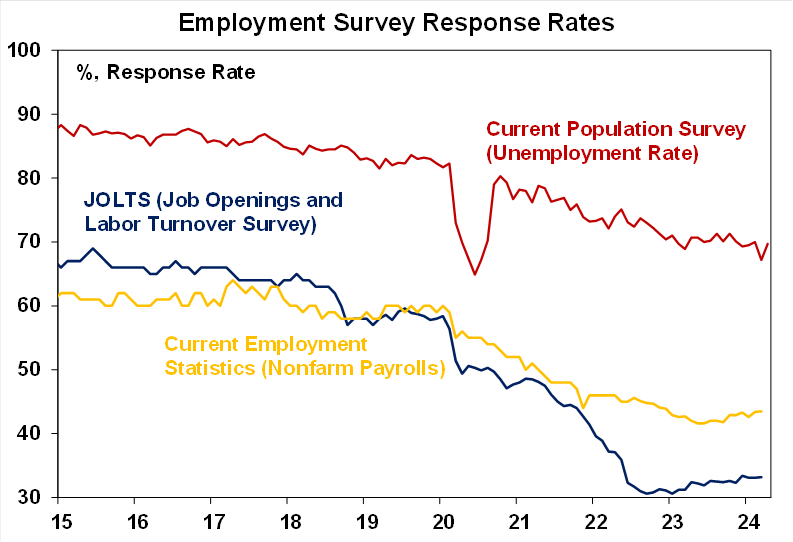
This revision brings the payrolls survey closer to the household survey. A large downward revision was expected given the divergence between the two surveys but is another confirmation that the US labour market has softened and also puts into question the accuracy of the jobs report (which was already in question as the proportion of respondents to the survey has been trending down while the responses to the unemployment rate or household survey remain high – see the chart below).
Source: BLS, AMP
But keep in mind that the unemployment rate is the best guide to the labour market. Employment growth is impacted by population changes. And the unemployment rate does not look any different after these revisions.
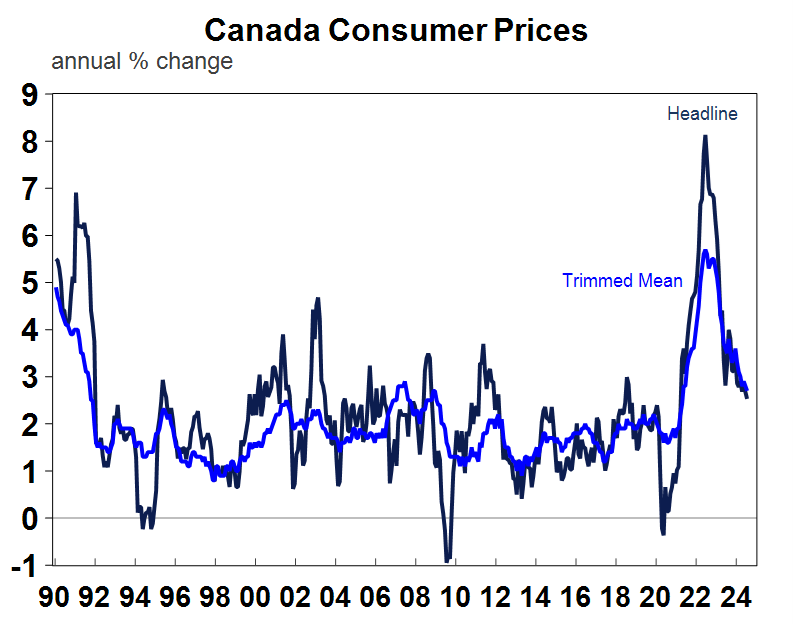
Canada’s July inflation data showed an increase of 0.4% over July and 2.5% over the year, as expected. Core inflation was a touch softer than expected, with the trimmed mean at 2.7% over the year to July (expectations were for 2.8%). The slowing in Canadian inflation should allow further rate cuts from the Bank of Canada, with the next one priced in by financial markets in September.
Source: Macrobond, AMP
Sweden’s Riksbank cut interest rates again this week for the second time in this cycle, taking the policy rate from 4.00% to 3.75% and guided the market towards more rate cuts later this year.
In the Eurozone, the ECB meeting minutes for July sent a strong signal that a cut in September was possible. Eurozone “negotiated” wage increases for the June quarter rose by 3.6% year on year, a drop from 4.7% in the March quarter and is a positive signal about a softer pace of inflation.
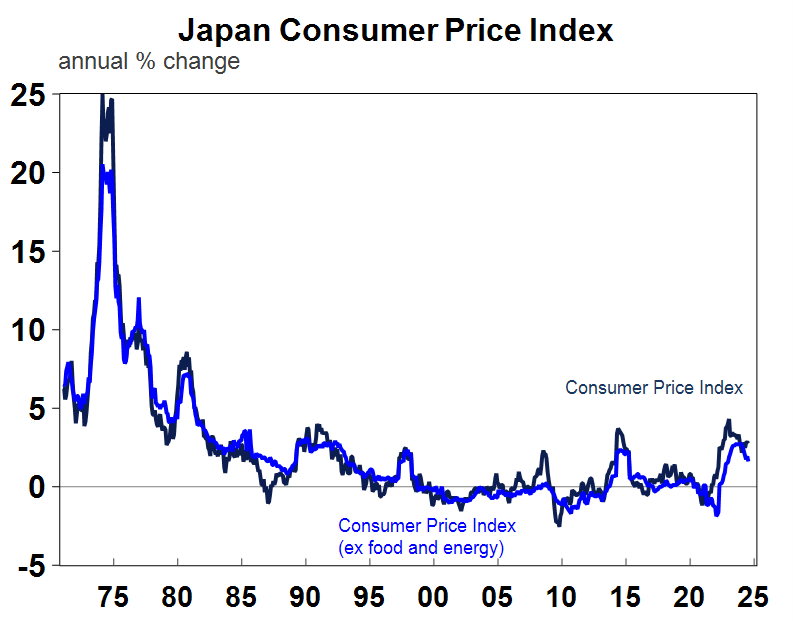
Japanese consumer prices rose in line with expectations. Headline inflation was up by 2.8% over the year to July (unchanged on last month) and core inflation (excluding food and energy) was up by 1.6% over the year, down from 1.9% last month. The inflation data is consistent with the Bank of Japan slowing lifting interest rates.
Source: Macrobond, AMP
Australian economic events and implications
It was unlikely that the RBA minutes for the August meeting would contain any new information given the plethora of RBA communication recently, from the post-meeting press conference, the Statement on Monetary Policy and numerous speeches and appearances from RBA officials. The minutes really just confirmed the RBA’s message– that the central bank is still concerned about inflation, that its forecasts suggest there is less spare capacity than previously expected and that while the central bank can’t rule anything in or out, the risk is still with higher rates in the near-term, rather than lower rates. The RBA is placing more emphasis on incoming data is rather than its forecasts, which are more subject to uncertainty. Despite this rhetoric, financial markets do not appear to believe the RBA’s hawkish tilt on rates and are still pricing in a rate cut before the end of the year and think that the cash rate will end 2025 at 3.5%.
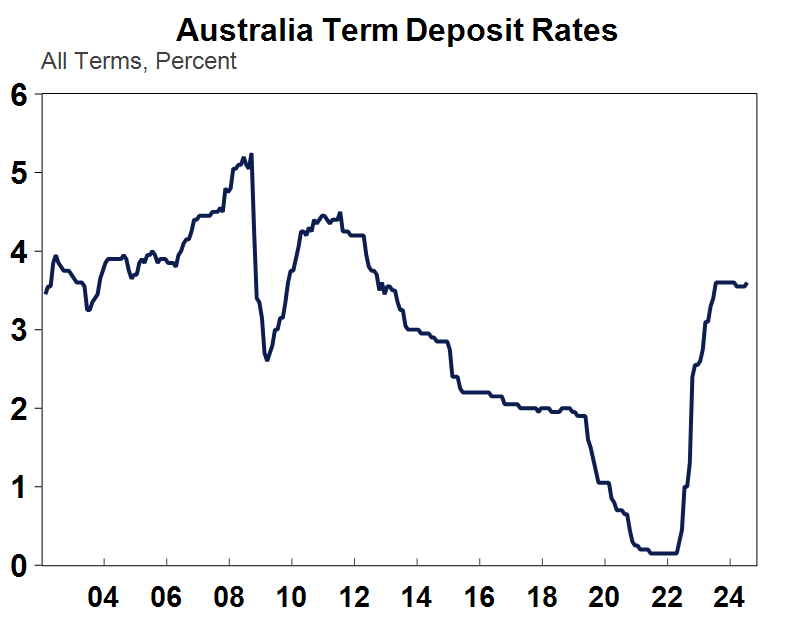
This week, some of the banks started cutting their deposit rates which reflects the market pricing for interest rates but is strange as the rate cutting cycle has not actually begun yet! Fixed mortgage rates are also priced off market expectations for interest rates and there were some reductions to fixed rates last year.
Source: Macrobond, RBA, AMP
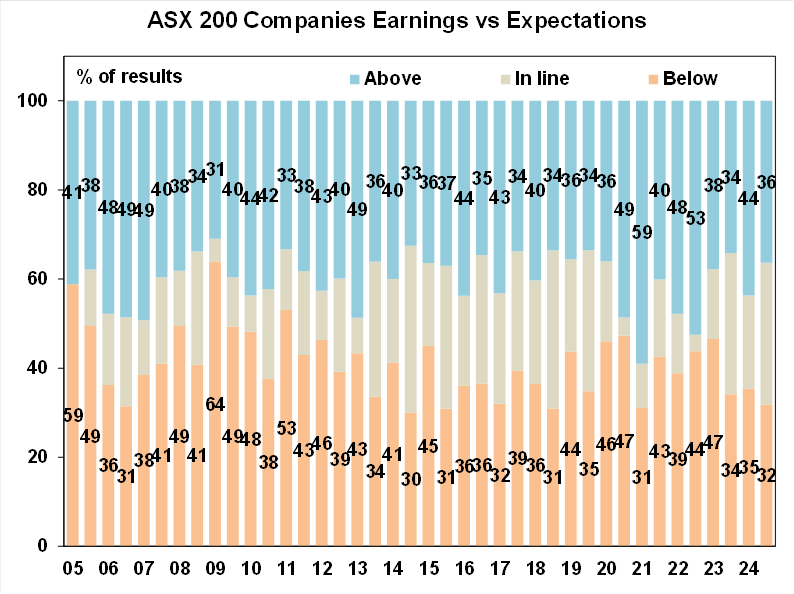
Around 65% of Australian ASX200 listed companies have reported June half-yearly earnings. The results have mostly been okay. 36% of results have beaten expectations, slightly below the usual 40% (results tend to beat expectations because companies downgrade analyst expectations before the results!). There have been less results disappointing expectations, with 32% of results below expectations from its average of 41% - see the chart below.
Source: Bloomberg, AMP
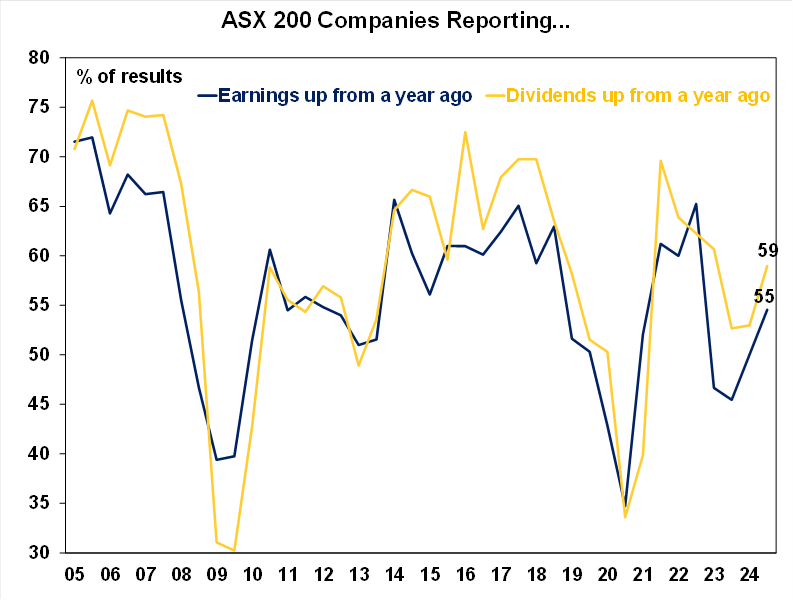
55% of companies are increasing earnings from a year ago, close to the 56% average. And 59% of companies are increasing dividends compared to a year ago, in line with the average.
Source: Bloomberg, AMP
Earnings growth has been negative for the last two financial years in Australia and expectations are for an improvement in 2024-25, with current projections for a 5.4% lift in earnings over the year. The big drag on earnings has been the energy sector due to lower oil, gas and coal prices, and smaller profits in mining, consumer staples, IT and financial sectors. The earnings results show that higher interest rates are working in the economy which has helped some like the banks to improve their net interest margins, although the banks are also seeing some rise in non-performing loans which are a risk that bad debts increase from here. Industrials look like a solid space, with high capex spending.
Australia’s Westpac Leading Index (which is a combination of various leading indicators of economic growth) fell further in July and is still negative compared to a year ago (see the chart below). The Australian Leading Index bounces around a lot more than the US index and even when it has been negative relative to a year ago, it hasn’t always been a sign of a recession. So, it is basically just telling us that economic growth will be soft in Australia in the near-term.
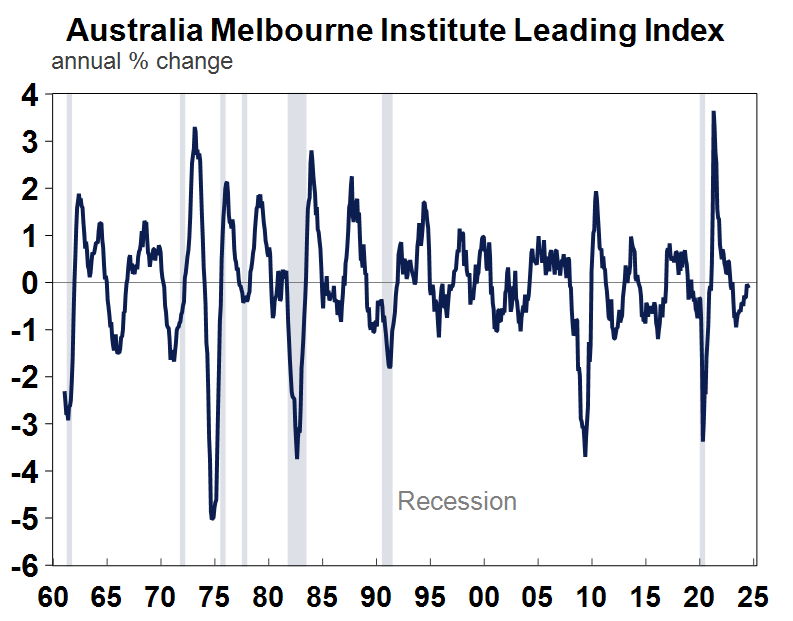
Source: Macrobond, AMP
What to watch over the next week?
In the US tech superstar Nvidia will report quarterly earnings on Thursday which will be key given the recent concern that tech stocks are looking overvalued and that forward sales projections are. Next week’s economic data includes July durable goods orders (expected to rebound after a fall last month), home price data (US home price growth is running around 7% over the past year), the August Conference Board consumer confidence index (expected to be basically unchanged on last month but is likely to show some deterioration over the near-term as the labour market weakens), regional Fed manufacturing indices are also released, the June quarter GDP data is released for its second revision and is expected to be unchanged at 2.8%, weekly initial and continuing jobless claims will be released along with personal income and spending which will give an update on consumer accumulated savings.
Australia reporting season is ongoing with announcements including Coles, Woolworths, Qantas and the miners next week to watch. In Australia, the monthly (July) consumer price index is released on Wednesday and we expect it show headline inflation of 3.3%, a step down from 3.8% last month as energy bill relief starts across the nation (and more in Qld). June quarter construction work done data is likely to rise by 1.2% (mostly from stronger engineering work) and June capital expenditure figures are likely to lift by 1.1%. There is also a forward-looking component around 2024-25 business spending. Capital expenditure is a key driver of the Australian economy now, so these numbers are important to watch. The construction and capex data are a component that go into the June quarter GDP release (released in the first week of September).
In Canada the monthly GDP data is released and is expected to show 0.1% growth over June or 1.8% year on year, mostly unchanged from last month.
In Japan, the Bank of Japan Governor Ueda will testify before parliament. Given the volatility in the Japanese share market, his remarks will be watched to see if he is likely to indicate that the BoJ is not behind the curve (in terms of raising rates) and whether the central bank can wait until markets completely stabilise before considering when to raise rates again. The BoJ will need to indicate that it still needs to raise rates eventually. The unemployment rate for July is also released (likely to remain low at around 2.5%), along with monthly activity indicators like retail sales and industrial production.
In the Eurozone, the key release is the August CPI data which should show headline and core inflation below 3% year on year, setting the scene for another ECB rate cut before the end of the year. The July unemployment rate is also out and is expected to remain around 6.5%.
Outlook for investment markets
Easing inflation pressures, central banks moving to cut rates and prospects for stronger growth in 2025-26 should make for reasonable investment returns over 2024-25. However, with a high risk of recession, poor valuations and significant geopolitical risks particularly around the US election, the next 12 months are likely to be more constrained and rougher compared to 2023-24 and there is a high risk of a further correction in the next few months.
A recession is the main threat for shares and there is a risk that we may have already seen the high for the year in the Australian share market after it reached our year-end target of 8100 in early August.
Bonds are likely to provide returns around running yield or a bit more, as inflation slows, and central banks cut rates.
Unlisted commercial property returns are likely to remain negative due to the lagged impact of high bond yields and working from home reducing office space demand.
Australian home prices are likely to see more constrained gains over the next 12 months as the supply shortfall remains, but still high interest rates constrain demand and unemployment rises. The delay in rate cuts and talk of rate hikes risks renewed falls in property prices as its likely to cause buyers to hold back and distressed listings to rise.
Cash and bank deposits are expected to provide returns of over 4%, reflecting the back up in interest rates.
A rising trend in the $A is likely taking it to $US0.70 over the next 12 months, due to a fall in the overvalued $US and a narrowing in the interest rate differential between the Fed and the RBA. A recession is the main downside risk.

Oliver's insights - Trump challenges and constraints
19 November 2024 | Blog Why investors should expect a somewhat rougher ride, but it may not be as bad as feared with Donald Trump's US election victory. Read more
Econosights - strong employment against weak GDP growth
18 November 2024 | Blog The persistent strength in the Australian labour market has occurred against a backdrop of poor GDP growth, which is unusual. We go through this issue in this edition of Econosights. Read more
Weekly market update 15-11-2024
15 November 2024 | Blog Global share markets were messy over the last week, not helped by the ongoing rise in bond yields and a wind back in Fed rate cut expectations after some elevated US inflation data and slightly hawkish comments from Fed chair Powell. Read moreWhat you need to know
While every care has been taken in the preparation of this article, neither National Mutual Funds Management Ltd (ABN 32 006 787 720, AFSL 234652) (NMFM), AMP Limited ABN 49 079 354 519 nor any other member of the AMP Group (AMP) makes any representations or warranties as to the accuracy or completeness of any statement in it including, without limitation, any forecasts. Past performance is not a reliable indicator of future performance. This document has been prepared for the purpose of providing general information, without taking account of any particular investor’s objectives, financial situation or needs. An investor should, before making any investment decisions, consider the appropriateness of the information in this document, and seek professional advice, having regard to the investor’s objectives, financial situation and needs. This article is solely for the use of the party to whom it is provided and must not be provided to any other person or entity without the express written consent AMP. This article is not intended for distribution or use in any jurisdiction where it would be contrary to applicable laws, regulations or directives and does not constitute a recommendation, offer, solicitation or invitation to invest.
The information on this page was current on the date the page was published. For up-to-date information, we refer you to the relevant product disclosure statement, target market determination and product updates available at amp.com.au.