


Investment markets and key developments
Sharemarkets continued to rally this week, with the US and Australia at new records again, propelled by the US Federal Reserve’s 50 basis point cut to interest rates (the first for this cycle) and solid US economic data indicating that the economy is holding up. Shares rose despite the escalating tensions in the Middle East and poor seasonality that usually occurs in September for equity markets. US shares were up 1.4%, Australia 1.4%, Eurozone 0.6%, Japan 3.1% and China 1.3%. The US dollar has fallen, with the $A above 68 US cents for the first time since January. US bond yields have been mixed, the 2-year is down slightly but the 10-year is up to 3.7%.
Israeli attacks in Lebanon that targeted the militant group Hezbollah but which also killed and injured civilians and was followed by air strikes on Hezbollah targets is another escalation in the conflict and is likely to get worse as Iran retaliate. Oil prices didn’t rise significantly on the news, Brent is close to $75USD/Barrel, after falling to a low of $69 recently.
There was another assassination attempt on Trump. This time, his odds of winning the election did not increase after the attack, with the post-debate momentum for Harris ongoing and its looking more likely that the Democrats will win the election (although a divided government is still likely as the Republicans are expected to win the Senate and the Democrats will have the House of Representatives and White House).

Source: Macrobond, RealClearPolitics, AMP
Sharemarkets are defying the usual September seasonal weakness. We remain of the view that shares are at high risk of further falls in the short-term because valuations are high, seasonality is a problem in September, there could be more downside for tech names like Nvidia, economic data could start moving into “concerning” territory as activity has slowed which will increase fears of recession and geopolitical risks like the US election and the issues in the Middle East could see investor uneasiness. But, over a medium-term view we are still optimistic on the outlook for shares because inflation is slowing, central banks are cutting rates, earnings growth looks reasonable and economic growth is holding up for now.
Major global economic events and implications
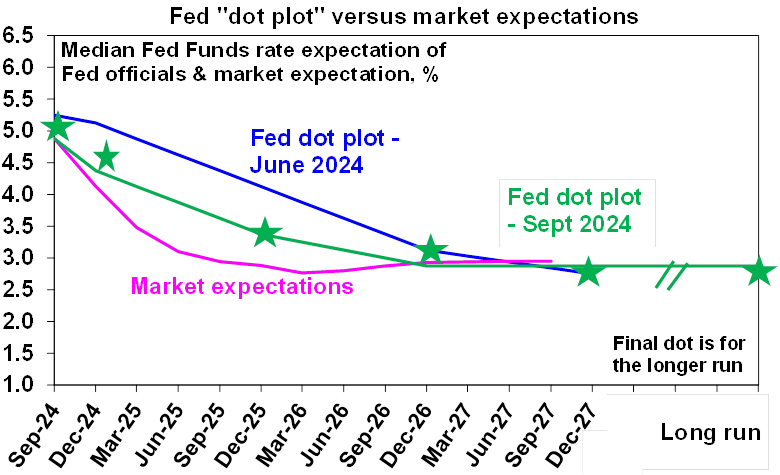
The US Federal Reserve has started the easing cycle with a 50 basis point cut, taking the Fed Funds rate to 4.75-5% (from 5.25-5.5%), which was above economist expectations for a 25 basis point cut but in line with market pricing, which had moved over the past week to be close to fully priced for a 50 basis point cut. Fed Chair Powell was careful to emphasise that this was not an emergency rate cut, that the Fed was not behind the curve and that 50 basis point cuts at every meeting are not going to be the norm. Rather, the cut was done as a “recalibration” of policy to more neutral settings, and reflects that the balance of risks between the Fed’s dual mandate of low inflation and full employment has now become more equal (with lower inflation risks but more downside risks in the labour market).
The Fed’s revised growth, inflation and interest rate projections show mostly unchanged growth forecasts (with US GDP at ~2% for 2024 and the out-years), a higher unemployment rate (ending 2024 at 4.4% from 4% in the June estimates), lower headline PCE (personal consumption expenditure) inflation (ending 2024 at 2.3% from 2.6% in the last estimate) and lower core PCE inflation at 2.6% at the end of 2024 from 2.8%. Member’s expectations for interest rates (otherwise known as the “dot plots”) showed a lower profile for interest rates (see the chart below), with two 25 basis point rate cuts before the end of the year and a 25 basis point rate cut in each quarter of 2025. Market pricing is looking for ~75 basis points of rate cuts before the end of 2024.
Source: Bloomberg, AMP
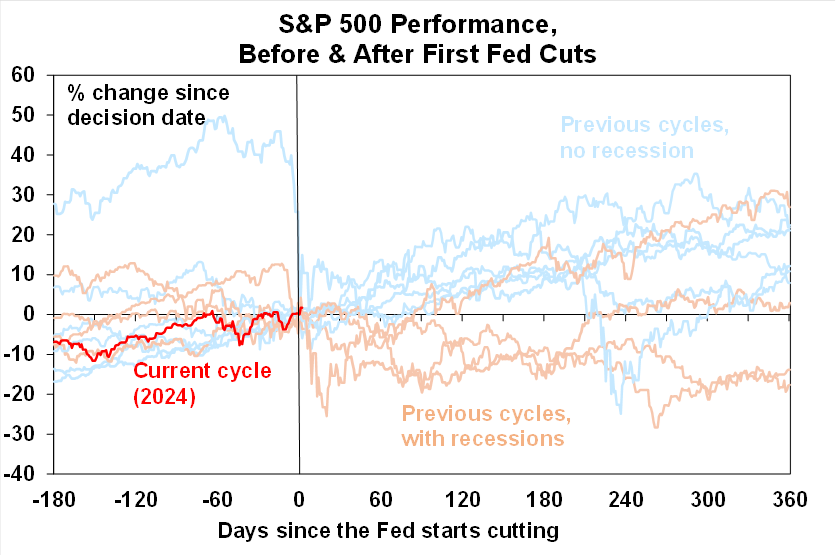
The impact on US equities after the start of Fed rate cuts depends on the economic cycle. Periods associated with a recession usually see share market lower in the months (and year) after Fed rate cuts (see the chart below) but cycles with no recession actually see shares moving higher after the Fed starts cutting.
Source: Bloomberg, AMP
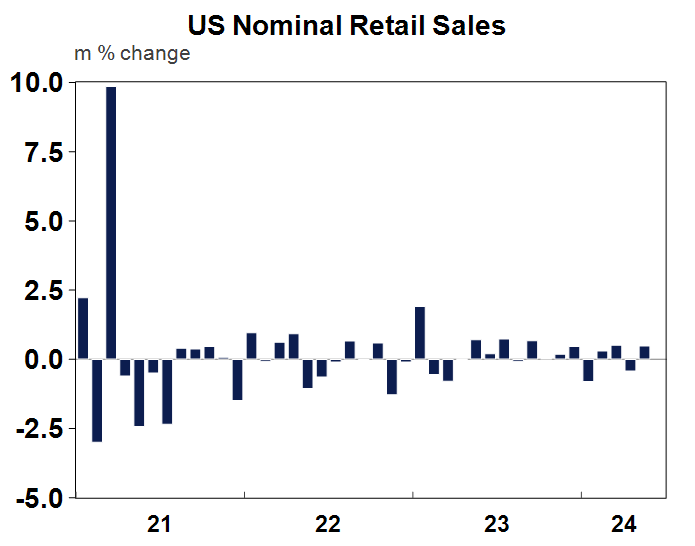
US economic data this week was strong. US August retail sales rose by 0.1% month on month, beating expectations of a small contraction but the categories within the headline show softer growth across components and by month-by-month changes in retail spending have been mixed in recent times (see the chart below). Annual growth in nominal retail sales is up by 2.1%.
Source: Macrobond, AMP
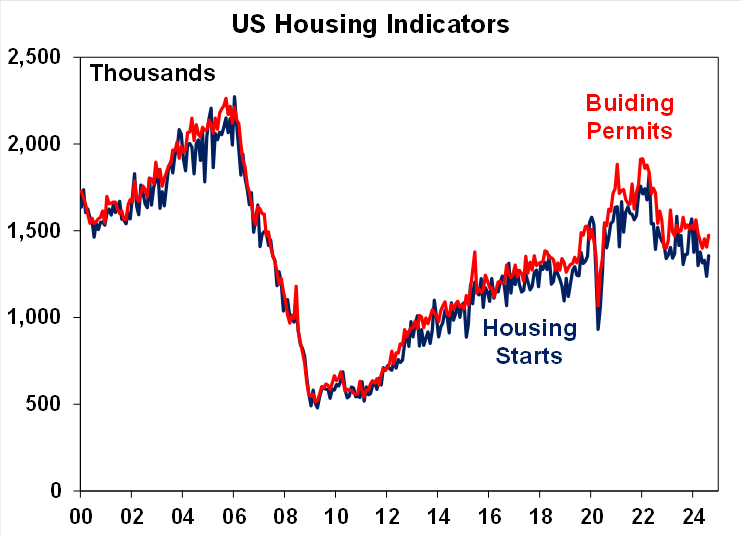
US August housing starts and building permits rose more than expected and have been stabilising in recent months (see the chart below) which is good news for residential construction.
Source: Bloomberg, AMP
US August industrial production rose by 0.8% over the month, above expectations for 0.2%. The stronger-than-expected monthly data boosted the Atlanta Fed GDPNow measure is 3% (annualised) for the September quarter, which follows GDP growth of 3% in the second quarter – another sign of a soft (rather than hard) landing.
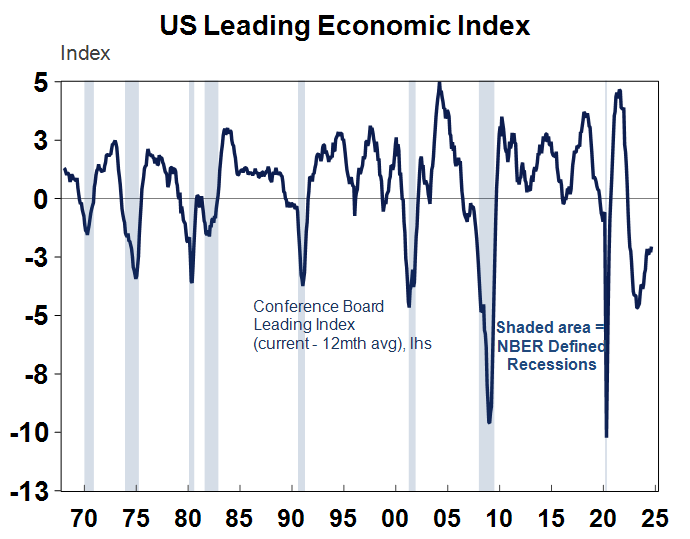
The US leading index fell by 0.2% in August, slightly better than expected but still remains below its year-ago levels which has historically been a sign of a downturn (see the chart below).
Source: Macrobond, AMP
And US weekly initial and jobless claims fell, in an encouraging sign that the US labour market is holding up.
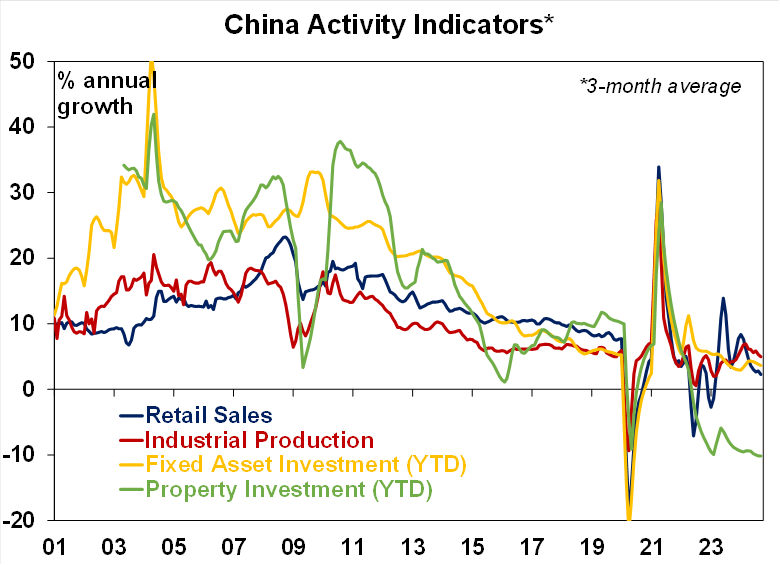
Chinese activity data for August was broadly disappointing. It showed that industrial production was 4.5% higher over the year to August, retail sales rose by 2.1% over the year, fixed asset investment was up by 3.4%, property investment was down 10.2% over the year to August, compared to a year ago and property sales were still down massively (by 25%) over the year over the past 8 months. Many are estimating that this means that the pace of Chinese GDP growth is around 4% year on year, not the 5% targeted by the government.
Source: Bloomberg, AMP
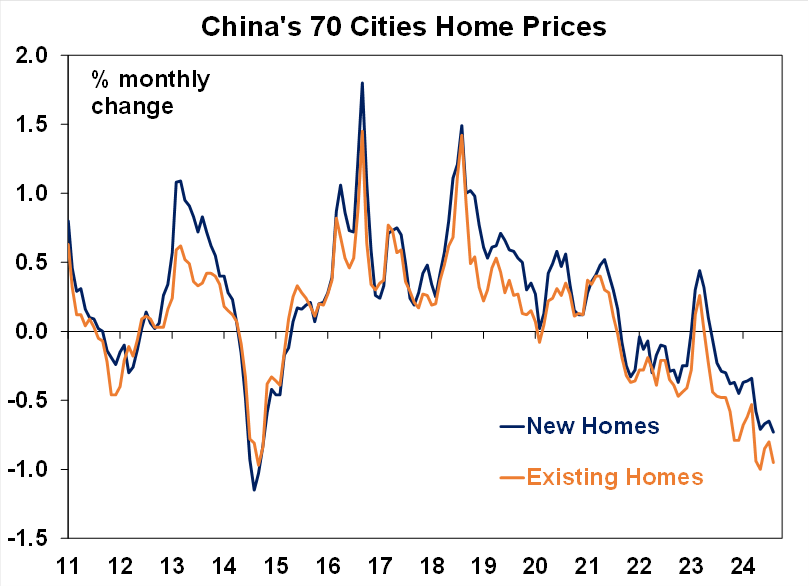
Chinese home prices fell again in August, by 0.7% for new home and 1% for existing. Home prices have declined consecutively for the past 15 months for new homes and 16 months for existing homes.
Source: Bloomberg, AMP
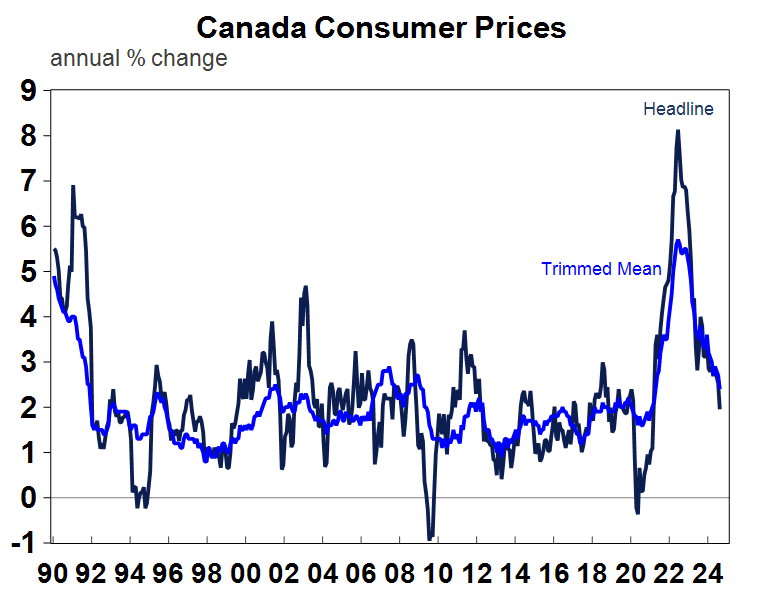
The Canadian consumer price index showed headline annual growth of 2% to August, down from 2.5% last month and just below expectations and the lowest rate since early 2021. Core inflation was up by 2.3% on the median measure and 2.4% on the trimmed mean measure. The softening inflation backdrop in Canada alongside a weakening growth backdrop, argues for more rate cuts from the Bank of Canada, with the market pricing in around 3 rate cuts before the end of the year which looks reasonable.
Source: Macrobond, AMP
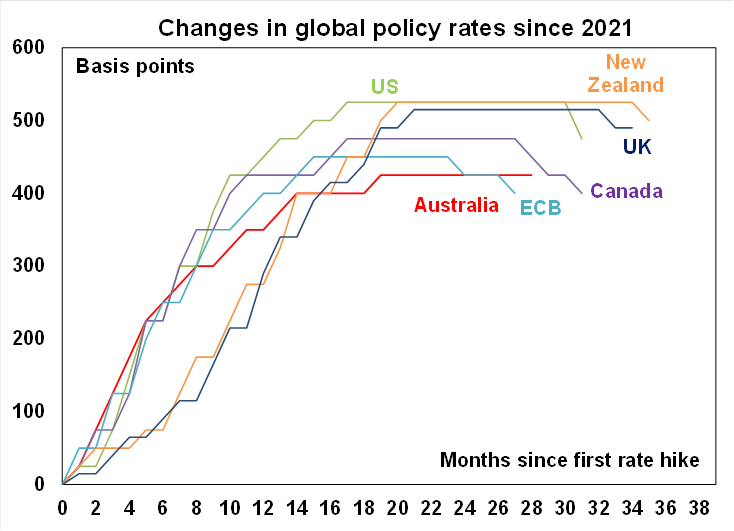
The Bank of England kept interest rates unchanged at 5% (with 8 Board members voting for no change and 1 voting for a 25 basis point cut), after a rate cut in August which makes sense as UK services inflation is too high.
Source: Bloomberg, AMP
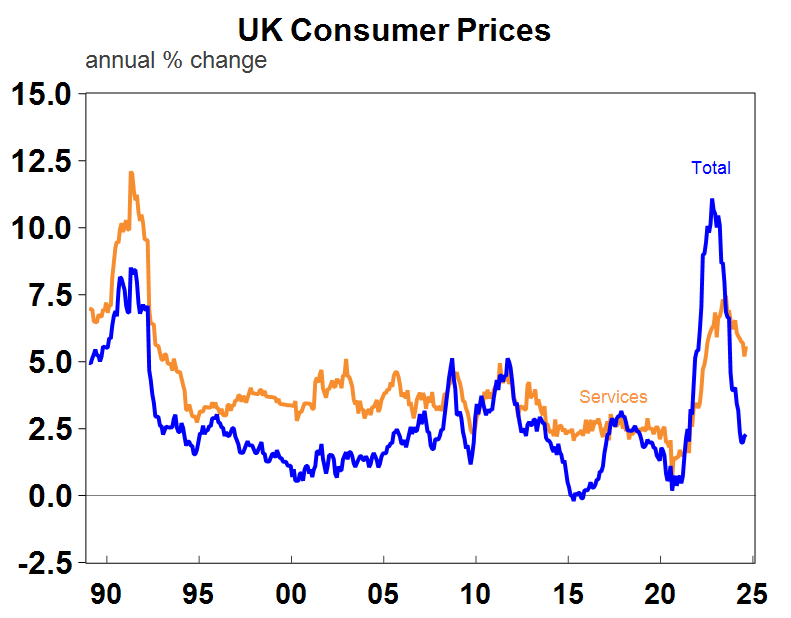
UK August inflation data was in line with expectations. Headline consumer prices were up by 2.2% over the year (unchanged on last month), core inflation rose by 3.6% over the year (up from 3.3% last month) and services inflation remains high (up by 5.6% over the year).
Source: Macrobond, AMP
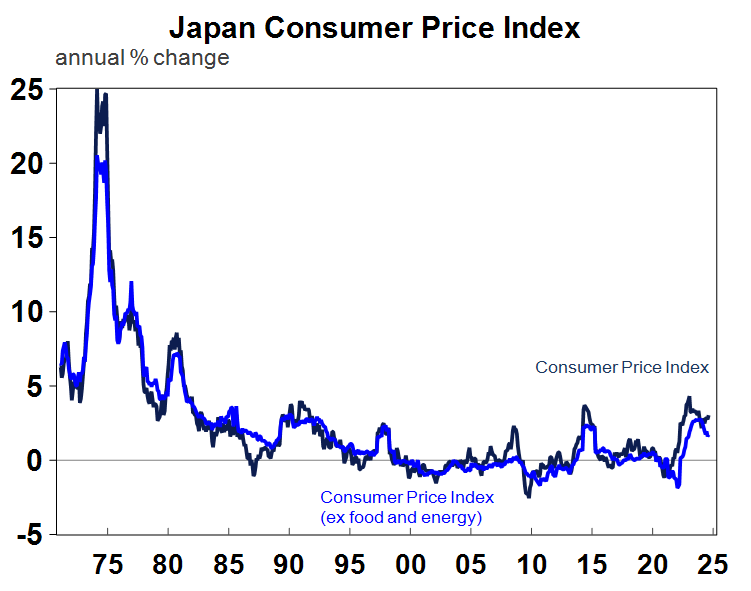
Japanese August inflation data showed headline inflation up by 3% over the year, with core (excluding food and energy) up by 1.7%, both in line with expectations. But not high enough to worry the Bank of Japan who also met this week and kept interest rate unchanged at 0.25%, after a rate increase in July. Further interest rate rises are likely in coming months, although inflation is still contained which argues for a slow increase to rates, especially with the volatility in the Yen. Bank of Japan Governor Ueda said that “the upside risk to prices does appear to be easing given the recent yen strength” which has caused markets to push back expectations from a rate hike in October later to December or January.
Source: Macrobond, AMP
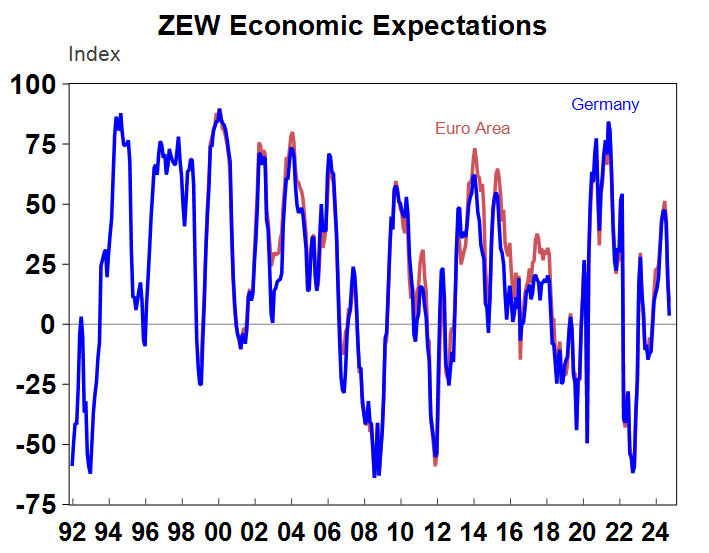
The Eurozone ZEW index of investor confidence fell further in September, and deteriorated significantly for Germany (see the chart below), with the current economic sentiment index falling from an index of 19.2 to 3.6 in September.
Source: Macrobond, AMP
New Zealand June quarter GDP fell by 0.2%, which was better than the 0.4% decline expected by markets. Annual growth in New Zealand is down by 0.5% - see the chart below. Growth in the New Zealand economy has stalled. In the June quarter, household consumption held up, government spending was solid but business investment was weak.
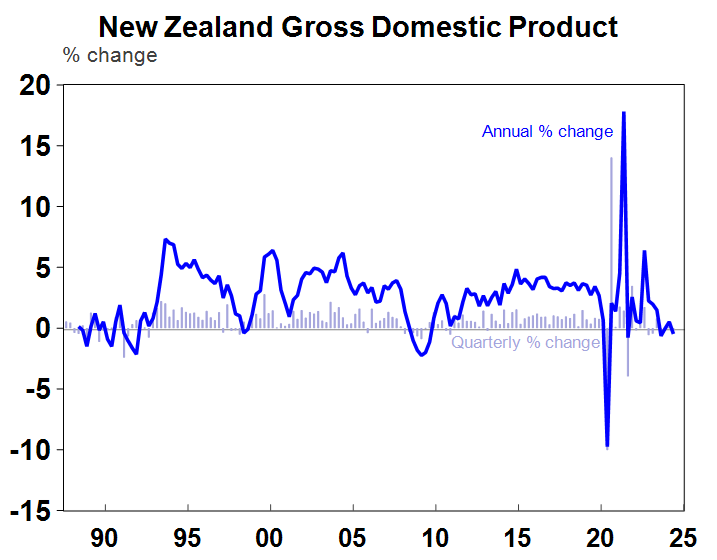
Source: Macrobond, AMP
Australian economic events and implications
The Westpac Melbourne Institute leading index fell again in August and has declined relative to its level a year ago (although has been improving from more negative levels recently). The Leading Index is still below levels that would usually be associated with a recession (see the chart below).
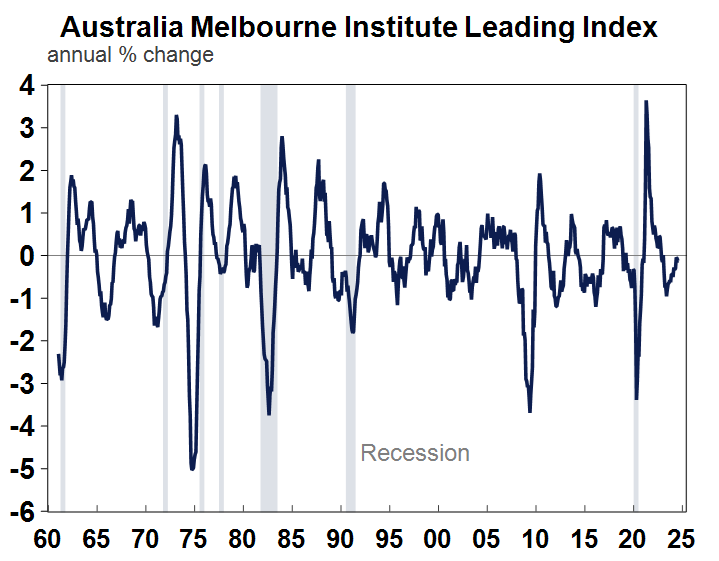
Source: Macrobond, AMP
The Australian labour force figures for August were solid. Jobs growth was up by 47.5K, above expectations. The unemployment rate was flat at 4.2% and the participation rate remained at a record high of 67.1%. The strength in the labour market reaffirms the RBA’s view that the labour market is holding up well and that demand for labour is still exceeding supply of labour. But, the weakening in jobs leading indicators lines up with a slowing in hours worked which indicates that the next leg in the labour market slowing may be in employment. We expect the unemployment rate to rise to 4.5% by the end of the year.
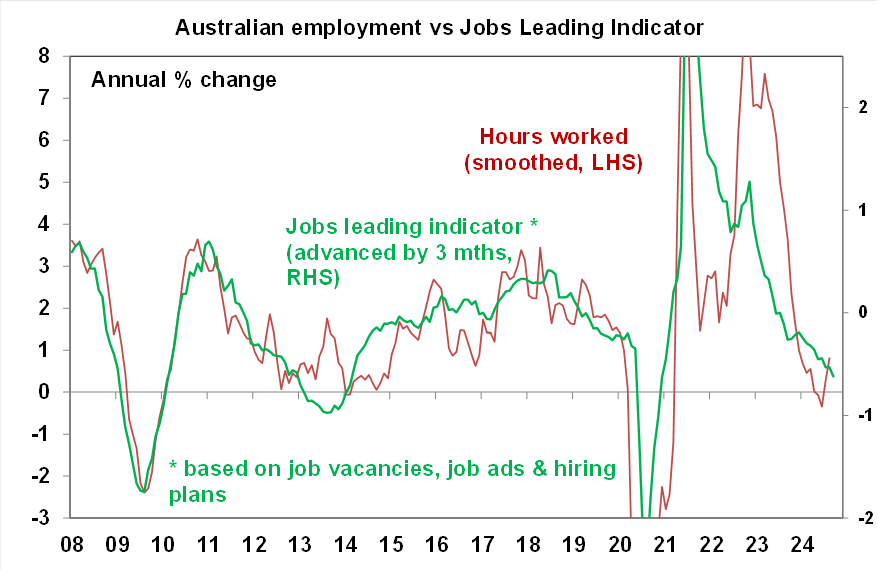
Source: ABS, Bloomberg, AMP
Australia’s population data showed a slowing in the rate of population growth, up by 2.3% over the year to March, down from 2.5% last quarter. Net migration increased by 510K over the year, natural increase was up by 105K, which is still very elevated but not unexpected as the arrivals data was suggesting that population growth was around this pace in early 2024.
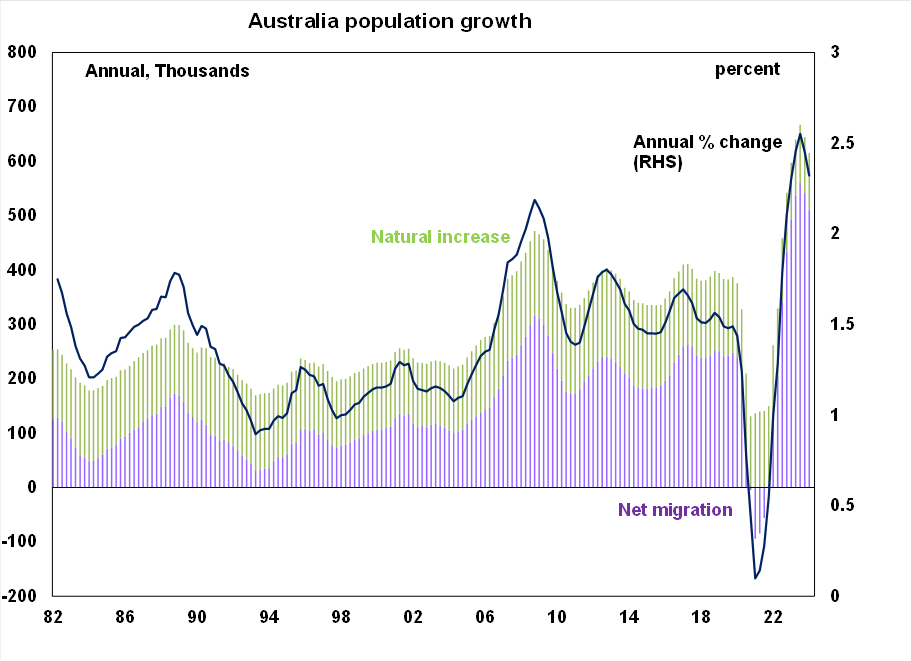
Source: ABS, AMP
What to watch over the next week?
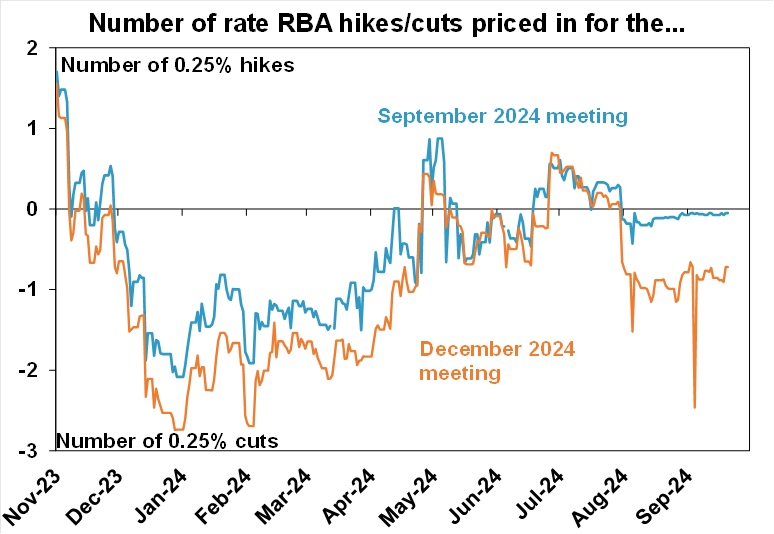
The Reserve Bank of Australia meet on Tuesday and is expected to keep the cash rate at 4.35% by financial markets and economists. Economic data since the last meeting in early August has shown wages growth slowing, job growth remaining solid, the unemployment rate tracking at 4.2%, weak economic growth in the second quarter, inflation moderating as expected and poor readings of consumer and business confidence. This backdrop is basically in line with the central bank’s forecasts for the economy and doesn’t argue the need for an imminent rate cut. The RBA has been pushing back on expectations for rate cuts. Markets are pricing in a full rate cut before the end of the year (see the chart below) which seems to be driven by interest rates in the US.
Source: Bloomberg, AMP
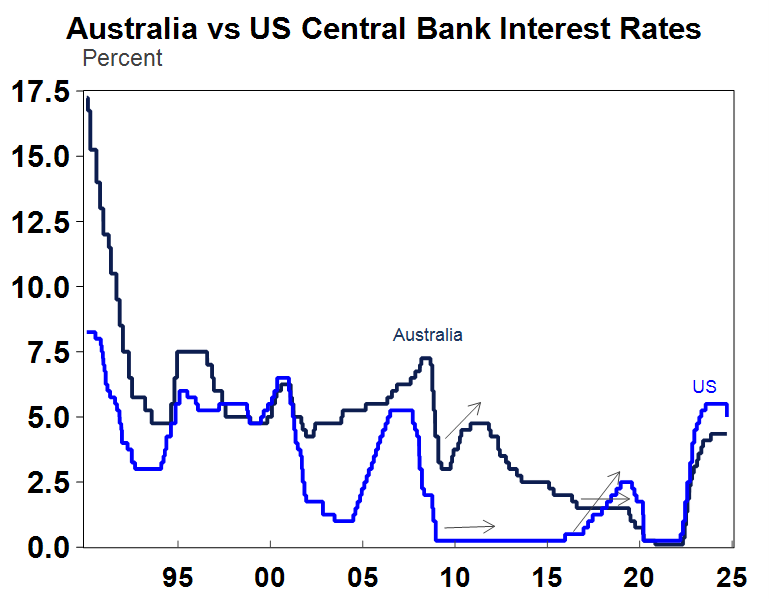
But, the RBA does not have to follow the US Fed. There have been periods of time when the central banks were moving in opposite directions (see the chart below) like after the GFC when the RBA was hiking and the Fed was holding rates steady or in 2015 when the Fed was hiking and the RBA was on hold. Each central bank has to set policy for its domestic settings. We see the RBA starting rate cuts in February 2025, when the inflation data has slowed more which will give the RBA confidence to ease monetary policy.
Source: Macrobond, AMP
The Australian August monthly consumer price index is released on Wednesday. We are looking for annual growth of 2.7% for the headline index (after 3.5% last month) with a big fall in electricity prices weighing on inflation because of the state and federal governments energy bill rebates, a fall in QLD transport fares, an increase in alcohol excise rates, lower petrol prices, a lift in food, lower clothing and footwear prices, an increase in rents, recreation and culture flat and insurance and finance up. Don’t forget that the monthly inflation data is not a full read of consumer prices because not everything is surveyed every month. The trimmed mean, which is not impacted by rebates, is likely to remain around 3.7% over the year to August.
August job vacancies should show a further slowing in the number of jobs advertised.
The RBA Financial Stability Review is also released which will update the RBA’s analysis on household and corporate financial health. I always look at the components that detail how households with mortgages have adjusted spending and how they are keeping up with higher interest rates.
Global PMI’s for September are released next week and are a great guide to manufacturing and services conditions.
In the US, we get the Conference Board consumer confidence, home sales, durable goods orders and the August personal consumption expenditure deflators (expected to be up by 0.1% over August or 2.3% year on year) with the core deflator up by 2.7% over the year.
Outlook for investment markets
Easing inflation pressures, central banks moving to cut rates and prospects for stronger growth in 2025-26 should make for reasonable investment returns over 2024-25. However, with a high risk of recession, poor valuations and significant geopolitical risks particularly around the US election, the next 12 months are likely to be more constrained and rougher compared to 2023-24 and there is a high risk of a further correction in the next few months. A recession is the main threat for shares and there is a risk that we may have already seen the high for the year in the Australian share market after it reached our year-end target of 8100 in early August.
Bonds are likely to provide returns around running yield or a bit more, as inflation slows, and central banks cut rates.
Unlisted commercial property returns are likely to remain negative due to the lagged impact of high bond yields and working from home reducing office space demand.
Australian home prices are likely to see more constrained gains over the next 12 months as the supply shortfall remains, but still high interest rates constrain demand and unemployment rises. The delay in rate cuts and talk of rate hikes risks renewed falls in property prices as its likely to cause buyers to hold back and distressed listings to rise.
Cash and bank deposits are expected to provide returns of over 4%, reflecting the back up in interest rates.
A rising trend in the $A is likely taking it to $US0.70 over the next 12 months, due to a fall in the overvalued $US and a narrowing in the interest rate differential between the Fed and the RBA. A recession is the main downside risk.

Econosights - indicators of consumer mortgage stress
23 September 2024 | Blog Despite Australian households’ vulnerability to rising interest rates because of high household debt and borrowing through variable and/or short-term fixed mortgage rates, households have managed to deal with higher mortgage repayments without a broad-based increase in debt servicing problems (for now at least). We look at this issue in this Econosights. Read more
Aussie jobs market still very resilient
19 September 2024 | Blog Employment growth in Australia surprised to the upside for the 5th consecutive month, rising by 47.5k over the month of August – almost double the 26k figure predicted by economists. The Read more
Weekly market update 13-09-2024
13 September 2024 | Blog US debate leaves Harris "victorious" (for now), US inflation data leaves Fed on track to cut next week, Aust Govt vs RBA tensions continue. Read moreWhat you need to know
While every care has been taken in the preparation of this article, neither National Mutual Funds Management Ltd (ABN 32 006 787 720, AFSL 234652) (NMFM), AMP Limited ABN 49 079 354 519 nor any other member of the AMP Group (AMP) makes any representations or warranties as to the accuracy or completeness of any statement in it including, without limitation, any forecasts. Past performance is not a reliable indicator of future performance. This document has been prepared for the purpose of providing general information, without taking account of any particular investor’s objectives, financial situation or needs. An investor should, before making any investment decisions, consider the appropriateness of the information in this document, and seek professional advice, having regard to the investor’s objectives, financial situation and needs. This article is solely for the use of the party to whom it is provided and must not be provided to any other person or entity without the express written consent AMP. This article is not intended for distribution or use in any jurisdiction where it would be contrary to applicable laws, regulations or directives and does not constitute a recommendation, offer, solicitation or invitation to invest.
The information on this page was current on the date the page was published. For up-to-date information, we refer you to the relevant product disclosure statement, target market determination and product updates available at amp.com.au.