

Investment markets and key developments
Better news on inflation and signs of a “good” moderation in US economic growth (rather than signs of a sharp slowdown) led to a repricing for slightly earlier Fed rate cuts, a fall in US bond yields, a lower US dollar (and a slightly higher Aussie dollar just under 67 US cents) and higher US equities (up by 1.5% this week). US shares have retracted all of the fall into April and are back up to around record highs. Australian shares rose by 0.8% this week, following the US lead and on expectations of sooner-than-expected RBA rate cuts following softer wages data and an increase in the unemployment rate, despite some concerns that the Labor government’s 2024-25 Federal Budget would be inflationary. Eurozone shares fell by 0.4%, Japanese shares rose by 1.5% and Chinese equities rose by 0.3% as rumours that there would be some Chinese policy support for the purchase of unsold homes from distressed builders which would clear some excess housing inventory boosted Chinese real estate stocks. In the commodities world, energy and metals prices have been rising in recent weeks and the oil price is over $80/barrel.
The Biden administration announced tariff hikes (which were already flagged) on some Chinese imports including electric vehicles, batteries, solar cells, chips, ship-to-shore cranes and certain types of steel, aluminium, critical minerals and medical supplies. The total value of products are worth around USD18bn which is only 4.2% of total US imports and less than 1% of total Chinese exports – it’s not large in the scheme of things. But, the headline tariff hikes look extreme, for example the tax on electric vehicles went from 25% to 100%. These hikes will start from 2025 or 2026 and cause higher consumer prices for US consumers but are ultimately just part of the broader hawkish US sentiment on China and this could get worse if Trump is re-elected in November (as he is proposing tariffs on all Chinese imports). There is also a risk that other Western countries, especially in Europe (who have been conducting investigations into Chinese subsidies for EV’s, solar and wind sectors and China’s procurement of medical devices) follow suit on placing tariffs on some Chinese imports. But, this round of tariff hikes is unlikely to send the same negative shockwaves through markets as the Trump tariffs in 2018 because 1) markets were anticipating this news 2) markets have become used to trade wars in recent years, 3) the tariffs are on a small share of US imports from China and 4) the Trump tariffs were not as disastrous for the US or Chinese economy as initially feared so there is less concern about these new tariffs.
Major global economic events and implications
US consumer price data for April showed a slowing in inflation, after 3 prior consecutive elevated prints. Headline and core inflation rose by 0.3% over the month (consensus was looking for +0.4% headline price growth) which took annual growth to 3.4% and 3.6% for core inflation. Another price indicator this week, the April producer price index was a bit hotter, rising by 0.5% over the month, taking annual growth to 2.2% (and 2.4% for core).
Back to the detail of the April CPI data, the contributions showed further goods deflation (due to falls in used car prices and household and furnishings while clothing and medical goods went up), a positive contribution from energy and food inflation and still elevated services inflation (see chart below).
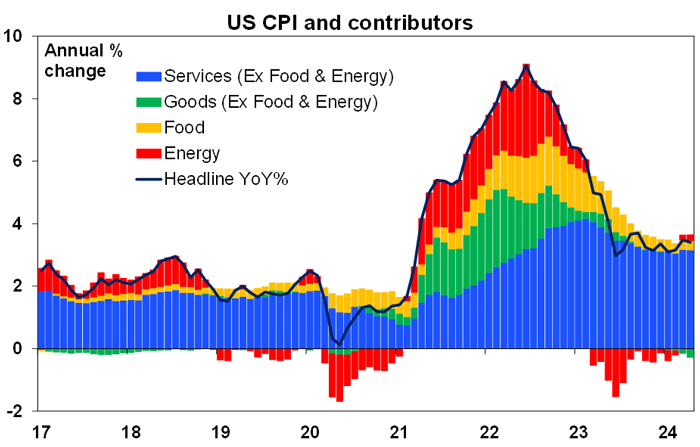
Source: Bloomberg, AMP
The Fed’s recently preferred “supercore” inflation measure (core services excluding shelter) rose by 0.5% over the month, down from last month but still too high. Shelter inflation also remains elevated, although rent inflation is slowing gradually. The inflation data is consistent with inflation continuing to moderate, but at a slow pace which argues for the Fed to keep rates on hold for now.
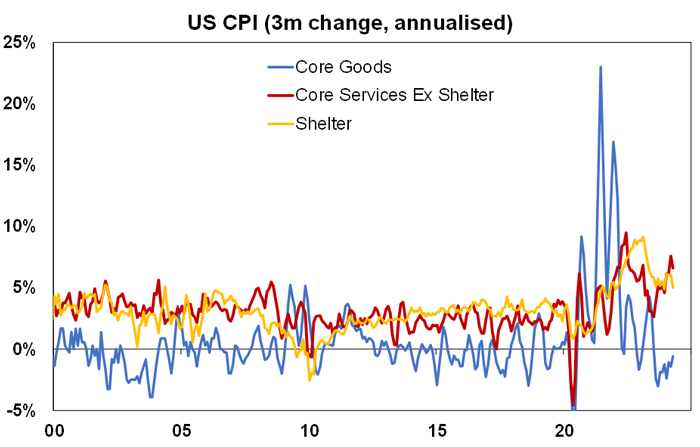
Source: Bloomberg, AMP
The US Conference Board leading economic index (a proxy for forward-looking activity) fell by 0.6% over April, lower than expected. This has been a hard indicator to read. It has been in “recession-like” territory for a while (see the chart below which looks at current conditions relative to the 12 month average) but more recently has started to improve.
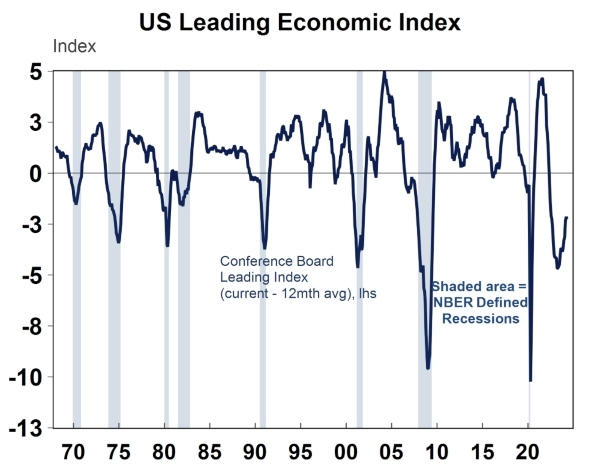
Source: Macrobond, AMP
US retail sales data was flat over April, lower than expected and the pace of retail spending has slowed in recent months (see the chart below).
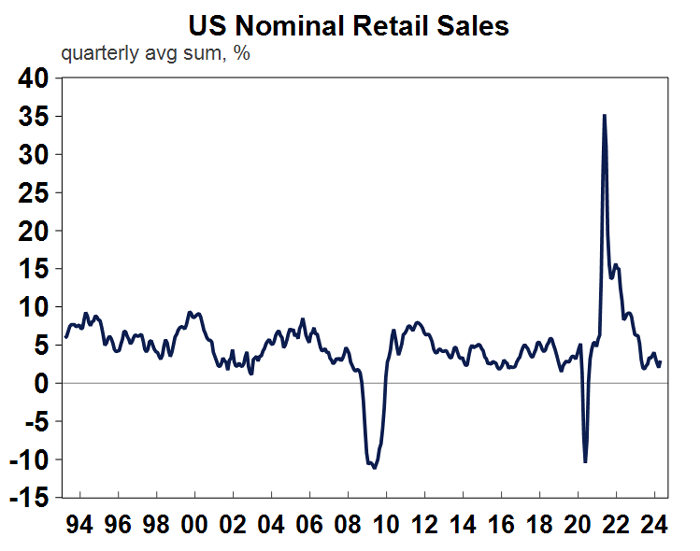
Source: Macrobond, AMP
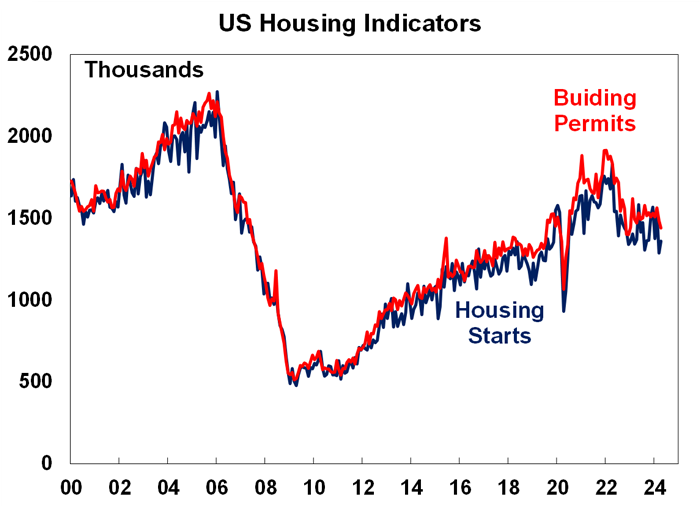
US NFIB small business optimism increased in April and housing indicators weakened with lower-than-expected housing starts and building permits (see the chart below). Initial jobless claims moderated after a jump up last week which indicated that last week’s spike was impacted by the New York school springs break rather than a significant deterioration in the labour force.
Source: Bloomberg, AMP
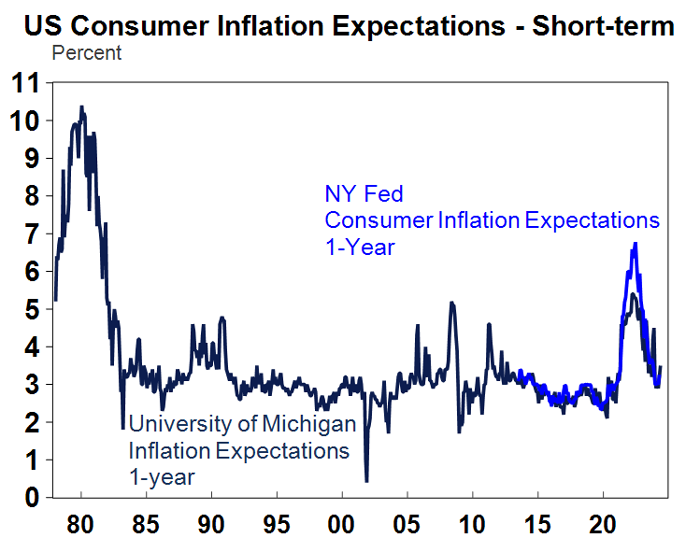
Fed Chair Powell spoke this week and mostly stuck to the tone of the post-FOMC May meeting, urging that more patience was needed to reduce inflation. Other Fed speakers had a similar tone this week, sticking to the “higher for longer” mantra. Kashkari questioned how much interest rates were restraining the US economy and Mester acknowledged that short-term inflation expectations had gone up. The New York Fed released its one-year inflation expectations survey which showed that 1-year inflection expectations rose to 3.3% in April (up from 3% in the previous month), the highest reading since November, similar to the signal from the University of Michigan survey. See the next chart.
Source: Macrobond, AMP
Over 93% of US S&P 500 companies have reported March quarter earnings with nearly 80% of companies beating expectations, against a norm of 76%. Earnings growth expectations are at 10% year on year, up from 4.1% 4 weeks ago.
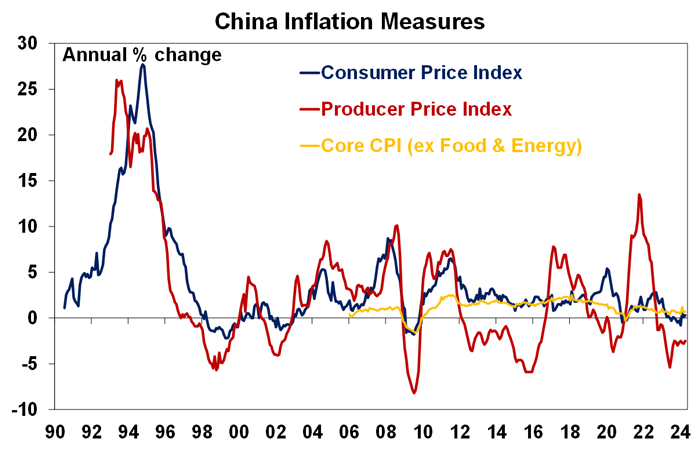
Chinese April activity data was weak. Consumer prices rose by 0.3% over the year to April but producer prices are still in deflation and were down by 2.5% year on year (see the chart below). Aggregate financing (a measure of credit growth) disappointed and new loan growth was also lower than expected. The weakness in credit growth reflects soft domestic demand.
Source: Bloomberg, AMP
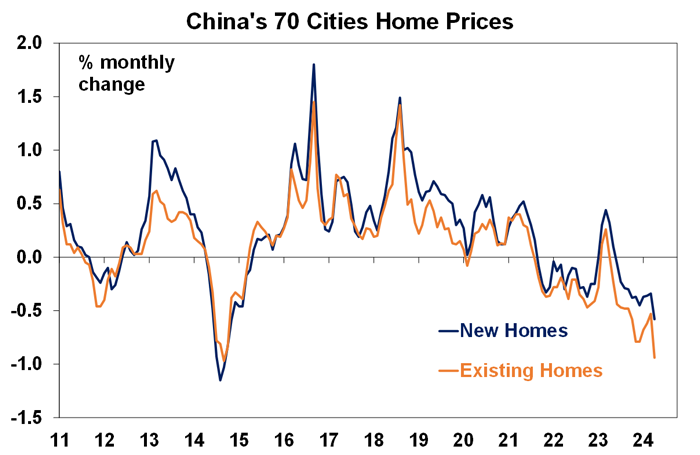
Chinese home prices continued to fall in April (see the next chart).
Source: Bloomberg, AMP
Chinese property investment was down by 9.8% year to date for April, fixed asset investment disappointed expectations and retail sales were up by just 2.3% over the year. However, industrial production remained strong (because of higher electric vehicle and chips spending), up by 6.7% over the year to April and the unemployment rate fell to 5% (from 5.2% last month).
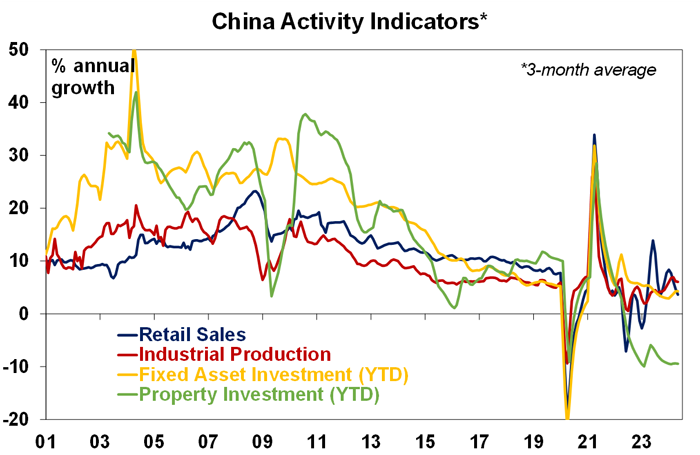
Source: Bloomberg, AMP
The UK unemployment rate rose to 4.3% in March (from 4.2% in the prior month) which was expected by economists. Wages growth (as measured by weekly earnings excluding bonuses) rose by 6% over the past year, a step up from last month but below recent highs. UK wages are high relative to global peers (see the chart below).
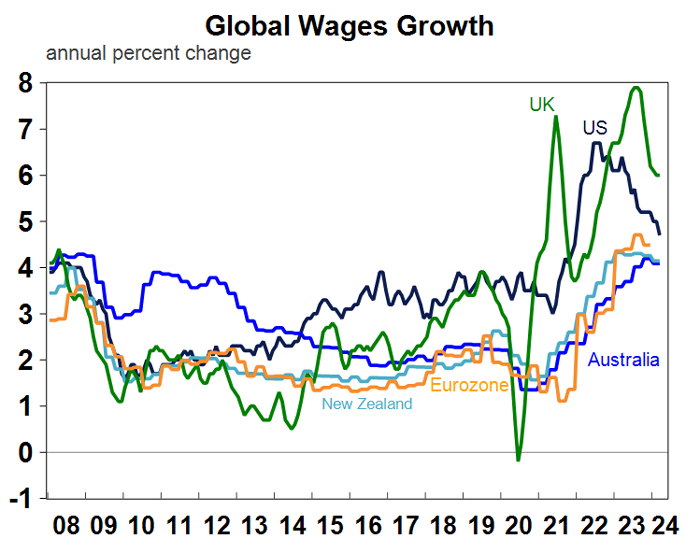
Source: Macrobond, AMP
Japan’s March quarter GDP data was disappointing, falling by 0.5% (expectations were for a decline of 0.3%) and last quarter was revised to flat. Private consumption was weak and a temporary auto production suspension also dragged on growth. Japanese GDP growth has been weak since last September (see the chart below).
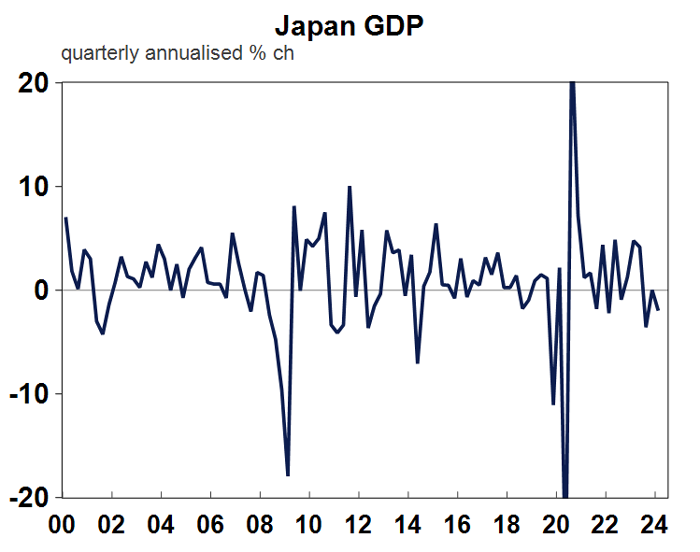
Source: Macrobond, AMP
Australian economic events and implications
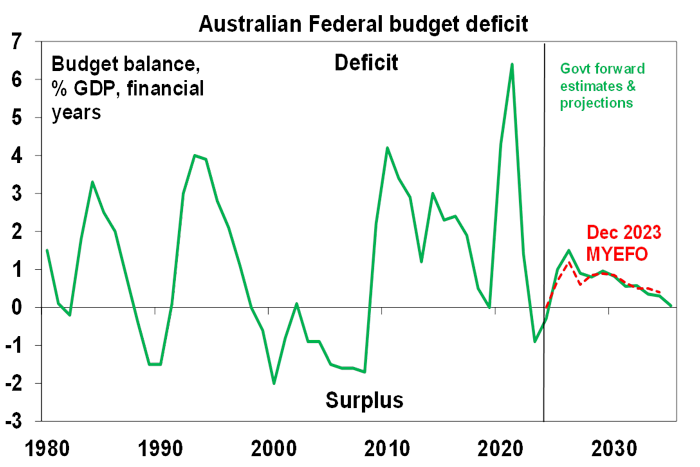
The 2024-25 Federal Budget was aimed at trying to lower inflation in the near term but supporting longer-term Government priorities including formally launching a “Future Made in Australia” (FMIA) over the medium term. There was another round of cost-of-living subsidies which were broader than expected, including giving a $300 energy rebate to all households, a further lift in Commonwealth Rental assistance for ~1mn households and other measures including cheaper medicines, prac payments for care workers and higher child care wages. The housing “package” was aimed at building more social housing. The 2023-24 surplus is expected to be $9.3bn (higher than forecast last year) thanks to a continuing revenue windfall, but the budget is expected to slip back into bigger deficits from 2024-25 because of a lift in government spending in the out years (see the table and chart below).
The ”table of truth” - underlying cash budget balance projections
| 2023-24 | 2024-25 | 2025-26 | 2026-27 | 2027-28 | ||
| May 23-24 Budget,$bn | -13.9 |
-35.1 | -36.6 |
-28.5 | ||
| Dec 2023 MYEFO, $bn |
-1.1 |
-18.8 | -35.1 | -19.5 | -26.5 | |
| Parameter chgs, $bn |
+10.6 |
+0.0 | +2.6 | -4.0 | +3.3 | |
| New stimulus, $bn |
-0.2 | -9.5 | -10.3 | -3.3 | -1.2 | |
| Projected budget,$bn |
+9.3 | -28.3 | -42.8 | -26.7 | -24.3 | |
| % GDP |
+0.3 | -1.0 | -1.5 | -0.9 | -0.8 |
Source: Australian Treasury, AMP
Source: Australian Treasury, AMP
The government’s broad cost-of-living measures will reduce measured headline inflation in 2024-25 and this will help to contain inflation and wage expectations, especially as many items are indexed to inflation. However, the lift to overall fiscal stimulus (see the chart below for shows that Federal and State fiscal positions point to a sharp shift from fiscal contraction to expansion over the year ahead) risks boosting demand and increasing inflation through second-round impacts of consumer spending. The Reserve Bank will likely reduce its headline inflation forecasts off the back of the cost-of-living measures, but the new fiscal stimulus will keep the RBA concerned about inflation and it will be watching to see how household spending responds to the stimulus measures. Our full budget note is available.
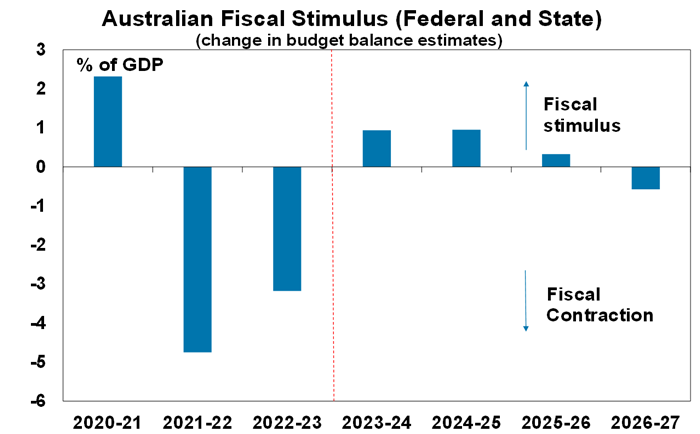
Source: Australian and State Treasuries, AMP
The opposition gave a “budget reply” and centred around reducing immigration significantly to help housing supply issues (which would be matched with reducing work restrictions on current visa holders so to prevent skills shortages and higher wages) and restricting foreign buyers into housing which won’t make much of a difference to demand as this group is tiny, in 2022-23 foreign buyers were approved to purchase 6575 residential homes which compares to monthly approvals for home construction which was 12,947 for the month of March.
The March overseas arrivals data showed some slowing in the pace of permanent and long-term immigrants compared to the recent high, but it is still at very elevated levels (see the chart below).
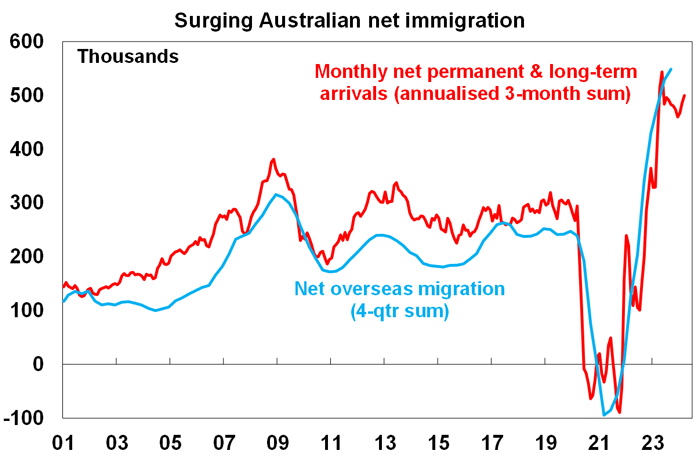
Source: ABS, AMP
The NAB April Business survey showed a slight fall in business conditions (which are around the long-run average) and confidence was unchanged at 1 (tracking around neutral) and has been hovering around this neutral level for months (see the next chart).
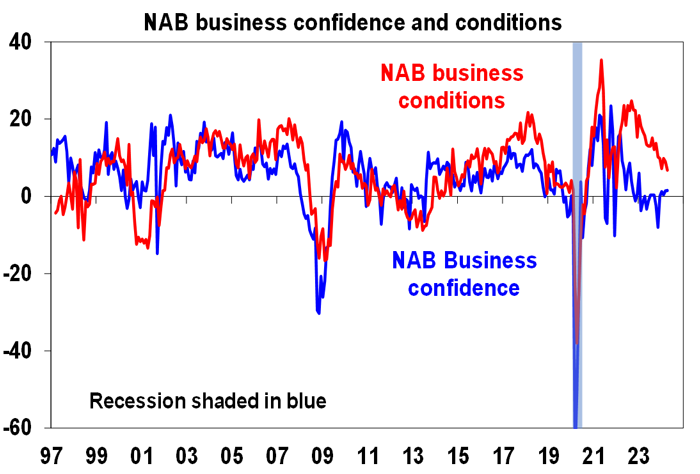
Source: Bloomberg, AMP
The price indicators are always worth watching in the survey and showed that labour costs continued to fall, along with purchase costs, while final product prices rose. The employment sub-index of the survey also fell, pointing to some weakness in the labour market.
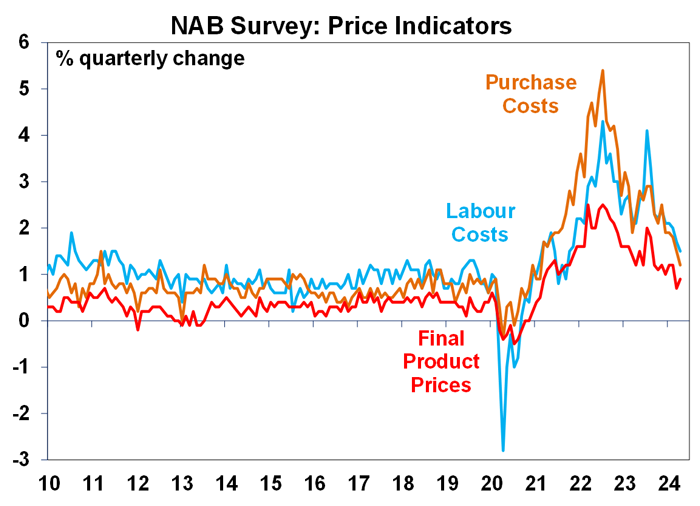
Source: Bloomberg, AMP
And on the labour market, the April employment data was a mixed bag. Jobs growth was solid, rising by 38.5K but the unemployment rate increased by 0.2 percentage points to 4.1%, back to where it was in January and a cyclical high. The ABS said that there was a larger-than-usual share of people unemployed and waiting to start work in April (which means they are only temporarily unemployed), and could see the unemployment rate go back down next month.
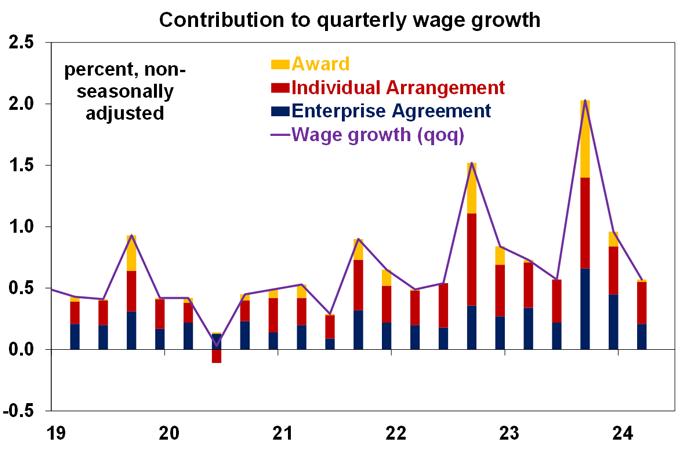
Source: ABS, AMP
Wages growth is elevated and the breadth of wage increases is broad-based, with almost half of the jobs that got a pay rise in the March quarter receiving a lift of over 4%. In our view, wages growth has peaked and will slow as the labour market loosens (despite the upside wages risks stemming from the Fair Work Commission’s wage decision in June). This is also the signal from our leading wages indicator (which includes recently approved and lodged Enterprise Bargaining Agreements, PMI employment survey, Seek Advertised Salary and NAB cost survey) – see the next chart.
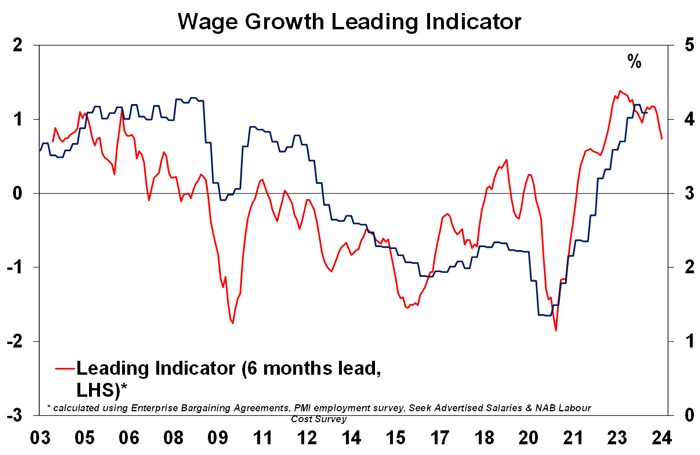
Source: ABS, AMP
What to watch over the next week?
In Australia, economists will be happy about a quieter data week! The RBA May meeting minutes will be examined to see how much discussion there was around a rate hike at the May meeting but the release of the RBA’s detailed Statement on Monetary Policy on the same day as the last meeting means the minutes may prove less relevant than usual. The May Melbourne Institute consumer sentiment will probably get a boost from the cost-of-living payments in this week’s budget and the May preliminary PMI’s are also released which should show a further moderation in services conditions.
In the US, the May FOMC meeting minutes are released and there is plenty of “Fedspeak” to digest. The May PMI’s are expected to show a further improvement in manufacturing conditions and a positive read on services. Other data includes home sales, more regional Fed activity indices and durable goods sales.
Eurozone PMI’s are also released and should show an improvement on the poor recent manufacturing readings.
Japanese consumer price inflation data is likely to show softer headline inflation (at 2.4% year on year to April) and PMI’s are also released.
Canadian April CPI data next week (expected to soften to 2.7% year on year) will firm up expectations for the Bank of Canada Meeting in June.
UK CPI is also released and a further slowing and may also bolster expectations for a Bank of England Rate cut, with two members of the committee voted for a cut at the last meeting.

Weekly market update 28-06-2024
28 June 2024 | Blog Dr Shane Oliver observes strong financial year returns - but can it continue?; Trump odds up after debate - watch trade war risks; risk of another RBA hike up but not fait accompli; Australian jobs market cooling; another big Australian budget surplus and more. Read more
Oliver's insights - investing 40 years
25 June 2024 | Blog Dr Shane Oliver shaes his nine most important lessons from investing over the past 40 years. Read more
Weekly market update 21-06-2024
21 June 2024 | Blog This week, narrowing US share gains; drip feed of falling global inflation & rates is good sign for RBA; Federal & state governments making the RBA's job harder; the pros & cons of nuclear; and more. Read moreWhat you need to know
While every care has been taken in the preparation of this article, neither National Mutual Funds Management Ltd (ABN 32 006 787 720, AFSL 234652) (NMFM), AMP Limited ABN 49 079 354 519 nor any other member of the AMP Group (AMP) makes any representations or warranties as to the accuracy or completeness of any statement in it including, without limitation, any forecasts. Past performance is not a reliable indicator of future performance. This document has been prepared for the purpose of providing general information, without taking account of any particular investor’s objectives, financial situation or needs. An investor should, before making any investment decisions, consider the appropriateness of the information in this document, and seek professional advice, having regard to the investor’s objectives, financial situation and needs. This article is solely for the use of the party to whom it is provided and must not be provided to any other person or entity without the express written consent AMP. This article is not intended for distribution or use in any jurisdiction where it would be contrary to applicable laws, regulations or directives and does not constitute a recommendation, offer, solicitation or invitation to invest.
The information on this page was current on the date the page was published. For up-to-date information, we refer you to the relevant product disclosure statement, target market determination and product updates available at amp.com.au.