

Investment markets and key developments
Economic data over the week was mixed, but mostly in line with softening, but not collapsing economic activity. Markets were waiting for the official US August non-farm which came out on Friday as a guide to whether the Fed will be cutting by 25 or 50 basis points at its upcoming meeting (on 18th September) and also to gauge the pace of the softening in the US economy but the data ended up being in a grey zone. After the US was closed Monday for the Labor Day public holiday, the S&P500 fell by 3.3% over the week, with particular weakness in the tech sector (in contrast consumer staples real estate were up). The ASX200 fell by 1.0% and sharemarkets in Europe, Japan and China also all fell. US 10 year bond yields fell further to 3.7% this week, the USD was a touch lower and the $A is just below 0.67USD.
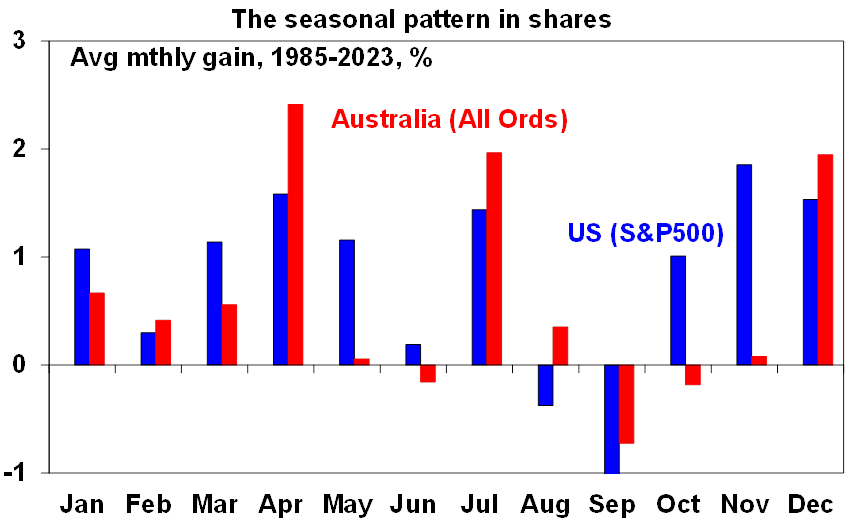
The main factors driving markets at the moment are: expectations for Fed rate cuts (more than 100 basis points of cuts are still predicted by markets by December), concern over the strength of the US tech industry, the state of the economy (any signs of a recession will be taken as a negative) and seasonality. September is seasonally a poor month for the S&P (hard to really know why but the theory is that it’s to do with the return to work after the Northern Hemisphere summer and portfolio rebalancing and also now the expectation of a “September effect” which is not good for shares as a result!).
Source: Bloomberg, AMP
We remain of the view that shares are at high risk of further falls in coming months because valuations are high, seasonality is a problem in September, there could be more downside for tech names like Nvidia, economic data could start moving into “concerning” territory as activity has slowed which will increase fears of recession and geopolitical risks like the US election and the issues in the Middle East could see investor uneasiness.
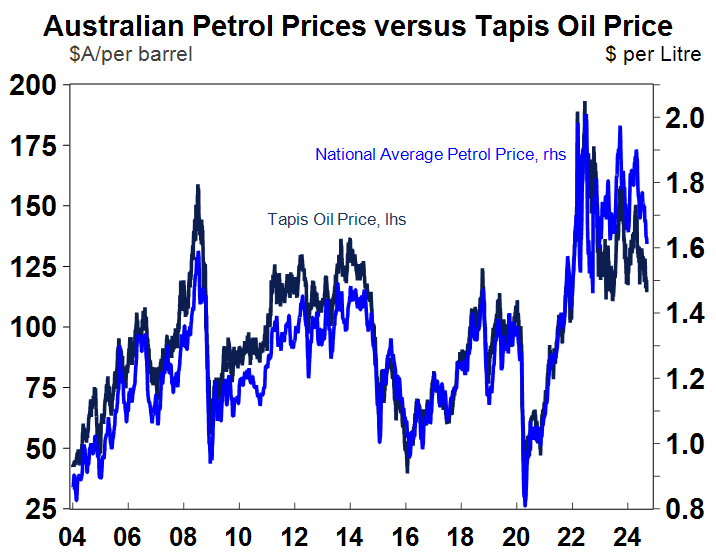
Oil prices fell further this week, with WTI at $67/barrel. Oil prices reached close to $90 in April and have trended down since then. Hopefully this will lead to some lower petrol prices for consumers, but Australian petrol prices have been holding up more than oil prices suggest they should (which means the oil refineries or the petrol stations are benefitting). Note: the chart below uses the Tapis oil price as an indicator for Australian petrol prices because this is a price reference for Asian/Australian markets.
Source: Macrobond, AMP
German state elections in Saxony and Thuringia generated some headlines this week, with the extreme right (AfD captured 33% and 36% of seats in the states respectively) AND the extreme left gained more seats (BSW and The Left Party gained 15% and 30% in the states). This follows recent elections in France, Italy, Netherlands, UK and EU that saw the “fringe” groups gain more popularity as mainstream parties are failing to listen to the grievances that their electorates have, leading to people voting for the “populists”. The next test for these fringe groups will be the Brandenburg elections in late September. Our Chief Economist Shane Oliver wrote about these issues with populism here.
Major global economic events and implications
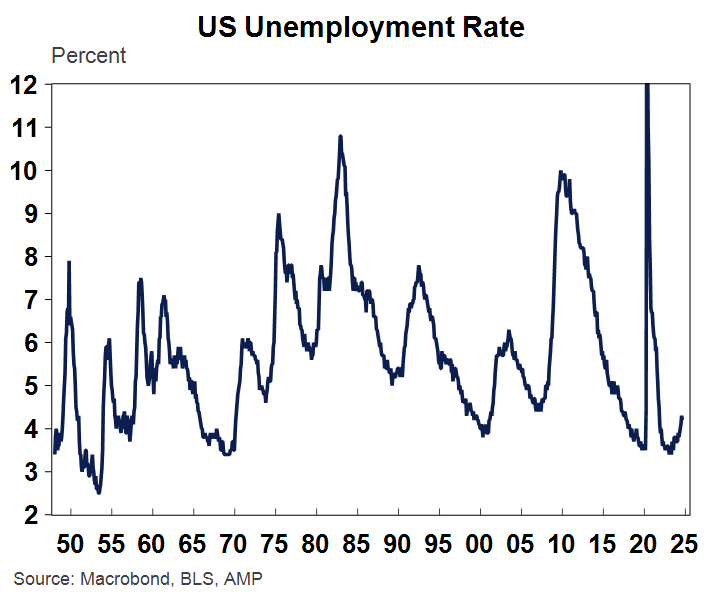
US economic data was mixed. The August non-farm payrolls ended up being in a grey zone. Non-farm payrolls rose by 142K, below the 165K expected but above last month’s downwardly revised 89K. However, the unemployment rate declined to 4.2% (from 4.3% last month) as expected which was taken as a good sign that labour market conditions are not deteriorating significantly. Fed members Waller and Williams spoke after the data and did not indicate a sense of immediate urgency in needing to cut interest rates by 50 basis points. So, a 25 basis point cut is more likely in September, with the risk of larger rate cuts if the data indicates the need for it.
Source: Macrobond, BLS, AMP
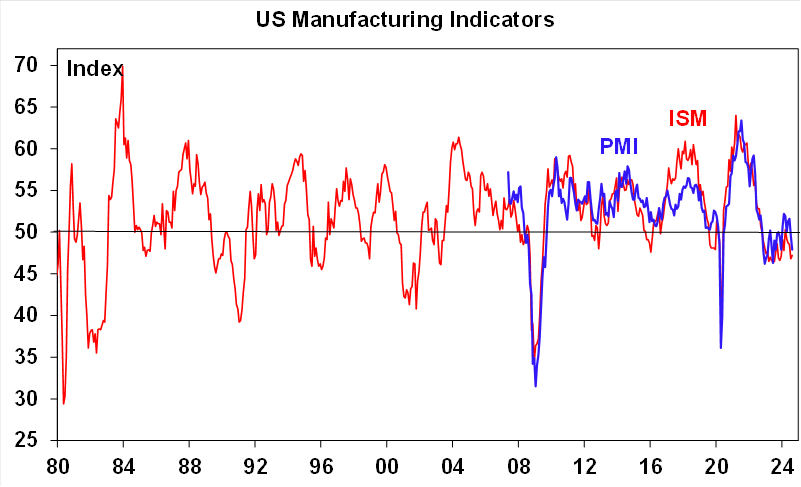
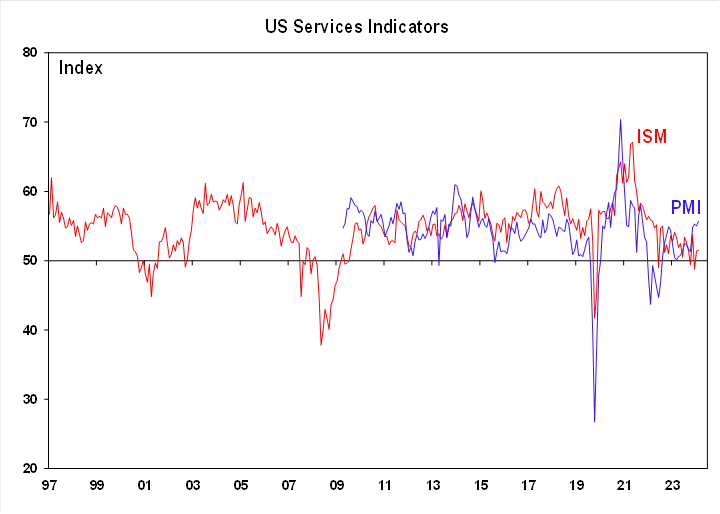
The ISM, a measure of business conditions alongside the PMI (the ISM is considered a broader measure and also has a longer time history) rose to 47.2 in August (from 46.8 last month) which was slightly below expectations and is still consistent with contracting manufacturing activity. The prices paid sub-index ticked up, new orders were down but employment looked better after a shocking print last month. The PMI index is only a touch higher than the ISM (see the chart below).
Source: Bloomberg, AMP
Services activity is propelling the US economy, with the services ISM lifting marginally to 51.5 in August (from 51.4 last month), a touch above expectations. Services prices paid rose, new orders improved but employment softened. The services PMI continues to run above the PMI (see the chart below). So all up, the business surveys suggest that US growth is moderating, but not collapsing.
Source: Bloomberg, AMP
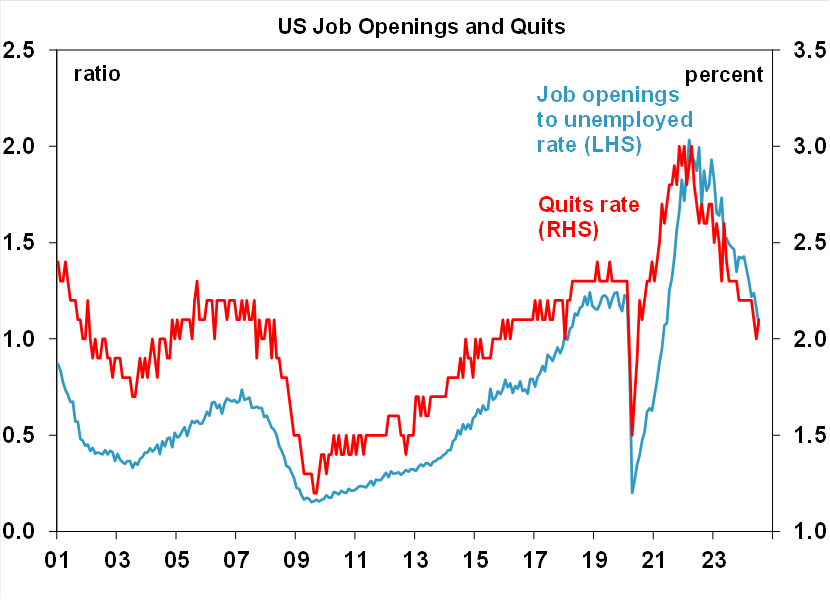
The US job openings data showed that the ratio of job openings to the number of people unemployed fell back again to 1.07, from 1.16 last month and is well below its high of 2 in late 2022 (see the chart below). This is now below its pre-Covid average and indicates that there is just over 1 job available for every unemployed person and is in line with a softening in the labour market. The “quits rate”, another sign of labour market strength and ticked up a little to 2.1% from 2% last month.
Source: Bloomberg, Macrobond, AMP
The market was anticipating the release of the US non-farm payrolls tonight so was looking for clues in other employment indicators. The ADP employment data was soft, rising by 99K in August, missing consensus estimates of 145K. Initial jobless claims were okay, down 5K from last week to 227K (and below the 1-month average of 230K).
The August Fed Beige book which is a qualitative report that combines all of the 12 regional Fed banks indicated a slowing in the economy, which is clear in basically of the US data. Nine out of 12 Fed districts reported flat or declining activity (up from 5 last month). However, there were little signs of distress. Employment growth is rising slower but “reports of layoffs remained rare”.
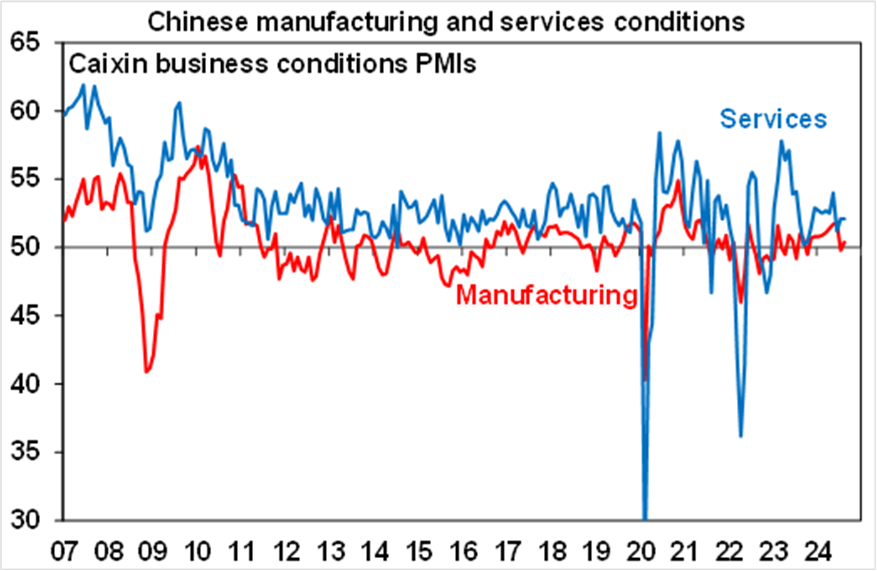
The China Caixin PMI is an indicator of business conditions but has a higher weighting to small businesses compared to the PMI. The August manufacturing PMI improved, rising to 50.4 (from 49.8 last month) and better than expected while services softened a little to 51.6 (from 52.1) last month. Both indicating expanding activity, in contrast to some of the doom and gloom surrounding the Chinese economy.
Source: Bloomberg, AMP
The Bank of Canada (BoC) cut rates again by 25 basis points to 4.25%, its third consecutive interest rate cut. Governor Macklem sounded dovish stating “its reasonable to expect further cuts in our policy rate” assuming inflation slows in line with its forecasts. The BoC is also now talking about potential risks of growth and inflation undershooting forecasts and if that were the case the BoC was “prepared to take a bigger step” (i.e. cutting by 50 basis points). The market is expecting another 3 rate cuts by the end of the year. Out of interest, Canadian headline inflation is at 2.5% and the core (trimmed mean) is at 2.7%. The unemployment rate has increased to 6.4% from its 2022 low of 4.8%.
Source: Bloomberg, Macrobond, AMP
In the Eurozone, besides some secondary revisions to PMI’s and GDP, the retail sales data remained weak. Spending rose by 0.1% in July, or -0.1% on a year ago – see the chart below.
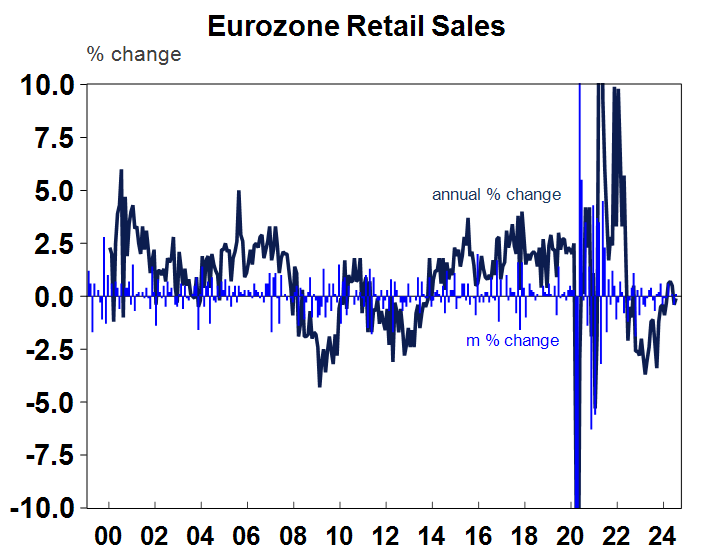
Source: Macrobond, AMP
Australian economic events and implications
It was all happening in Australia this week, starting off with the CoreLogic series on home prices, which rose by 0.5% in August or 7.1% higher than a year ago. Units are up by 0.5% and houses by 1.3% over August. The pace of growth for homes has slowed, but there are quite big divergences across markets. Perth (+2% monthly home price growth), Adelaide (+1.4%) and Brisbane (+1.1%) are booming although Brisbane price growth has started to moderate. Sydney price growth continues to track modestly higher (+0.3% this month). Darwin (-0.2%) and Canberra (-0.4%) prices have softened although are still positive compared to a year ago. But, Melbourne (-0.2%) prices continue to fall and are 4.9% lower than a year ago because of pockets of oversupply and state taxes denting buyer confidence. And Hobart (-0.1% in August) prices continue to weaken and are 12.2% lower than a year ago.
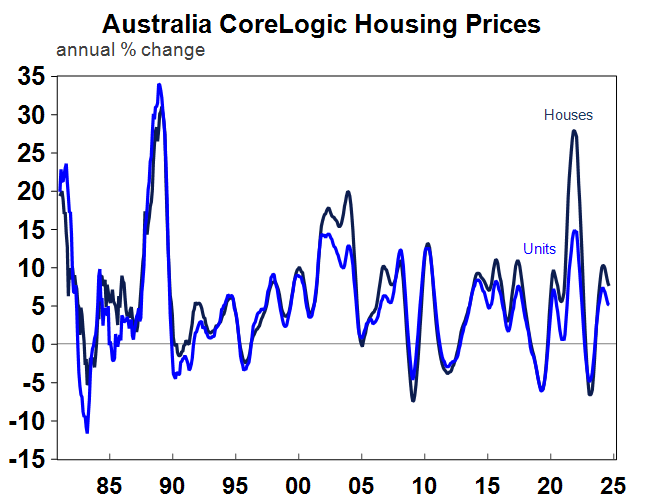
Source: Macrobond, CoreLogic, AMP
The monthly Melbourne Institute inflation gauge slowed further in year on year terms, to 2.5% from 2.8% last month, in line with an expected further deceleration in inflation (see the chart below).
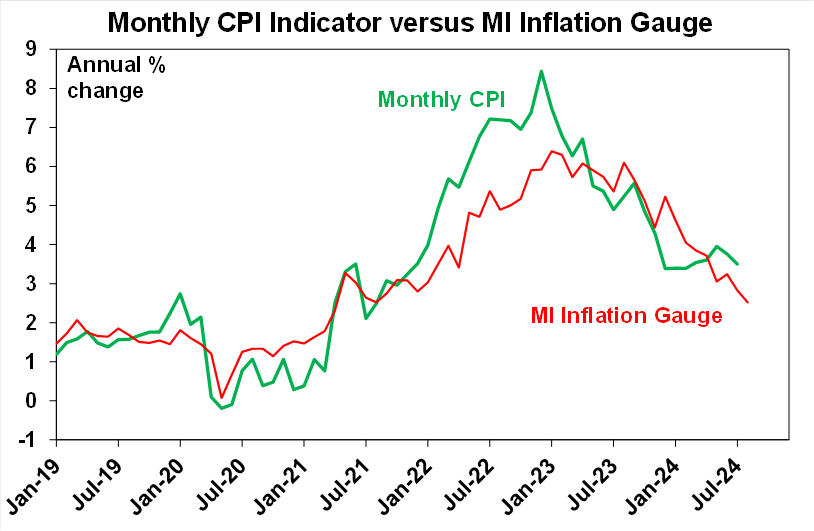
Source: Bloomberg, ABS, AMP
July building approvals jumped up by 10.4%, after a 6.4% fall in the prior month thanks to a 33.7% lift in apartment approvals. Building approvals tend to be volatile month-by-month if there are large apartment blocks that get approved. Building approvals had been trending sideways over recent months, but at least the July data reversed this trend! Over the last 12 months, building approvals have run at 165K – well below the 250K level we should be building to keep up with housing demand.
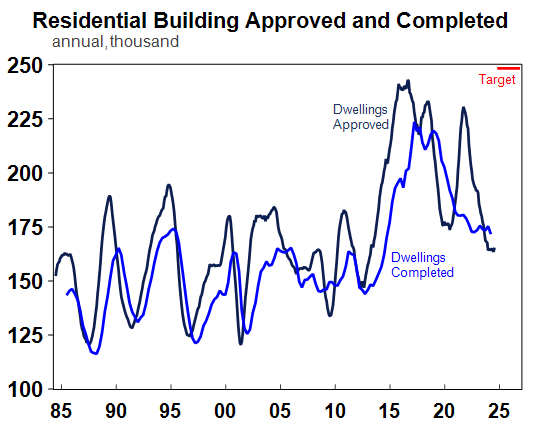
Source: Macrobond, AMP
Australian June quarter GDP rose by 0.2% or 1% over the year, right on expectations. However, the components of GDP were more interesting than the headline. Consumer indicators were weaker, with the largest decline in consumer spending since the GFC (outside of the pandemic), the household savings ratio was unchanged at a low 0.6% and real household disposable income was low, at just 1% over the year to June (although at least its not negative anymore). Government spending remains a key driver of GDP growth (see chart below).
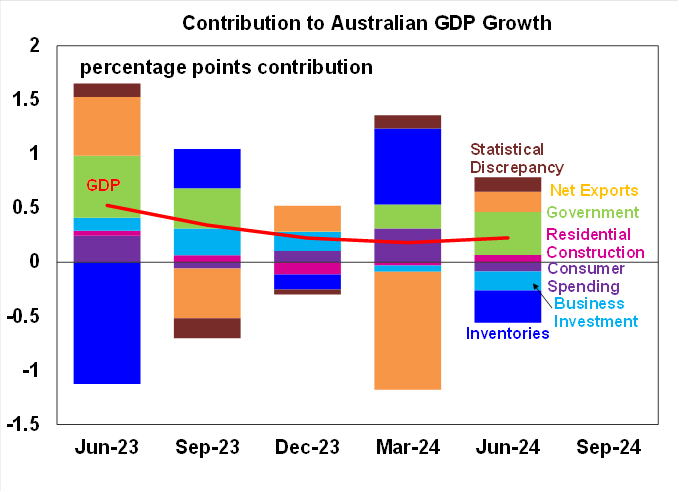
Source: ABS, Macrobond, AMP
The balance on payments data showed the current account deficit widened to $10.7bn or 1.6% of GDP from 0.9% last quarter. The current account has been deteriorating since reaching a record surplus in 2023 from a higher net income deficit.
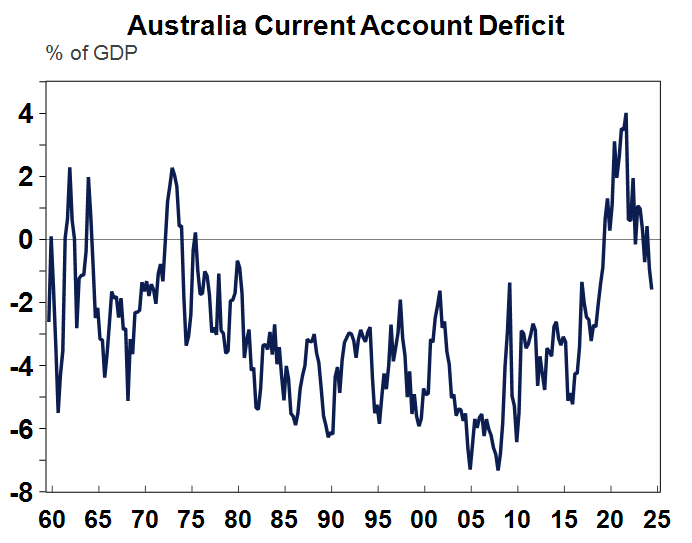
Source: Macrobond, ABS, AMP
The July trade balance rose to $6.0bn, as export growth exceeded imports. The trade balance remains positive thanks to strong exports.
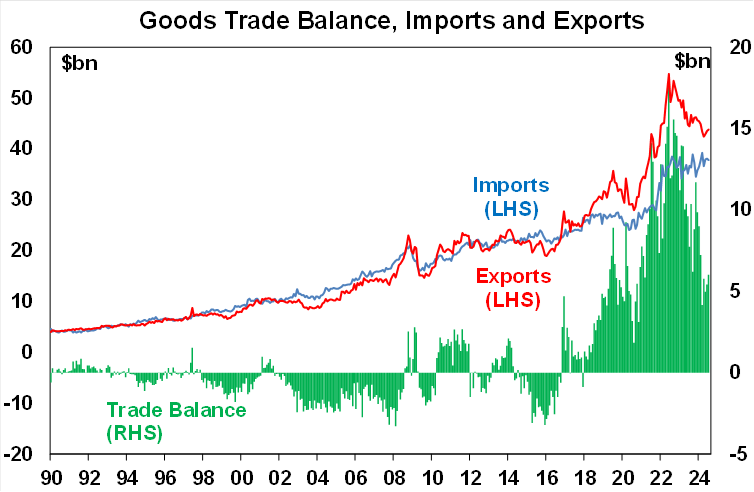
Source: ABS, Bloomberg, AMP
The monthly household spending indicator, the ABS’s new alternative measure of household spending (which is broader than the retail data) rose by 0.8% over the month of July, or 2.9% over the year. This is stronger than the indicator from retail sales. But, in real terms this is around flat compared to a year ago.
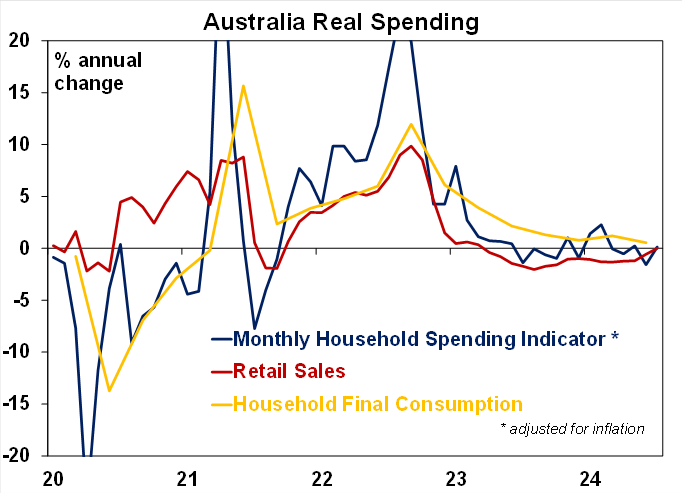
Source: ABS, Macrobond, AMP
Australian housing lending rose by 3.9% in July (well above estimates of a 1% rise), with a 5.4% increase in investor loans, 2.9% for owner-occupiers and 0.8% for first-home buyers. Despite the affordability challenges in the market, there is still demand for home loans in Australia.
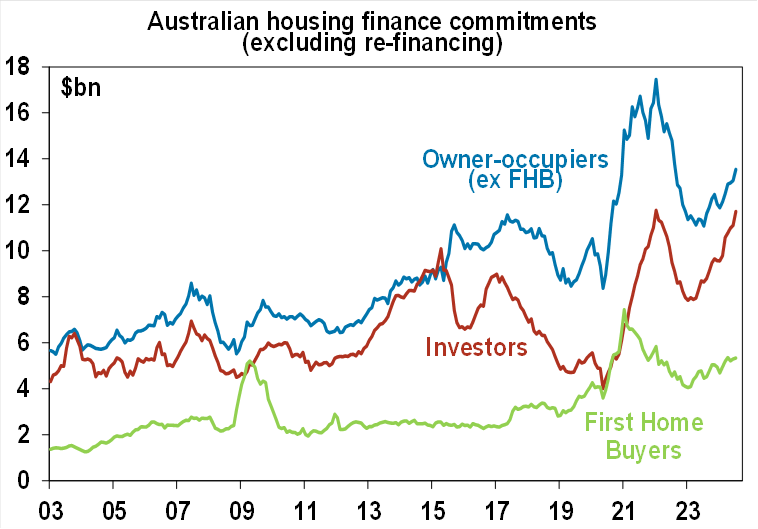
Source: ABS, AMP
After a few quiet weeks from the central bank, there was plenty to digest this week. RBA Governor Michelle Bullock spoke at the Australian Business Economists annual Anika Foundation lunch. The topic of the speech was “The Costs of High Inflation”. The Governor highlighted that the RBA remained vigilant to upside inflation risks in Australia, because high inflation hurts everyone, particularly those on low incomes. Bullock explained the key drivers of inflation more recently which have been housing costs and market services inflation (and administered prices to a lesser extent). The RBA is of the view that the demand/supply imbalance in Australia is still one where demand is exceeding supply. This has occurred as demand has been stronger than expected but also because the supply-side of the economy hasn’t increased as much as expected. She reiterated that the Board maintains its view that’s its “premature” to be thinking about rate cuts, unless circumstances change which is basically an unchanged message from the last meeting .
Bullock also spoke about the RBA’s research into how borrowers have dealt with higher interest rates.
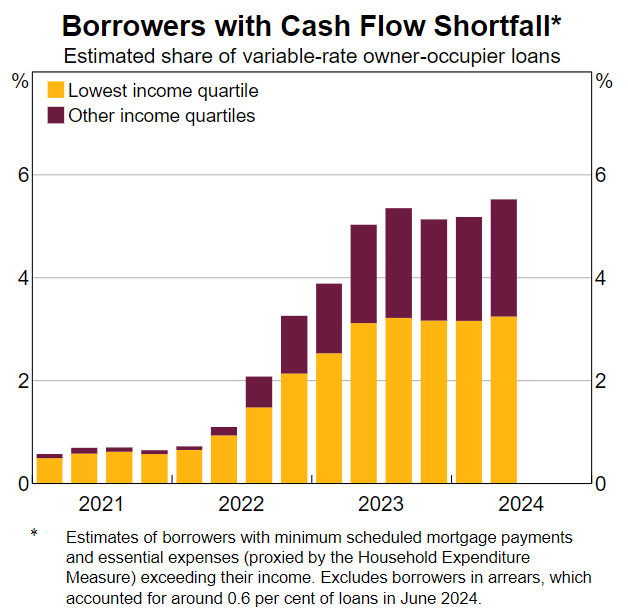
Sources: ABS; Melbourne Institute; RBA; Securitisation System.
On the RBA’s numbers, around 5% of variable-rate borrowers have negative cash flow (with a large share of those lower-income households), when essential spending and mortgage repayments are exceeding income which has been around this level for over a year (see the chart above). This is above the <1% number of borrowers that were in this position in early 2021. These borrowers have had to make adjustments, like cutting back on spending to more essential items, trading down to lower quality goods and services, dipping into savings or working extra hours. Bullock said “some may ultimately make the difficult decision to sell their homes” but the media took this quote out of context indicating that the Governor was “warning” households that they may have to sell their homes... which was not the case. The bottom line is that the proportion of households that are in true “mortgage stress” remains low, which is also clear in other indicators like housing listings and mortgage arrears although it could increase as the unemployment rate rises.
Bullocks comments came after Federal Treasurer Jim Chalmers said that high interest rates were “smashing” the economy (prior to the poor GDP data) which many took as the government “blaming” the RBA for poor GDP growth. Comments like this from the Treasurer are unfair to the RBA, who has one tool to control inflation (monetary policy). It also looked like the government was trying to shift the “blame” for weak economic conditions, when exuberant government spending in recent years has helped to fuel inflation, especially in the past year with government federal and state budget deficits expanding more than expected, leading to a positive “fiscal impulse” (see the chart below) which could make it harder for the RBA to reduce inflation. Better to steer away from playing the blame game I think!
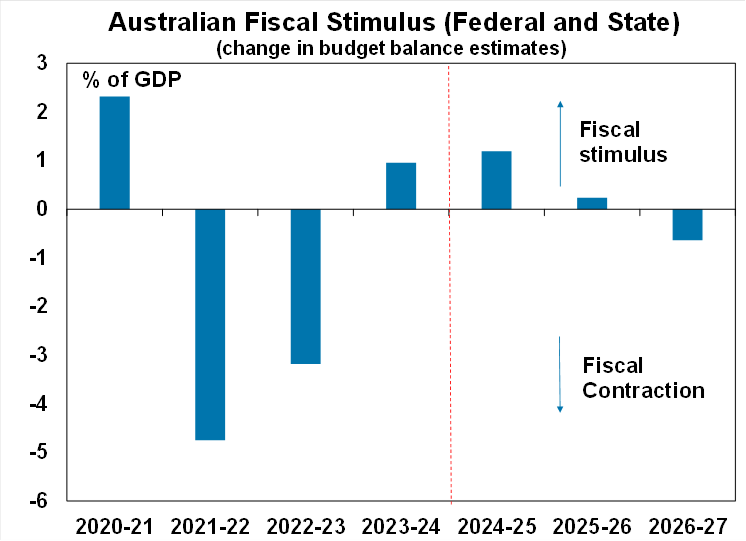
Source: Federal and State Treasury, ABS, AMP
RBA Deputy Governor Andrew Hauser also spoke on a podcast this week with Michelle Grattan after a trip to Jackson Hole with other central bankers. The key comments from the interview include why Australia doesn’t have to cut rates just because the Fed, and Hauser’s impressions of the Australian economy since relocating here from the UK and working at the Bank of England.
What to watch over the next week?
US data next week includes the NFIB small business confidence index which seems to rise alongside higher odds of a Trump presidency. August CPI data is out next week and is expected to rise by 0.2% over the month or 2.6% year on year (from 2.9% last month). August producer prices are also expected to be soft, up by 0.2% in August. There are also speeches from Fed officials Williams and Waller. US Presidential Candidates Trump and Harris will hold their first debate on 10 September which will cause some movements in betting markets odds.
Expectations are for a 165K lift in jobs (after 114K last month), and the unemployment rate to go back to 4.2%. Average hourly earnings are expected to rise by 3.7% over the year to August. Other US data next week includes the NFIB small business confidence index which seems to rise alongside higher odds of a Trump presidency. August CPI data is out next week and is expected to rise by 0.2% over the month or 2.6% year on year (from 2.9% last month). August producer prices are also expected to be soft, up by 0.2% in August. There are also speeches from Fed officials Williams and Waller. US Presidential Candidates Trump and Harris will hold their first debate on 10 September which will cause some movements in betting markets odds.
For Australia, it’s a quiet week after the one just gone past, with just the Westpac consumer confidence reading for September and the NAB business confidence data for August. RBA Assistant Governor Sarah Hunter will speak at the Barrenjoey Economic Forum in Sydney.
In China, August consumer and producer price data is likely to show soft inflation outcomes continue in China. Export and import data is also released for August, with export growth being strong recently. August home prices are likely to dip again. And monthly Chinese activity data on industrial production, retail sales, fixed asset investment and property investment will be an important signal for the pace of Chinese growth and could mean some volatility in iron ore prices next week.
In Europe, the European Central Bank meets and is expected to cut interest rates by another 0.25%, with the last cut in June.
Outlook for investment markets
Easing inflation pressures, central banks moving to cut rates and prospects for stronger growth in 2025-26 should make for reasonable investment returns over 2024-25. However, with a high risk of recession, poor valuations and significant geopolitical risks particularly around the US election, the next 12 months are likely to be more constrained and rougher compared to 2023-24 and there is a high risk of a further correction in the next few months. A recession is the main threat for shares and there is a risk that we may have already seen the high for the year in the Australian share market after it reached our year-end target of 8100 in early August.
Bonds are likely to provide returns around running yield or a bit more, as inflation slows, and central banks cut rates.
Unlisted commercial property returns are likely to remain negative due to the lagged impact of high bond yields and working from home reducing office space demand.
Australian home prices are likely to see more constrained gains over the next 12 months as the supply shortfall remains, but still high interest rates constrain demand and unemployment rises. The delay in rate cuts and talk of rate hikes risks renewed falls in property prices as its likely to cause buyers to hold back and distressed listings to rise.
Cash and bank deposits are expected to provide returns of over 4%, reflecting the back up in interest rates.
A rising trend in the $A is likely taking it to $US0.70 over the next 12 months, due to a fall in the overvalued $US and a narrowing in the interest rate differential between the Fed and the RBA. A recession is the main downside risk.

Oliver's insights - Trump challenges and constraints
19 November 2024 | Blog Why investors should expect a somewhat rougher ride, but it may not be as bad as feared with Donald Trump's US election victory. Read more
Econosights - strong employment against weak GDP growth
18 November 2024 | Blog The persistent strength in the Australian labour market has occurred against a backdrop of poor GDP growth, which is unusual. We go through this issue in this edition of Econosights. Read more
Weekly market update 15-11-2024
15 November 2024 | Blog Global share markets were messy over the last week, not helped by the ongoing rise in bond yields and a wind back in Fed rate cut expectations after some elevated US inflation data and slightly hawkish comments from Fed chair Powell. Read moreWhat you need to know
While every care has been taken in the preparation of this article, neither National Mutual Funds Management Ltd (ABN 32 006 787 720, AFSL 234652) (NMFM), AMP Limited ABN 49 079 354 519 nor any other member of the AMP Group (AMP) makes any representations or warranties as to the accuracy or completeness of any statement in it including, without limitation, any forecasts. Past performance is not a reliable indicator of future performance. This document has been prepared for the purpose of providing general information, without taking account of any particular investor’s objectives, financial situation or needs. An investor should, before making any investment decisions, consider the appropriateness of the information in this document, and seek professional advice, having regard to the investor’s objectives, financial situation and needs. This article is solely for the use of the party to whom it is provided and must not be provided to any other person or entity without the express written consent AMP. This article is not intended for distribution or use in any jurisdiction where it would be contrary to applicable laws, regulations or directives and does not constitute a recommendation, offer, solicitation or invitation to invest.
The information on this page was current on the date the page was published. For up-to-date information, we refer you to the relevant product disclosure statement, target market determination and product updates available at amp.com.au.