

Investment markets and key developments
Global share markets were mixed over the last week as the war in the Middle East escalated further with Iran’s retaliatory missile strike on Israel and investors nervously waiting to see whether Israel’s response will threaten global oil supplies but solid US jobs data signalling that the US economy remains resilient providing support on Friday. For the week US shares gained 0.2% as the resilient jobs data pushed it back into positive territory, but Eurozone shares fell 2.2% and Japanese shares fell 3%. Chinese shares rose on 8.5% on Monday on the back of policy stimulus but have been closed since for a holiday. Reflecting the Middle East worries Australian shares also fell by 0.8% with falls led by consumer, mining and financial stocks, despite a surge in energy shares. Oil prices rose on the back of supply disruption fears by 9%. But despite the uncertainty there wasn’t a generalised trend to safe havens with the $US up and the $A down but bond yields up on resilient US jobs data and the gold price little changed. Iron ore prices surged on the back of Chinese stimulus, but metal prices fell. So, all up a pretty messy week.
The moves over the last week in shares weren’t big but indicate that shares are vulnerable in the short term after their surge to record highs. The combination of stretched valuations, optimistic investor sentiment, the still high risk of recession in the US and Australia, the expansion of the war in the Middle East to potentially impact oil supplies and the US election (if Trump looks like winning or their looks like being a Democrat clean sweep) mean that the risk of another correction is high. On a 6-12 month view though shares are likely to head higher on the back of the success in getting global inflation down, central bank rate cuts (with the RBA getting closer to joining in) and China ramping up policy stimulus. October can often see high levels of share market volatility, but beyond that we are now coming into a positive time of the year for shares from a seasonal perspective after they performed surprisingly well through the normally weak months of August and September.
Right now though investors are on edge waiting to see what happens next in the Israel/Iran conflict. The historical experience tells us the war around Israel won’t impact global markets in a big way unless global oil production is disrupted, but the risks on this front have increased with Iran (which accounts for 3% of global fuel supply) attacking Israel with more missiles. So far oil prices have bounced but only by 9% or so from their lows a week ago, which is just a flick off the bottom which has taken prices back to where they were in August and a non-event in an historical context - as can be seen in the next chart.
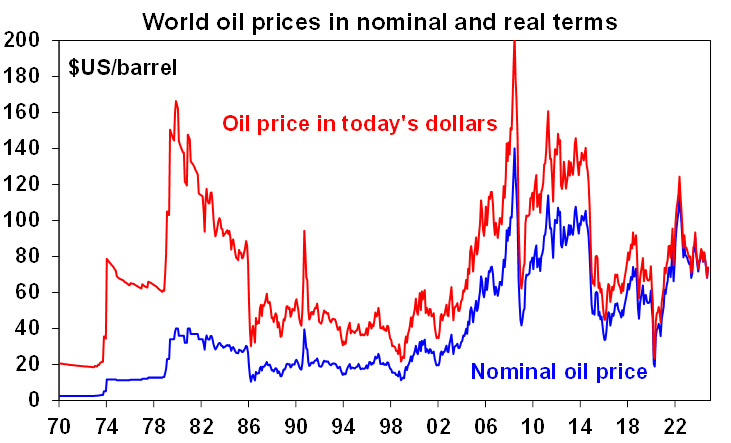
Source: Bloomberg, AMP
So far the moves are not big enough to have a significant impact on Australian petrol prices – maybe 5 cents a litre at most.
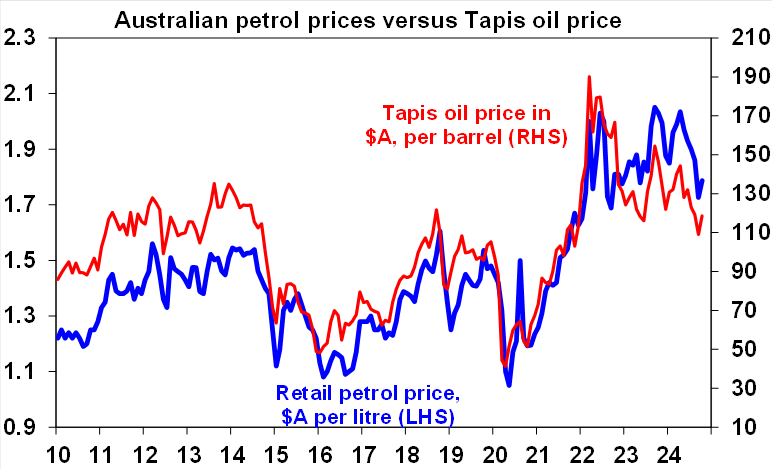
Source: Bloomberg, AMP
But what happens next will depend on Israel. If Israel’s response is proportional and focussed on Iranian military facilities – with US President Biden trying to discourage it from attacking Iranian oil production and nuclear facilities - then the oil price and shares will quickly settle down again, just as we saw after the exchange of missiles between Iran and Israel in April. This will be helped by Saudi Arabia raising production in December, Libyan oil production (1% of supply) resuming and rising non-OPEC production. This as we noted last week would be good for petrol prices as it would likely see a continuing downtrend towards $A1.60/litre (averaging through each of the capital city cycles). If alternatively, Israel escalates with an attack on Iranian nuclear facilities or its oil production or oil exporting infrastructure then we could be in for a much rougher ride in share markets as things escalate impacting oil supply, particularly if Iran retaliates as its threatening to do by striking Gulf oil assets in other countries or blocking the Strait of Hormuz through which 20% of global liquid fuel supply flows each day. This could push oil prices back to the post Ukraine invasion highs around $US120/barrel or more which could add fifty cents a litre or more at the petrol bowser for Australian motorists. This in turn would add about $18 to the weekly household petrol bill which would act as a “tax” on spending depressing retail sales. It’s a similar impact in other countries and a surge higher in oil prices could also threaten progress in getting inflation down although central banks including the RBA will focus on underlying inflation. As a result, investment markets are on tenterhooks waiting to see how Israel responds and how in turn Iran responds.
Meanwhile the good news on global inflation continued to flow over the last week with another fall in Eurozone inflation. The ECB is on track for another rate cut this month (possibly 0.5%) and Bank of England Governor Bailey said it could become “a bit more aggressive” in cutting rates. Meanwhile, comments by Fed Chair Powell reaffirmed its base of 0.25% cuts, with solid payrolls data for September leaning against another 0.5% cut but soft forward looking US jobs data consistent with 0.25% cuts. Fortunately, the US port strike impacting US East and Gulf coast ports has already ended causing minimal impact on supply chains.
Source: Bloomberg, AMP
Just like US shares, Australian shares tend to rise after the first Fed rate hike – unless there is a recession. In a recent note I had a table showing the US share market performance after the first Fed rate cut after a hiking cycle. So here is the same table for Australian shares showing the response 3 months, 6 months and 12 months after the first Fed cut. And the message is pretty much the same – unless there is a recession Australian shares tend to rise after the first Fed rate cut. Our base case is that the US will avoid a recession, which means upside for Australian shares over the next year, but the risks around a recession in the US and Australia, and what happens next in the Middle East which could add to the risk of recession, bear watching closely.
| First rate cut | +3mths | +6mths | +12mths |
| July 81 | -13.2 | -13.4 | -26.6 |
| Sept 84 | -1.8 | 12.3 | 33.5 |
| Oct 87 | -16.3 | -7.7 | 2.7 |
| June 89 | 14.1 | 8.5 | -1.3 |
| July 95 | -2.0 | 8.1 | 3.0 |
| Sep 98 | 8.8 | 14.7 | 11.4 |
| Jan 01 | -0.6 | -0.6 | 3.4 |
| Sept 07 | +0.7 | -18.5 | -25.6 |
| Jul 19 | -2.2 | 3.0 | -13.0 |
| Average | -1.4 | 0.7 | -1.4 |
US recessions highlighted in red. Source: Bloomberg, AMP
Australian budget surplus confirmed for 2023-24 at $15.8bn (0.6% of GDP), up from $9.3bn at budget time. This was no surprise as a larger surplus was evident in the monthly budget data already released but its good news as its led to a fall in net debt, which thanks also to strong nominal GDP growth is back to 18% of GDP which is around where it was pre-Covid. And Australia’s budgetary position is far better than in most other comparable countries. The bad news is that the personal income tax as a share of GDP rose to its highest in 25 years, the improvement since the May budget was due to a likely temporary fall in spending (from less welfare demand and delays in payments to states), and structural spending pressures are projected to push the budget back into deficit this year. The better starting point and iron ore prices running above budget assumptions may help but election spending will likely offset that. The return to deficit will mean a sharp easing in fiscal policy ahead which may limit how much the RBA will cut interest rates by, particularly if its accompanied by a further boost to government spending in the run up to the next Federal election.
Source: Commonwealth Treasury, AMP
Major global economic events and implications
US payrolls were strong but other data was mixed. Payrolls rose a far stronger than expected 254,000 in September with prior months revised up, unemployment falling to 4.1% (from 4.2%) and average hourly wages growth perking up to 4%yoy (from 3.9%). This is consistent with jobless claims remaining low. Against this though, other US economic data was mixed. The ISM manufacturing index remained weak at 47.2 with a fall in the prices component. But the services ISM rose to a solid 54.9 with a rise in prices. However, forward looking jobs indicators continue to point to labour market softness ahead. The employment components in both of the ISM surveys saw further weakness in September, job openings rose in August, but the trend remains down and the proportion of workers quitting for new jobs continues to plunge (suggesting less job opportunities). And temporary employment and hours worked fell which can be a sign of softness. For the Fed the strong September payrolls report will provide it with confidence that the US economy remains resilient and it’s not “behind the curve” in cutting rates, but given the weakness in leading indicators and slowing inflation its likely to continue cutting – but at the pace of 0.25%, not 0.5%. Of course, there is more jobs and inflation data to come ahead of its next meeting in November.
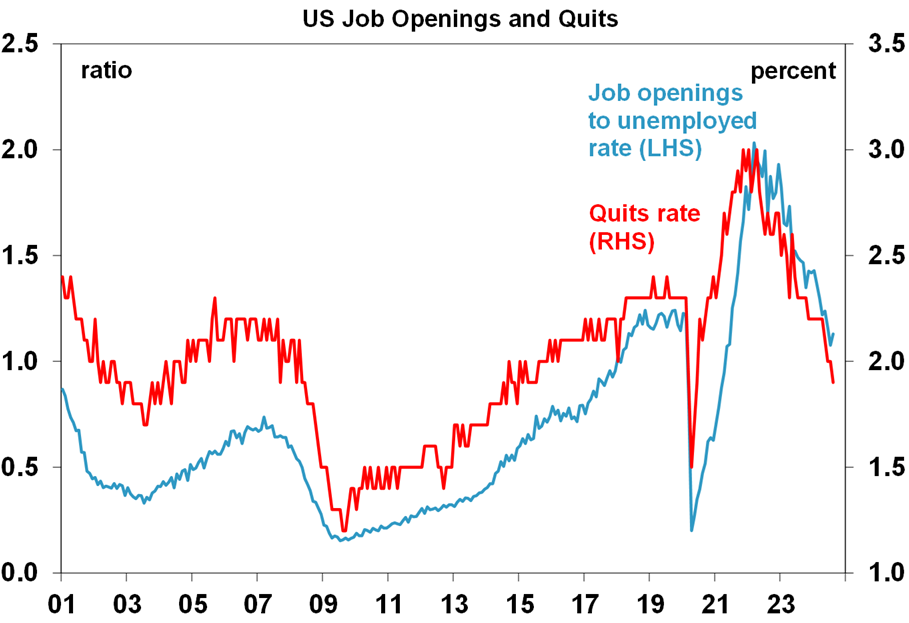
Source: Bloomberg, AMP
The plunge in quits is also consistent with a further slowdown in wages growth.
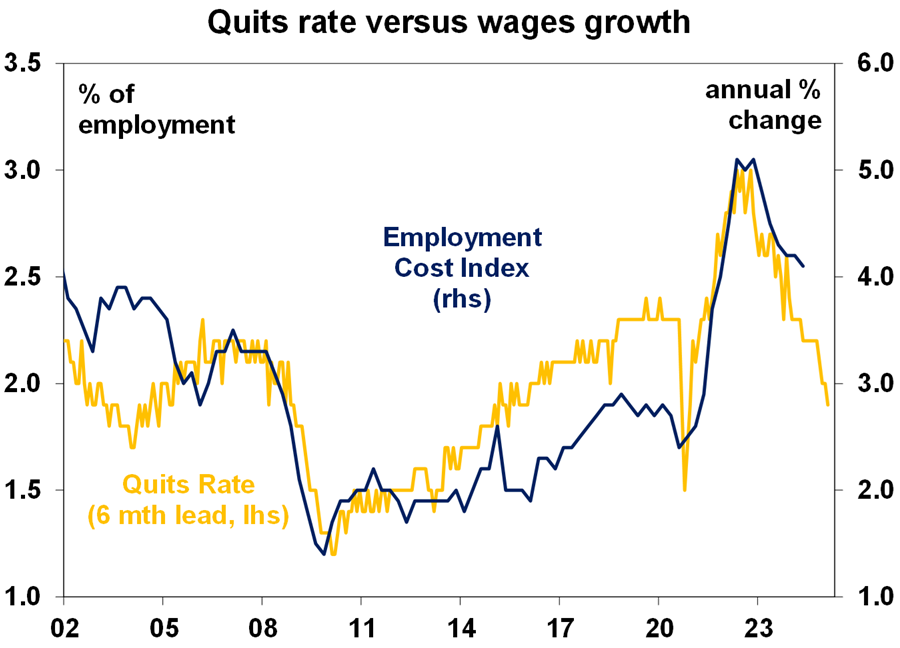
Source: Bloomberg, AMP
Eurozone unemployment was unchanged at 6.4% in August but inflation continued to fall pointing to another ECB rate cut this month. ECB President Lagarde appears open to an October rate cut and other ECB officials appear to be too. The money market has priced in a 63% chance of a 0.5% cut.
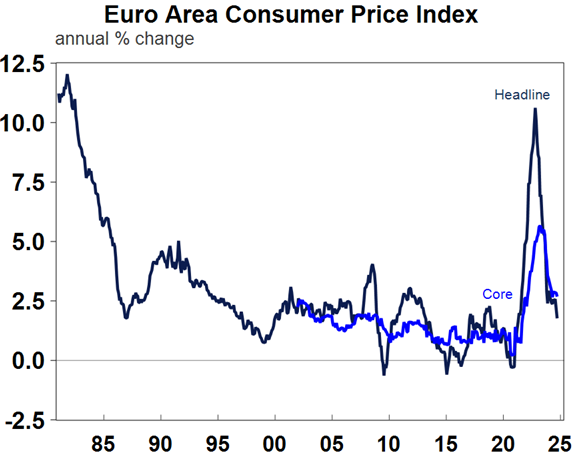
Source: Macrobond, AMP
Japanese industrial production and housing starts disappointed in August, but retail sales were solid and the September quarter Tankan suggested business conditions were reasonable, particularly for large companies.
Chinese business conditions PMIs remained weak in September with the Caixin PMIs catching down to the official PMIs. This is arguably old news though with China announcing stepped up stimulus in response to weak data – albeit we are still awaiting details in terms of the fiscal response.
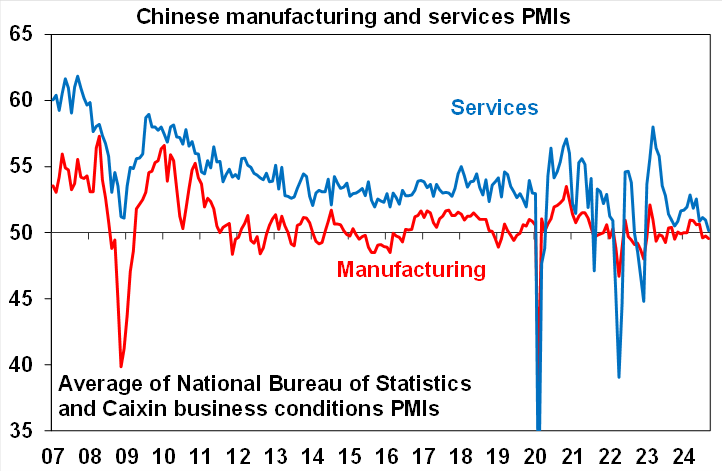
Source: Bloomberg, AMP
Australian economic events and implications
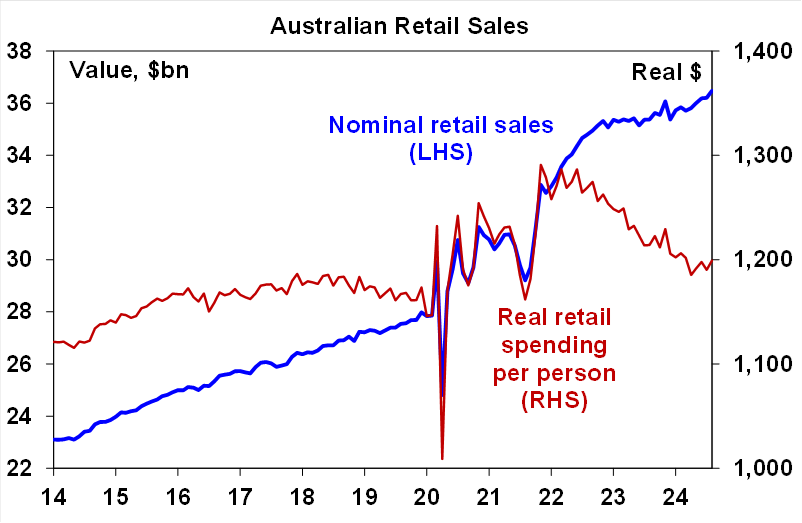
Australian economic data releases over the last week were a mixed bag suggesting the economy is continuing to muddle along with weak growth. Retail sales rose a stronger than expected 0.7% in August. This may reflect the tax cuts but the combination of hotter than normal weather (pulling forward spring purchases) and Fathers’ Day falling on the first day of September (bringing more related spending into August) are likely to have been the main drivers with bank card data suggesting that spending eased in September. In the meantime, real retail sales per person remain depressed.
Source: ABS, AMP
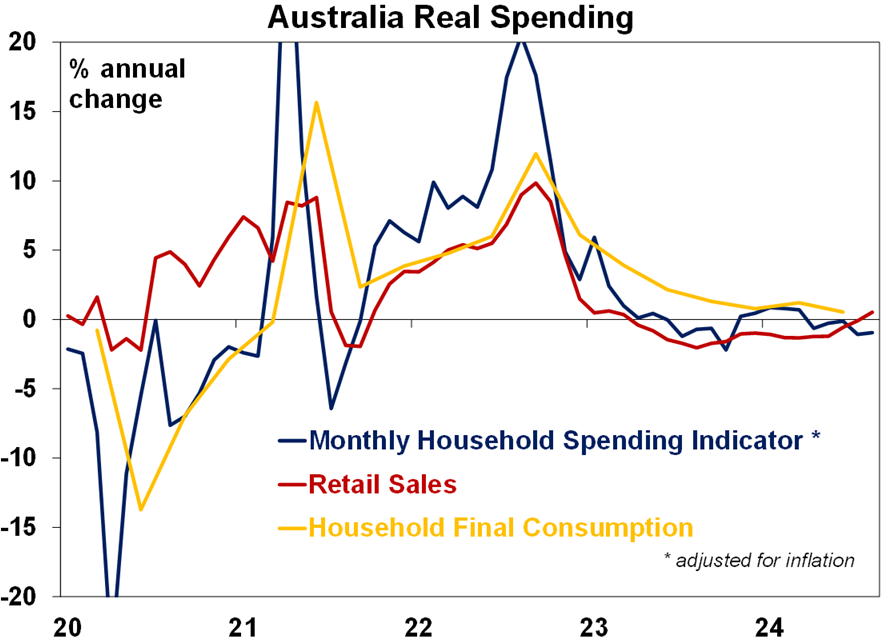
Despite the rise in retail sales, the ABS’s Monthly Household Spending Indicator was flat in August with annual growth slowing to 1.7%yoy, pointing to ongoing weakness in real consumer spending. Combined with a surge in household deposits in August it suggests that most of the tax cuts have been saved so far. Maybe we will need it to pay for higher petrol prices!
Source: ABS, AMP
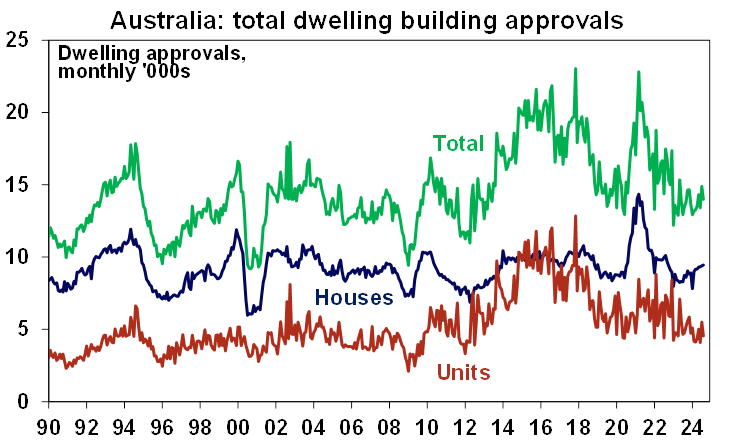
Home building approvals fell 6% due to volatile unit approvals. Abstracting from the monthly volatility, approvals are trending up but remain very low running around 170,000 pa, well below Gov commitments to build 240,000 homes a year & population driven demand for 245,000 homes. And so far, the rising trend is in houses whereas to speed up the supply of affordable dwellings we need to focus more on units.
Source: ABS, AMP
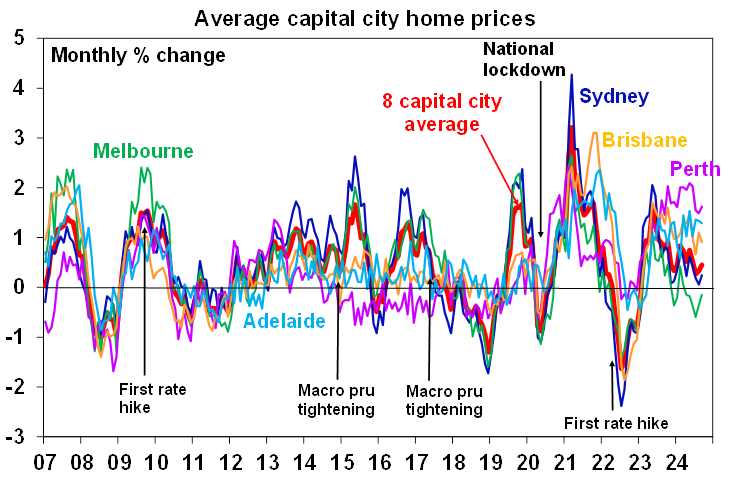
Home prices continued to rise in September according to CoreLogic, but the pace is modest and there is a big divergence between strength in Brisbane, Perth and Adelaide and weakness elsewhere. The fundamental housing shortfall remains but is being offset by poor affordability and high interest rates. Signs of softness are also evident in; subdued auction clearance rates; rising listings in excess of the normal seasonal rise; lower quartile and unit prices leading growth; and properties taking longer to sell. We expect a 5% average rise in prices this financial year but price growth could slow further in the near term ahead of stronger conditions next year after rates start to fall.
Source: ABS, AMP
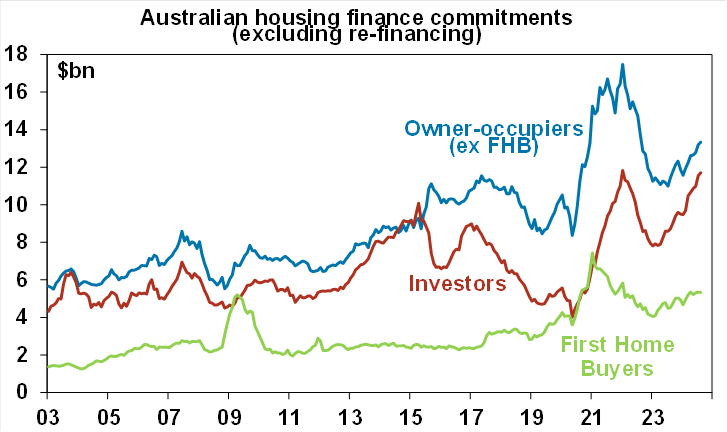
Housing finance and credit growth remained up from their lows but modest compared to the 2021 cyclical upswing. Concerningly though investor housing finance is near an all time high and at nearly 39% of the total is gradually pushing back to its 2015 high of 46%, whereas the share going to first home buyers is rolling over and is just 17.5%.
Source: ABS, AMP
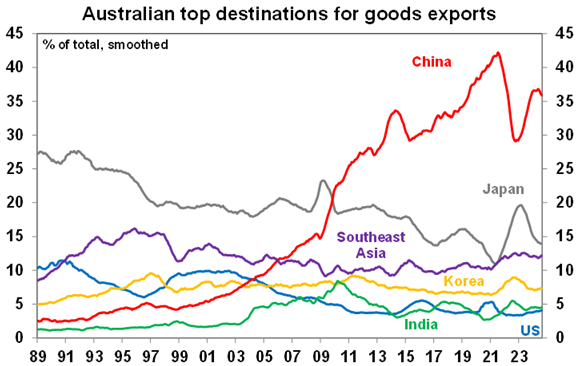
Australia’s trade surplus remained at $5.6bn in August with slight falls in both exports and imports. Iron ore exports are down from their highs but remain our biggest export earner and China’s share of our exports appears to be rolling over again.
Source: ABS, AMP
What to watch over the next week?
In the US, September CPI inflation (Thursday) is likely to show a further moderation to 2.3%yoy but with core inflation unchanged at 3.2%yoy. Small business optimism (Tuesday) is likely to have remained soft. The minutes from the Fed’s last meeting are likely to reiterate the Fed’s dovishness albeit with more gradual rate cuts than the money market is assuming.
The Reserve Bank of New Zealand is expected to cut by 0.5% taking its cash rate to 4.75% as it responds to poor economic conditions. Its outlook is likely to remain dovish.
In Australia, the minutes from the last RBA meeting and remarks by RBA Deputy Governor Hauser (Tuesday) are likely to reiterate the RBA’s relatively cautious stance on inflation and interest rates. RBA Chief Economist Sarah Hunter will also participate in a panel discussion on Thursday. The Westpac/MI consumer sentiment index for October is likely to have remained soft and the September NAB survey is likely to show a further slowing in business conditions and price pressures (both due Tuesday).
Outlook for investment markets
Easing inflation pressures, central banks cutting rates, China ramping up policy stimulus and prospects for stronger growth in 2025-26 should make for reasonable investment returns over the next 6-12 months. However, with a high risk of recession, poor valuations and significant geopolitical risks particularly around the Middle East and US election, the next 12 months are likely to be more constrained and rougher compared to 2023-24.
A recession is the main threat for shares, but its looking like our 8100 year-end target for the ASX 200 is too conservative.
Bonds are likely to provide returns around running yield or a bit more, as inflation slows, and central banks cut rates.
Unlisted commercial property returns are likely to remain negative due to the lagged impact of high bond yields and working from home reducing office space demand.
Australian home prices are likely to see more constrained gains over the next 12 months as the supply shortfall remains, but still high interest rates constrain demand and unemployment rises. Lower interest rates should help the market next year though and we see average property prices rising by around 5% in 2025.
Cash and bank deposits are expected to provide returns of over 4%, reflecting the back up in interest rates.
A rising trend in the $A is likely taking it to $US0.70 over the next 12 months, due to a fall in the overvalued $US and a narrowing in the interest rate differential between the Fed and the RBA. A recession is the main downside risk.

Weekly marketing update 29-11-2024
29 November 2024 | Blog Shares have been mixed over the last week with lots of noise around Trump including tariff posts, political uncertainty in France and another elevated inflation reading in the US, but mostly solid US economic data and news of a cease fire between Israel and Hezbollah. Read more
Weekly market update 22-11-2024
22 November 2024 | Blog Against a backdrop of geopolitical risk and noise, high valuations for shares and an eroding equity risk premium, there is positive momentum underpinning sharemarkets for now including the “goldilocks” economic backdrop, the global bank central cutting cycle, positive earnings growth and expectations of US fiscal spending. Read more
Oliver's insights - Trump challenges and constraints
19 November 2024 | Blog Why investors should expect a somewhat rougher ride, but it may not be as bad as feared with Donald Trump's US election victory. Read moreWhat you need to know
While every care has been taken in the preparation of this article, neither National Mutual Funds Management Ltd (ABN 32 006 787 720, AFSL 234652) (NMFM), AMP Limited ABN 49 079 354 519 nor any other member of the AMP Group (AMP) makes any representations or warranties as to the accuracy or completeness of any statement in it including, without limitation, any forecasts. Past performance is not a reliable indicator of future performance. This document has been prepared for the purpose of providing general information, without taking account of any particular investor’s objectives, financial situation or needs. An investor should, before making any investment decisions, consider the appropriateness of the information in this document, and seek professional advice, having regard to the investor’s objectives, financial situation and needs. This article is solely for the use of the party to whom it is provided and must not be provided to any other person or entity without the express written consent AMP. This article is not intended for distribution or use in any jurisdiction where it would be contrary to applicable laws, regulations or directives and does not constitute a recommendation, offer, solicitation or invitation to invest.
The information on this page was current on the date the page was published. For up-to-date information, we refer you to the relevant product disclosure statement, target market determination and product updates available at amp.com.au.