

Key points
- CoreLogic data showed national average home prices rose 0.8% in May, their strongest rise since last October.
- The housing market remains remarkably resilient with the housing shortage and still solid jobs market providing support, offsetting the downwards pressure on prices from high interest rates and poor sentiment towards housing.
- We expect home prices to rise around 5% this year as the supply shortfall continues to dominate, but the pushing out of rate cuts and the possibility of rate hikes along with the rising trend in unemployment pose a key downside risk.
- Home price gains are likely to remain widely divergent though with continued strength likely in Perth, Brisbane and Adelaide for now partly helped by interstate migration but softness in other cities, particularly Melbourne and Hobart.
Introduction
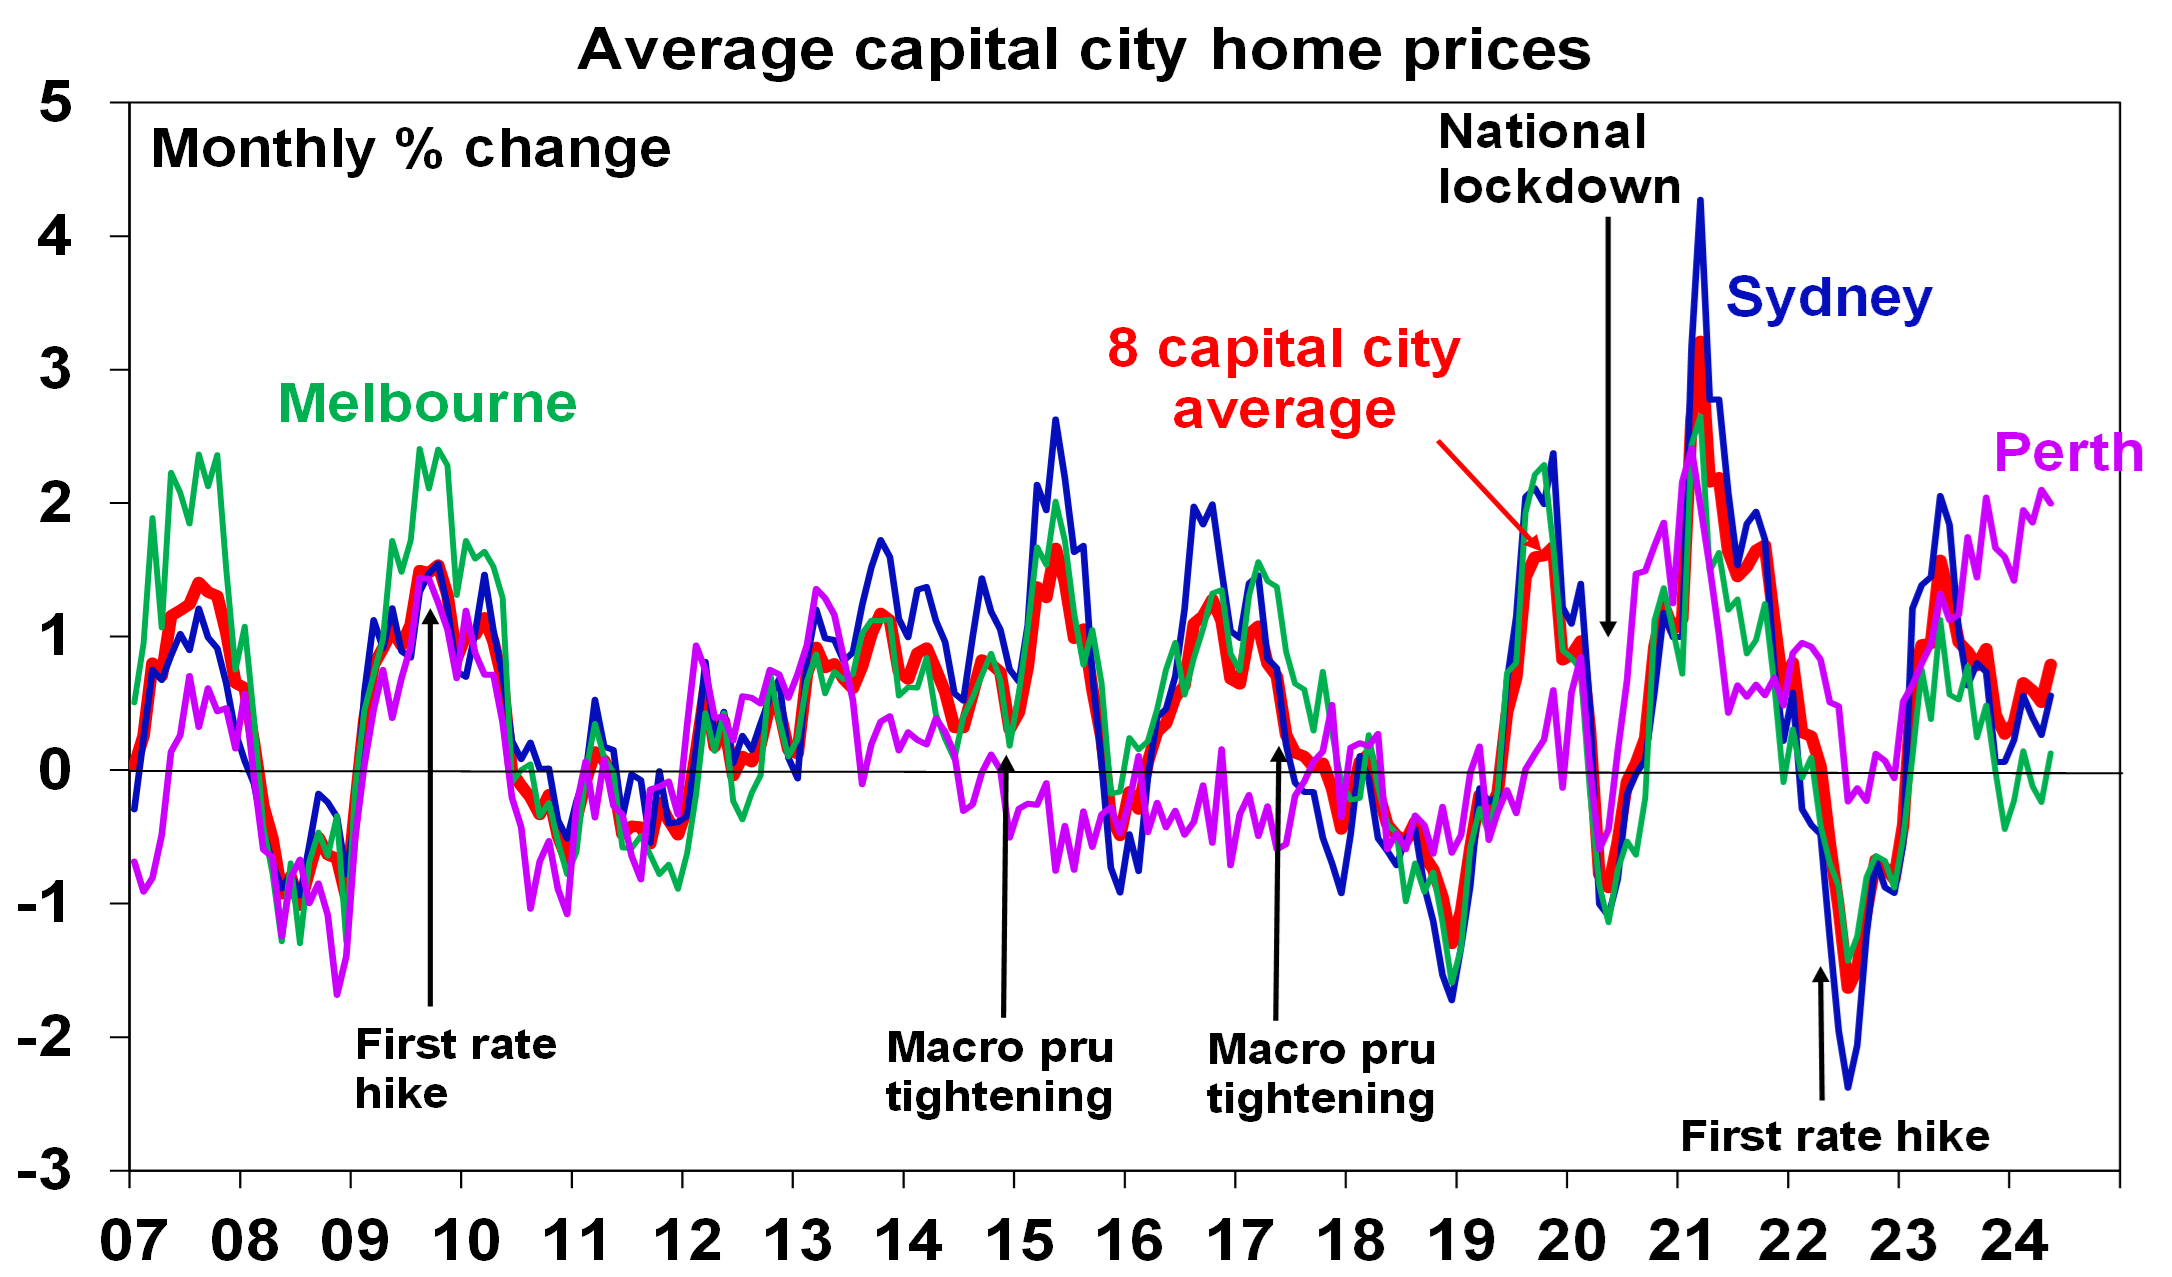
National average home prices rose another 0.8% in May, pushing them further into record territory. However, the gains remain highly diverse. Conditions in Perth, Brisbane and Adelaide continue to be very strong, helped by relatively lower levels of supply evident in total listings running more than 30% below their five-year averages, and strong interstate migration in the case of Brisbane and Perth. But this contrasts with far more constrained conditions elsewhere. Sydney has made it back to its record high but only just and the other capitals remain well below their record highs. Melbourne and Hobart are seeing total listings well above their five-year average.
Australian dwelling price growth
| May % change | Annual % change | % change from peak | |
| Sydney | 0.6 | 7.4 | -0.0 |
| Melbourne | 0.1 | 1.8 | -4.0 |
| Brisbane | 1.4 | 16.3 | At record high |
| Adelaide | 1.8 | 14.4 | At record high |
| Perth | 2.0 | 22.0 | At record high |
| Hobart | -0.5 | -0.1 | -11.5 |
| Darwin | -0.3 | 3.5 | -5.3 |
| Capital city avg | 0.8 | 8.8 | At record high |
| Regional average | 0.6 | 6.8 | At record high |
| National average | 0.8 | 8.3 | At record high |
Source: CoreLogic, AMP
After overtaking Melbourne median property values in January, Brisbane has now overtaken Canberra to have the second highest median property values amongst Australian capital cities. Sydney remains at the top. Of course, the surge in prices in Brisbane, Adelaide and Perth will in time worsen their attractiveness for interstate migration eventually leading to slower property price growth in those cities.
Source: CoreLogic, AMP
The chronic housing shortage continues
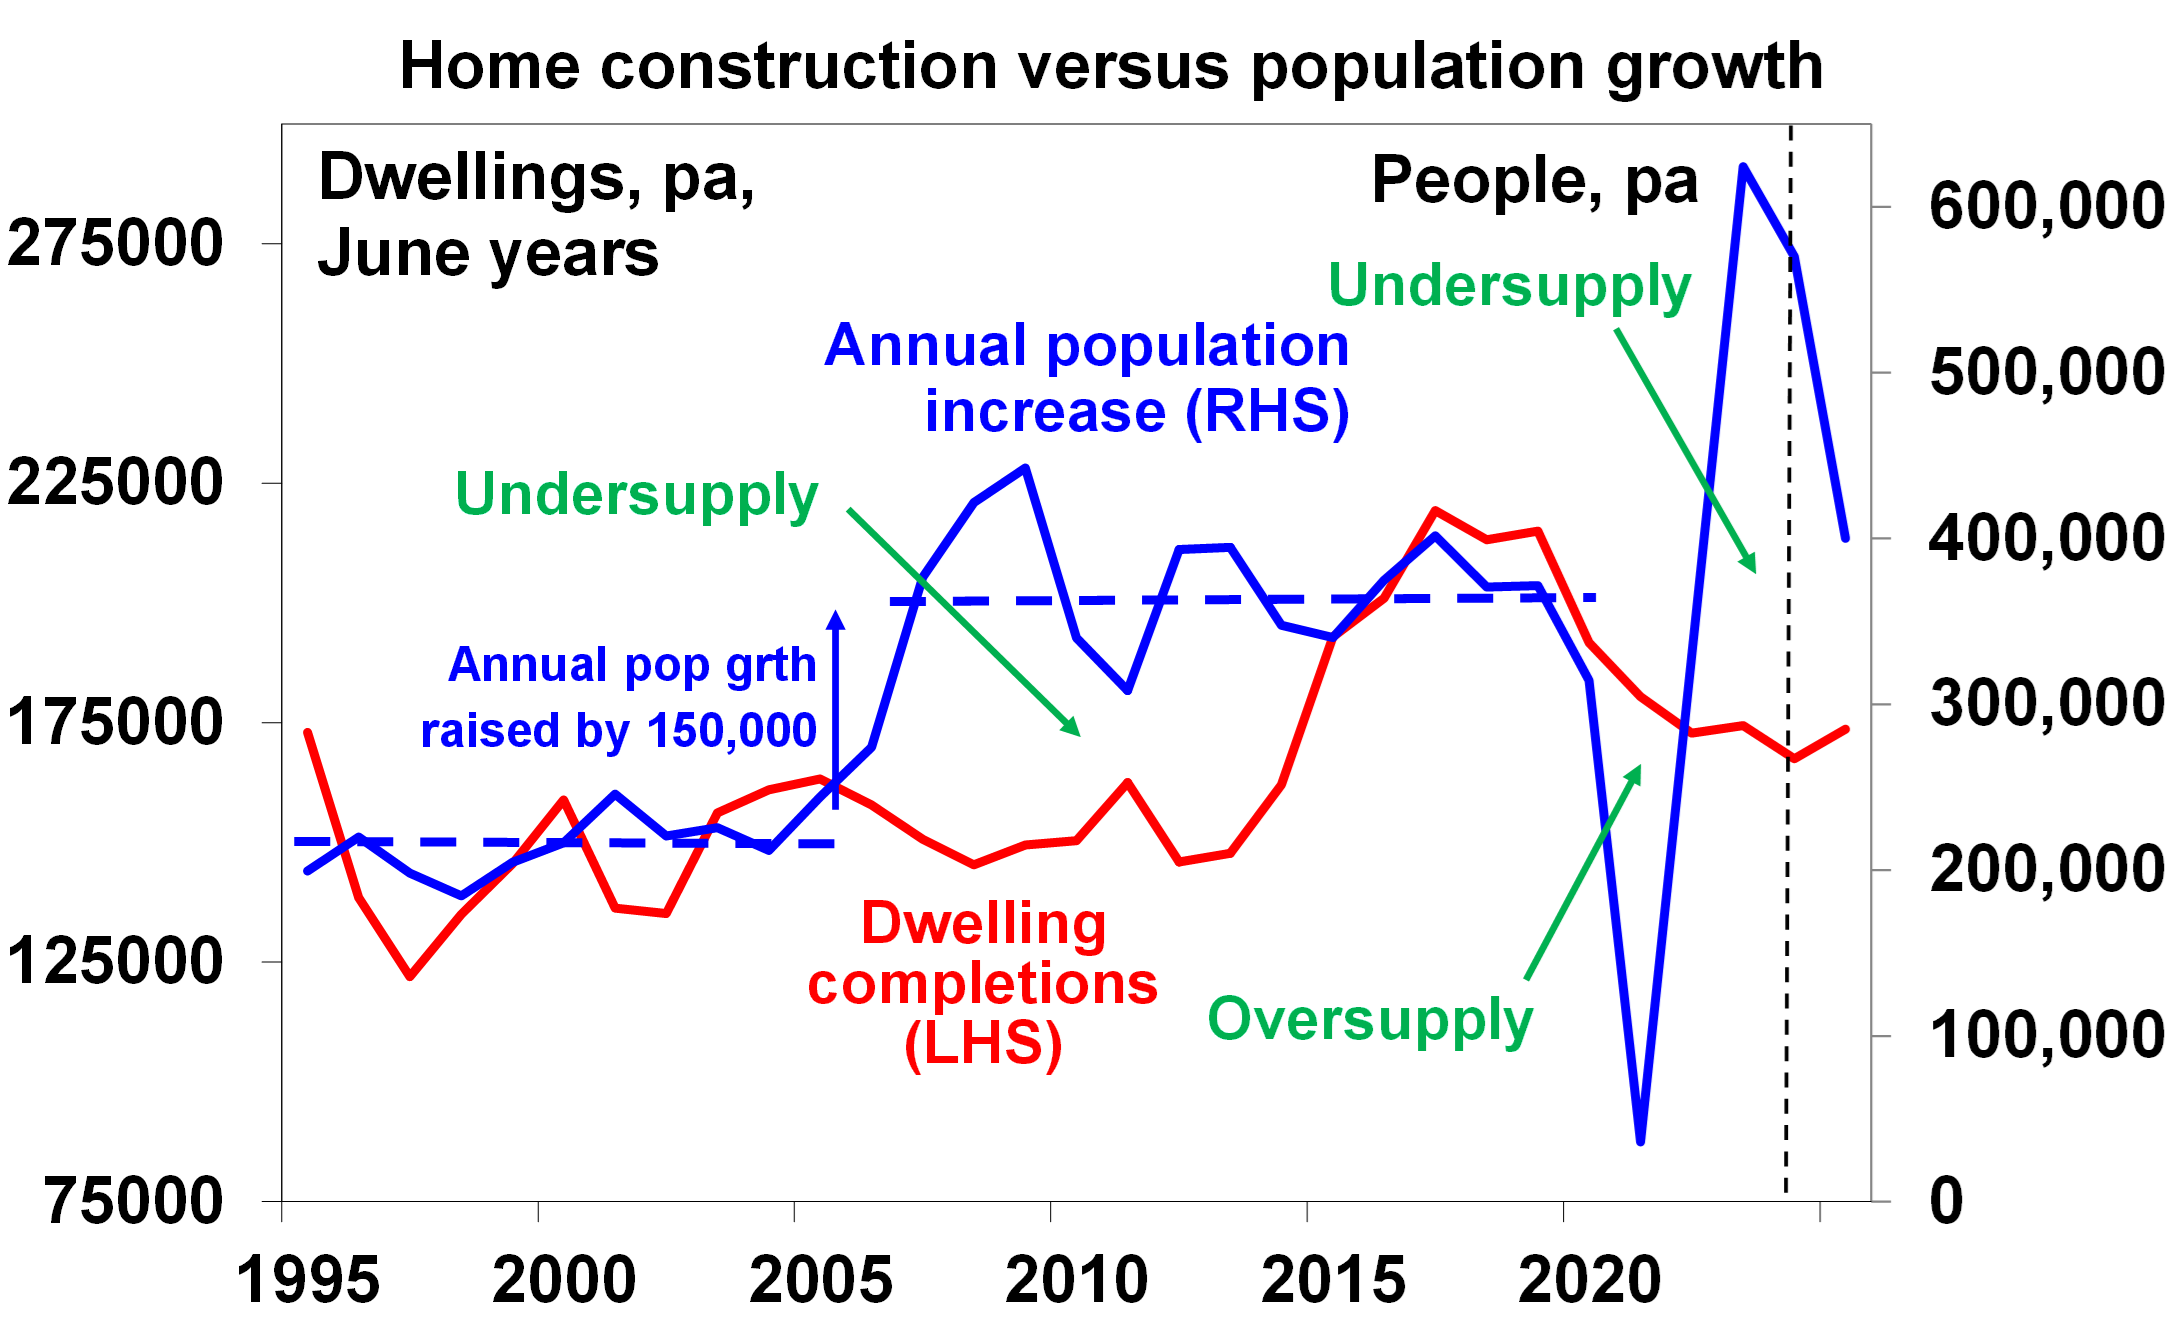
The property market remains caught between the extreme housing shortage and high interest rates, with the former continuing to dominate. The chronic housing shortage got the upper hand over high interest rates last year as immigration levels surged and continues to be the main driver of rising property prices. Put simply, the surge in population growth to a record 660,000 over the year to the September quarter last year driven by record immigration levels meant that around an extra 250,000 new homes needed to be built, but instead completions have been running around 170,000 as the home building industry struggles to keep up with rising costs and material and labour shortages and as approvals to build new homes fell.
Source: ABS, AMP
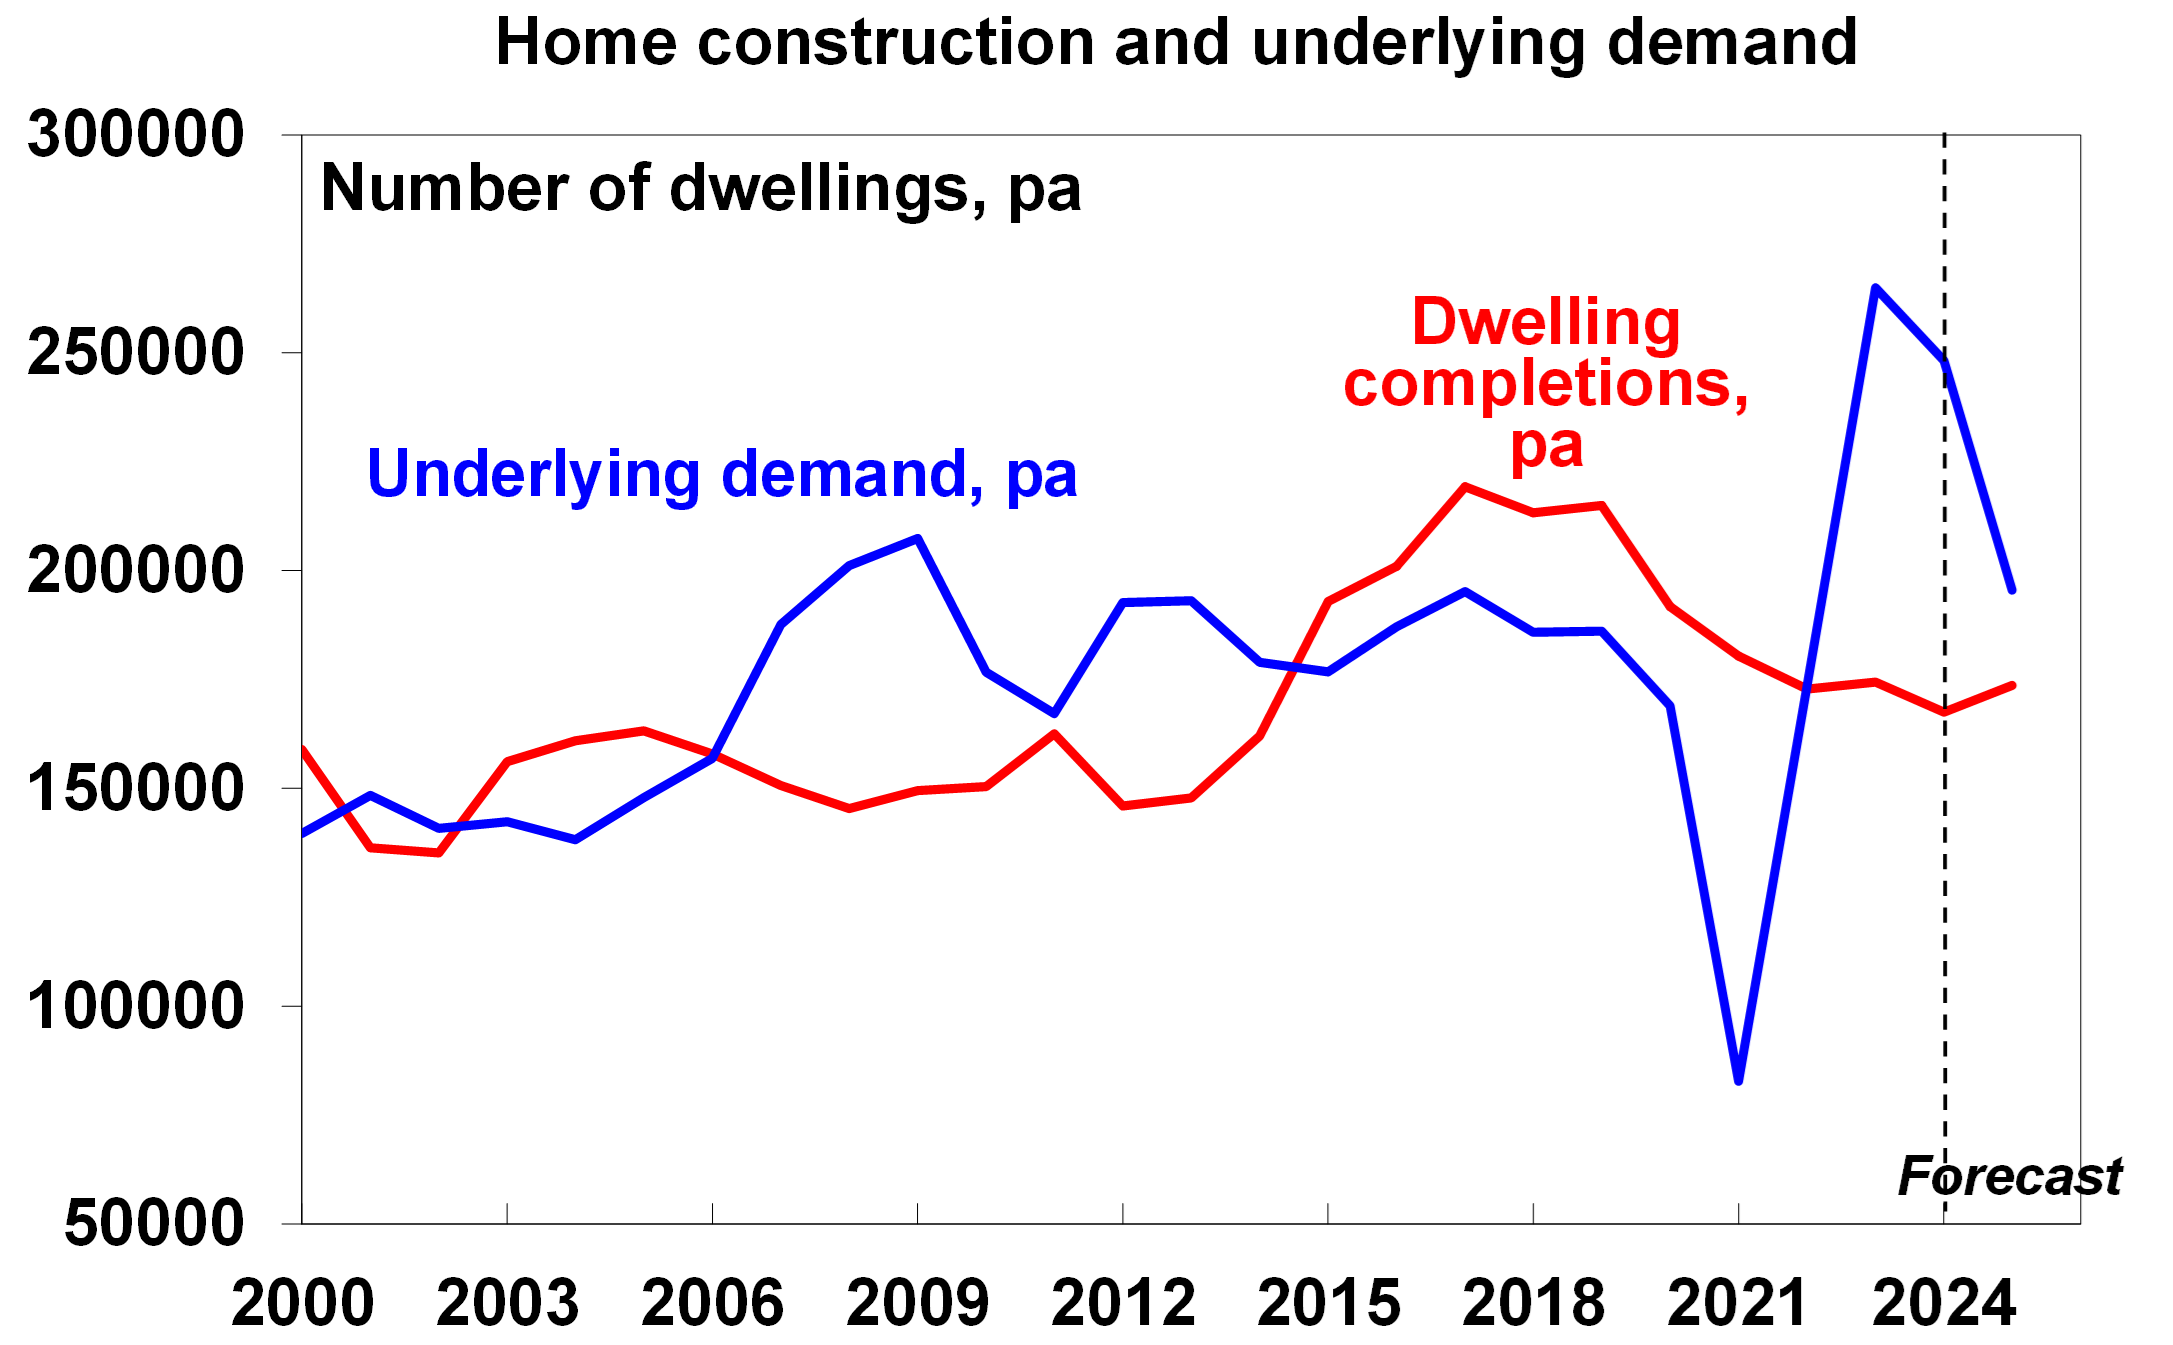
So underlying demand for housing (the blue line in the next chart) has been very high over the last two years relative to housing completions (the red line) resulting in an annual shortfall of around 90,000 dwellings in 2022-23 and another 80,000 dwellings this financial year (ie, the gap between the blue and red lines).
Source: ABS, AMP
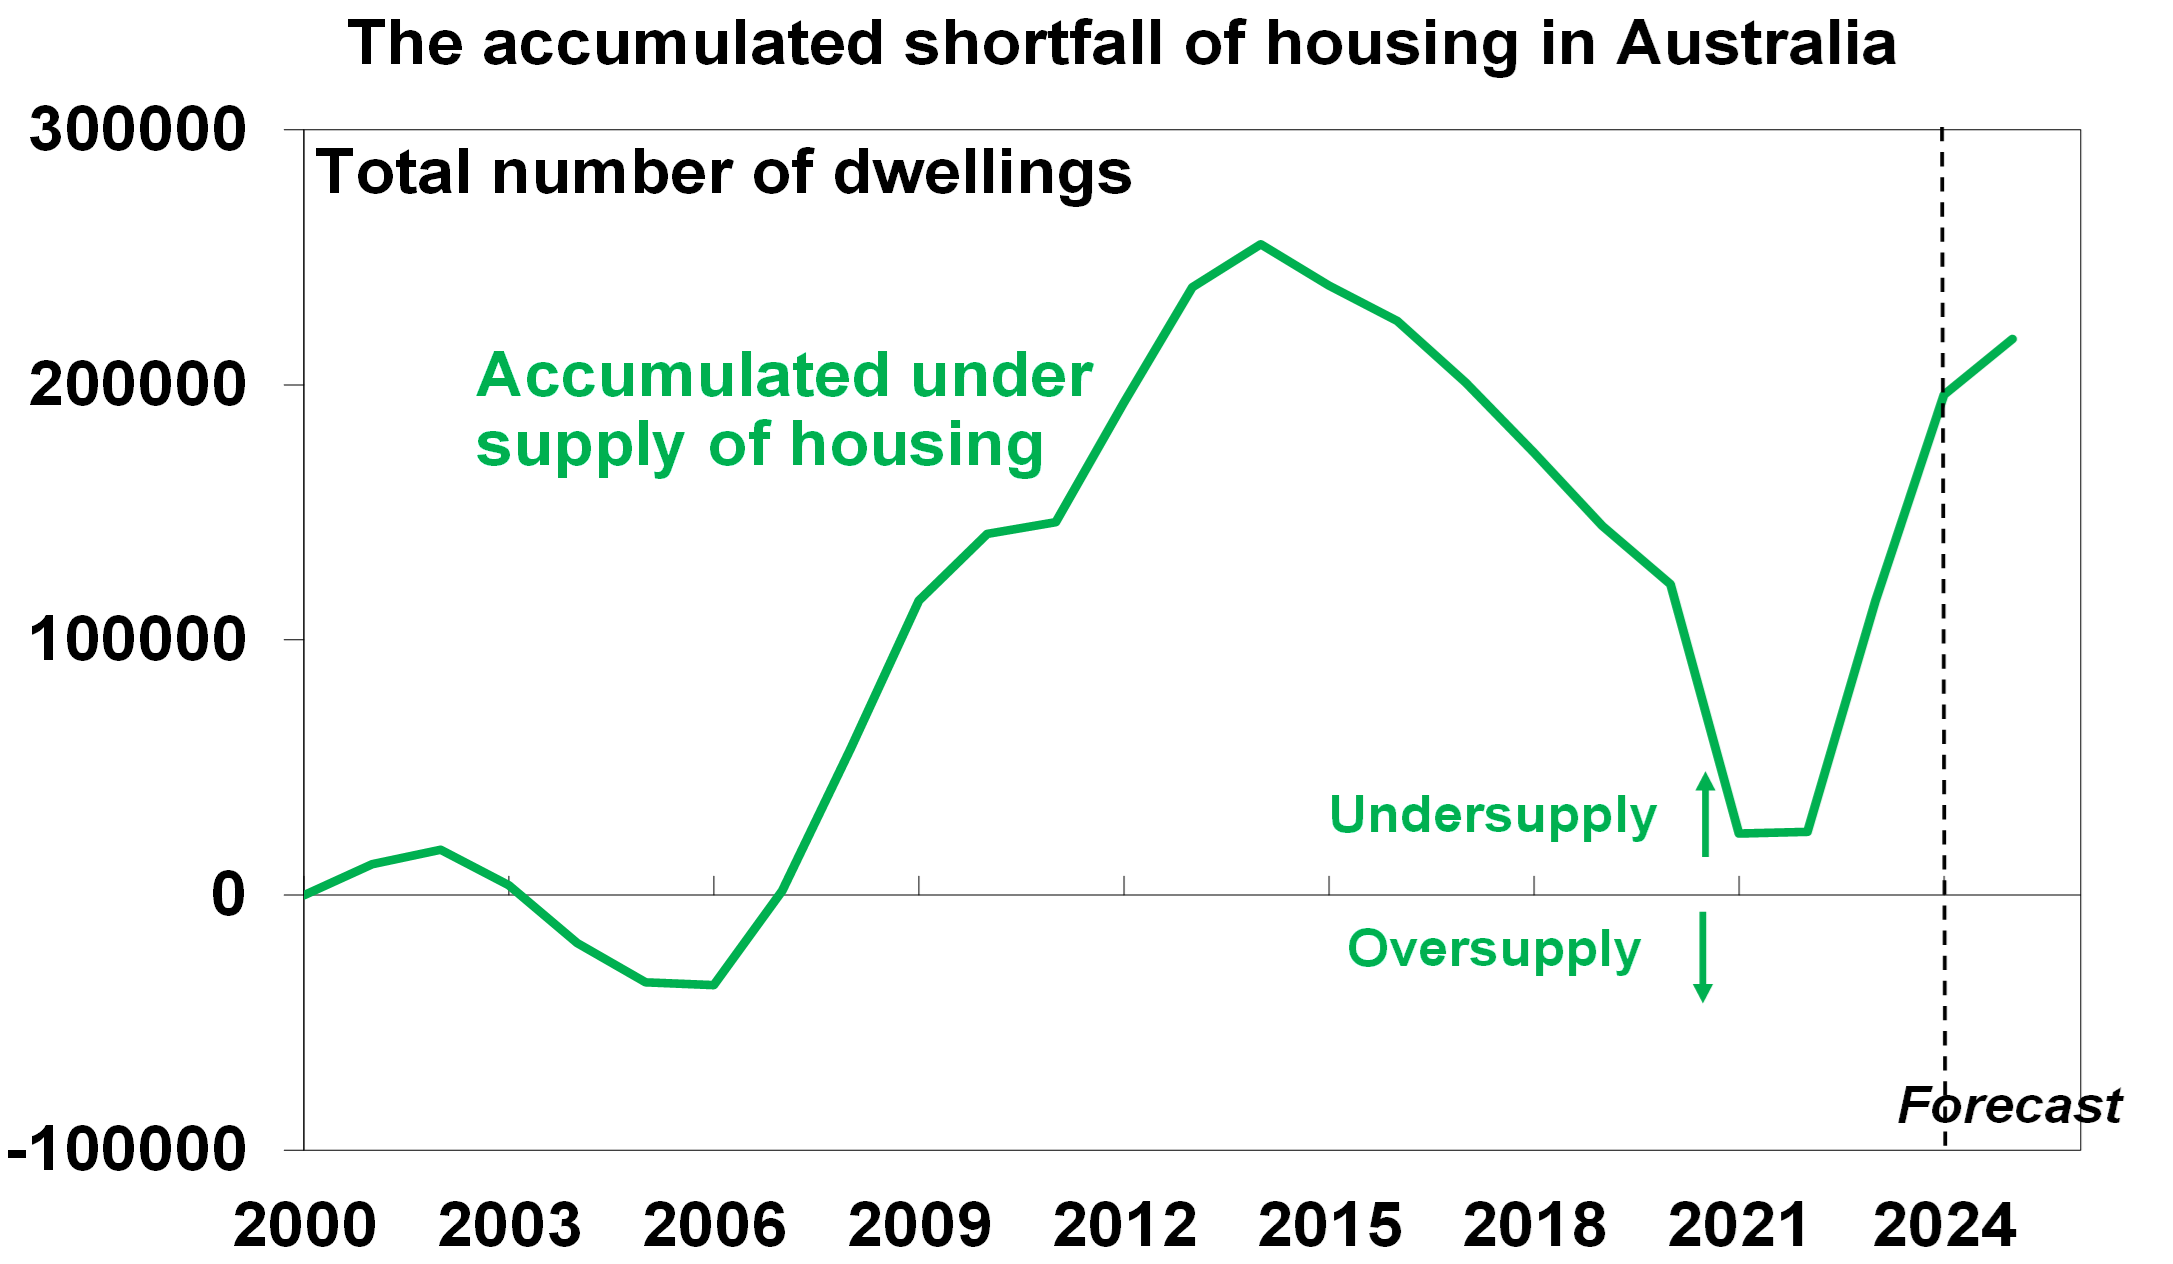
This is estimated to see the accumulated housing shortfall rise to around 200,000 dwellings by the end of this month. See the next chart. This is a conservative estimate – if the decline in the average number of people per household seen in the last few years is sustained then the accumulated shortfall could be around 300,000 dwellings. Which would be well above where we were before the unit building boom got underway around 2015.
Source: ABS, AMP
Unfortunately, the housing shortfall looks like it will get worse before it gets better. Immigration levels are likely to slow over the year ahead but still remain high and housing construction is likely to remain depressed in the face of cost pressures and capacity constraints. In fact, approvals are now running around 160,000 new dwellings a year, which is well below government objectives to be building 240,000 dwellings a year over the five years from July.
At the same time, access to “the bank of mum and dad” and savings buffers built up through the pandemic appear to have protected the property market from high rates over the last two years. Anecdotes suggest that all cash purchases and access to “the bank of mum and dad” reached a record last year.
But there is now a high and widening gap between home prices and the capacity to pay
The big negative influence on the property market remains poor and still worsening affordability and high mortgage stress on the back of high prices, high debt levels and high mortgage rates. For decades ever rising property prices relative to incomes were made possible by ever lower interest rates. But due to the rebound in interest rates from May 2022 and national average home prices on the rise again there is now a wide divergence between buyers’ capacity to pay for property and current home prices – with the capacity to pay down by 27% on our estimates since April 2022. See the next chart. In the absence of rapid interest rate cuts this continues to point to a high risk of lower property prices at some point. This is reinforced by ultra-low sentiment towards property. A sharp rise in unemployment in response to weak spending in the economy would add to the downside risks flowing to property prices from high mortgage rates.
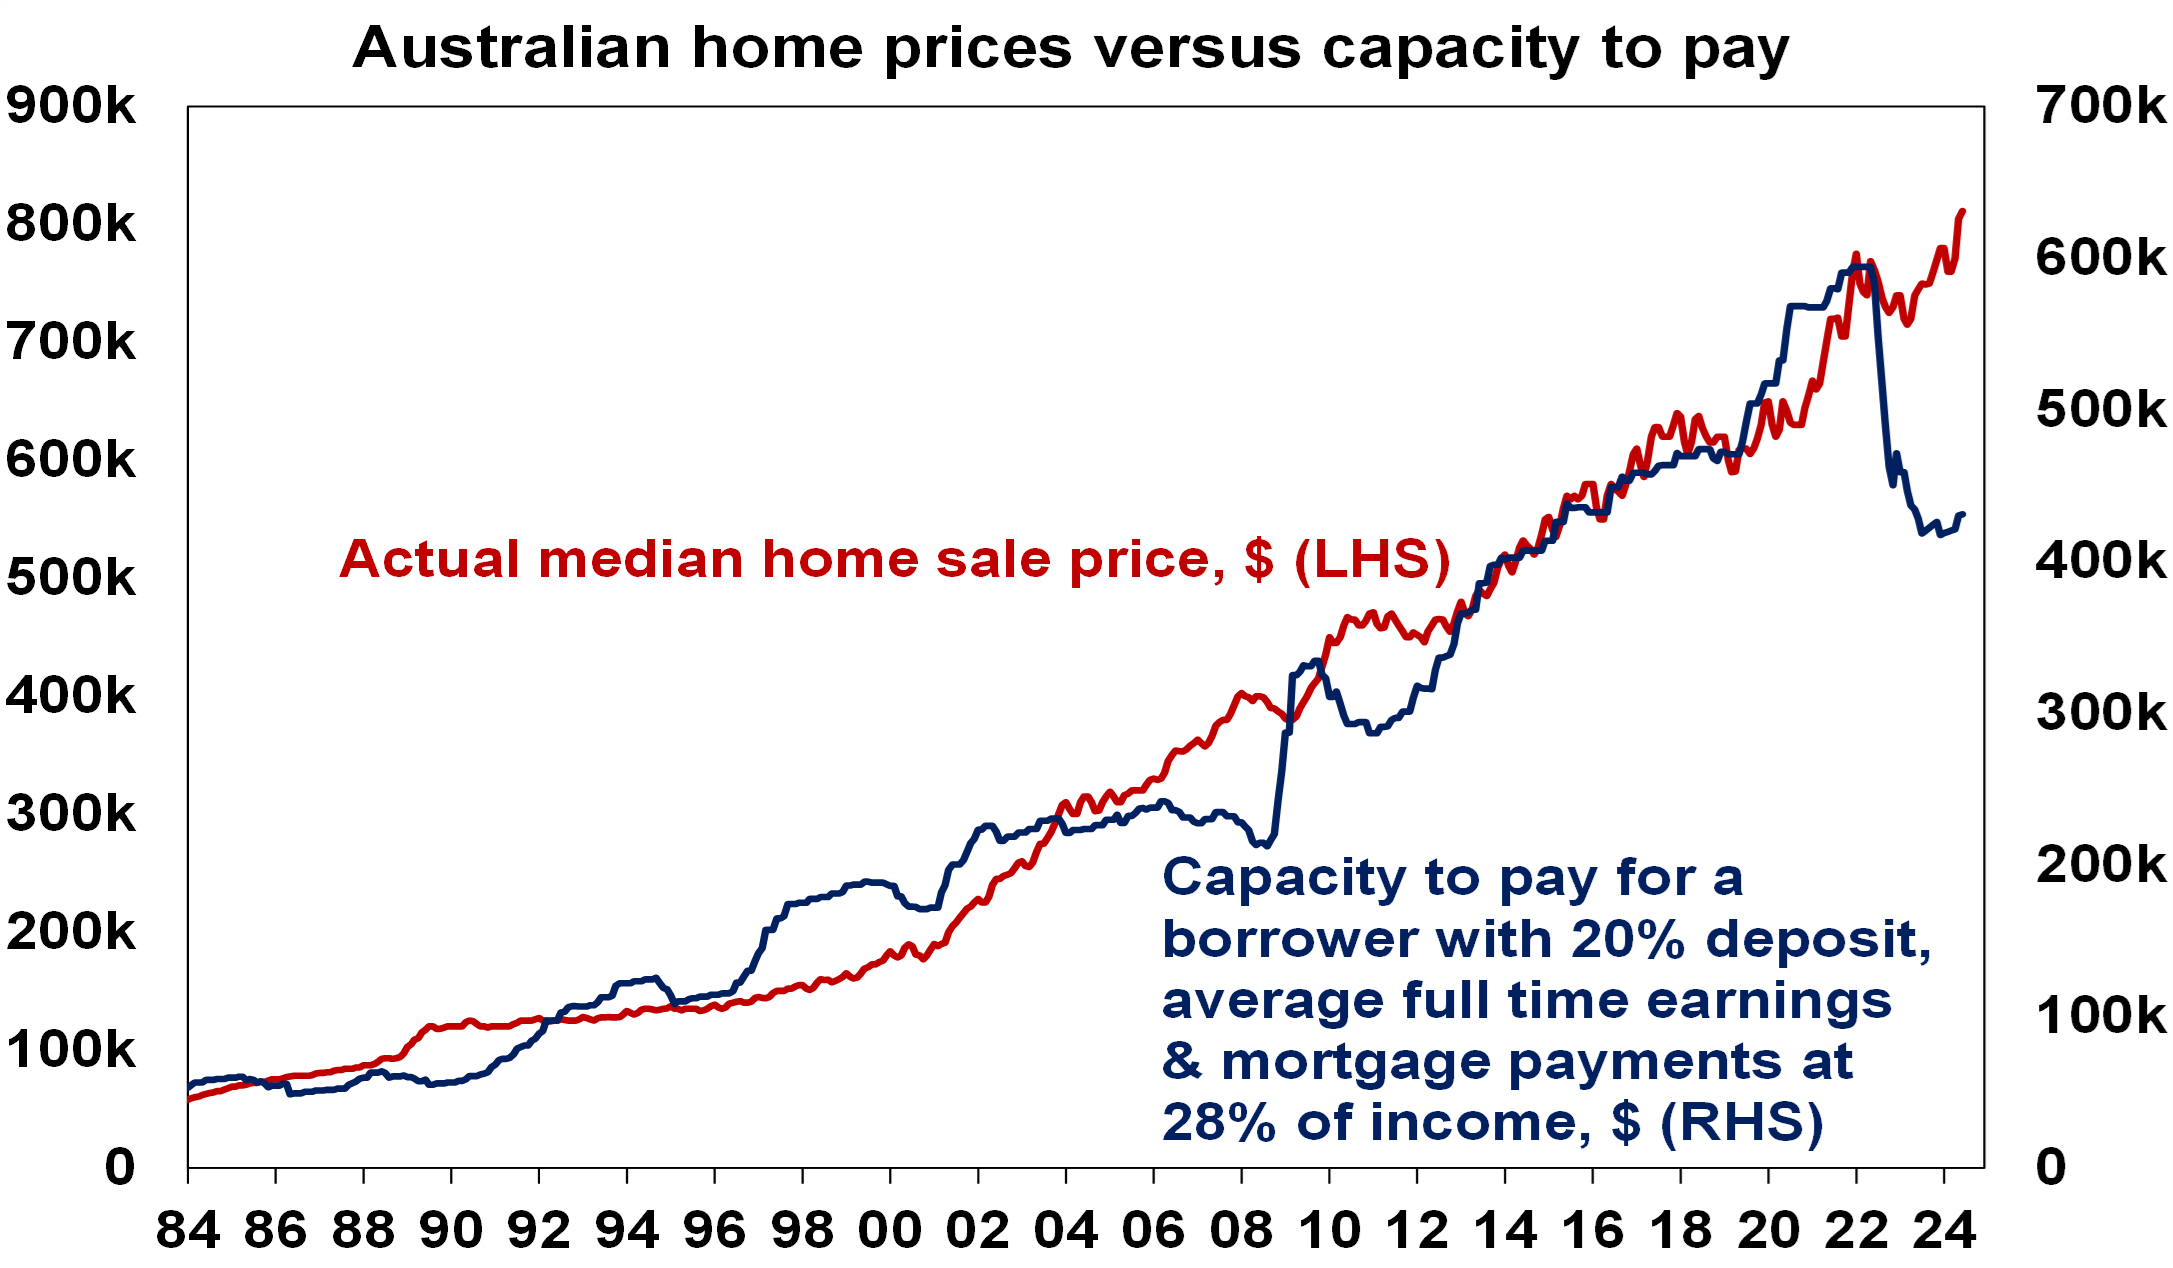
Source: RBA, CoreLogic, AMP
Outlook
However, for now the supply short fall continues to dominate. So, after an average 8% gain last year, we expect that national average home prices will rise again this year but with national average gains a bit more constrained at 5% as still high interest rates act to restrict demand and rising unemployment boosts distressed listings. The supply shortfall points to upside risk, but the delay in rate cuts and talk of rate hikes risks renewed falls in property prices as it’s likely to cause buyers to hold back and distressed listings to rise.
Home price gains are likely to remain widely divergent though with continued strength likely in Perth, Brisbane and Adelaide for now partly helped by interstate migration but softness in other cities, particularly Melbourne and Hobart.
Some signs of softening
Interestingly, there are some signs of a softening at the margin: auction clearance rates have cooled from their highs; new listings are up sharply in some cities possibly reflecting rising distressed listings; and after leading early in the property upswing, top quartile property price gains are the weakest in most capital cities as affordability and borrowing constraints are starting to bite pushing buyers into lower-priced property.
Source: Domain, CoreLogic, AMP

Weekly market update 28-06-2024
28 June 2024 | Blog Dr Shane Oliver observes strong financial year returns - but can it continue?; Trump odds up after debate - watch trade war risks; risk of another RBA hike up but not fait accompli; Australian jobs market cooling; another big Australian budget surplus and more. Read more
Oliver's insights - investing 40 years
25 June 2024 | Blog Dr Shane Oliver shaes his nine most important lessons from investing over the past 40 years. Read more
Weekly market update 21-06-2024
21 June 2024 | Blog This week, narrowing US share gains; drip feed of falling global inflation & rates is good sign for RBA; Federal & state governments making the RBA's job harder; the pros & cons of nuclear; and more. Read moreWhat you need to know
While every care has been taken in the preparation of this article, neither National Mutual Funds Management Ltd (ABN 32 006 787 720, AFSL 234652) (NMFM), AMP Limited ABN 49 079 354 519 nor any other member of the AMP Group (AMP) makes any representations or warranties as to the accuracy or completeness of any statement in it including, without limitation, any forecasts. Past performance is not a reliable indicator of future performance. This document has been prepared for the purpose of providing general information, without taking account of any particular investor’s objectives, financial situation or needs. An investor should, before making any investment decisions, consider the appropriateness of the information in this document, and seek professional advice, having regard to the investor’s objectives, financial situation and needs. This article is solely for the use of the party to whom it is provided and must not be provided to any other person or entity without the express written consent AMP. This article is not intended for distribution or use in any jurisdiction where it would be contrary to applicable laws, regulations or directives and does not constitute a recommendation, offer, solicitation or invitation to invest.
The information on this page was current on the date the page was published. For up-to-date information, we refer you to the relevant product disclosure statement, target market determination and product updates available at amp.com.au.