


Key points
- A rise in the US unemployment rate and the trigger of the economic concept known as the “Sahm rule” is causing concern that the US is heading into a recession.
- The US labour market has been weakening for some months. The forward-looking employment indicators point to softer jobs growth, but not a collapse in employment.
- The risk of a US recession is high at 50% in the next 12 months but a recession is not a certainty. The US Federal Reserve is expected to start cutting interest rates in September which should help economic conditions.
Introduction
There is currently a lot of concern around the state of the US labour market. We go through these issues in this edition of Econosights.
First, some background
The US labour market was in a very strong position in the post-pandemic years of 2022-2023. The unemployment rate fell to 3.4%, its lowest level since the late 1960s and not too far away from an all-time record low of 2.5% (in the 1950s) – see the chart below. The participation rate (the share of people aged over 50 in the labour market) never fully recovered back to its pre-COVID average of around 63.5% as many older workers permanently left the labour force for retirement.
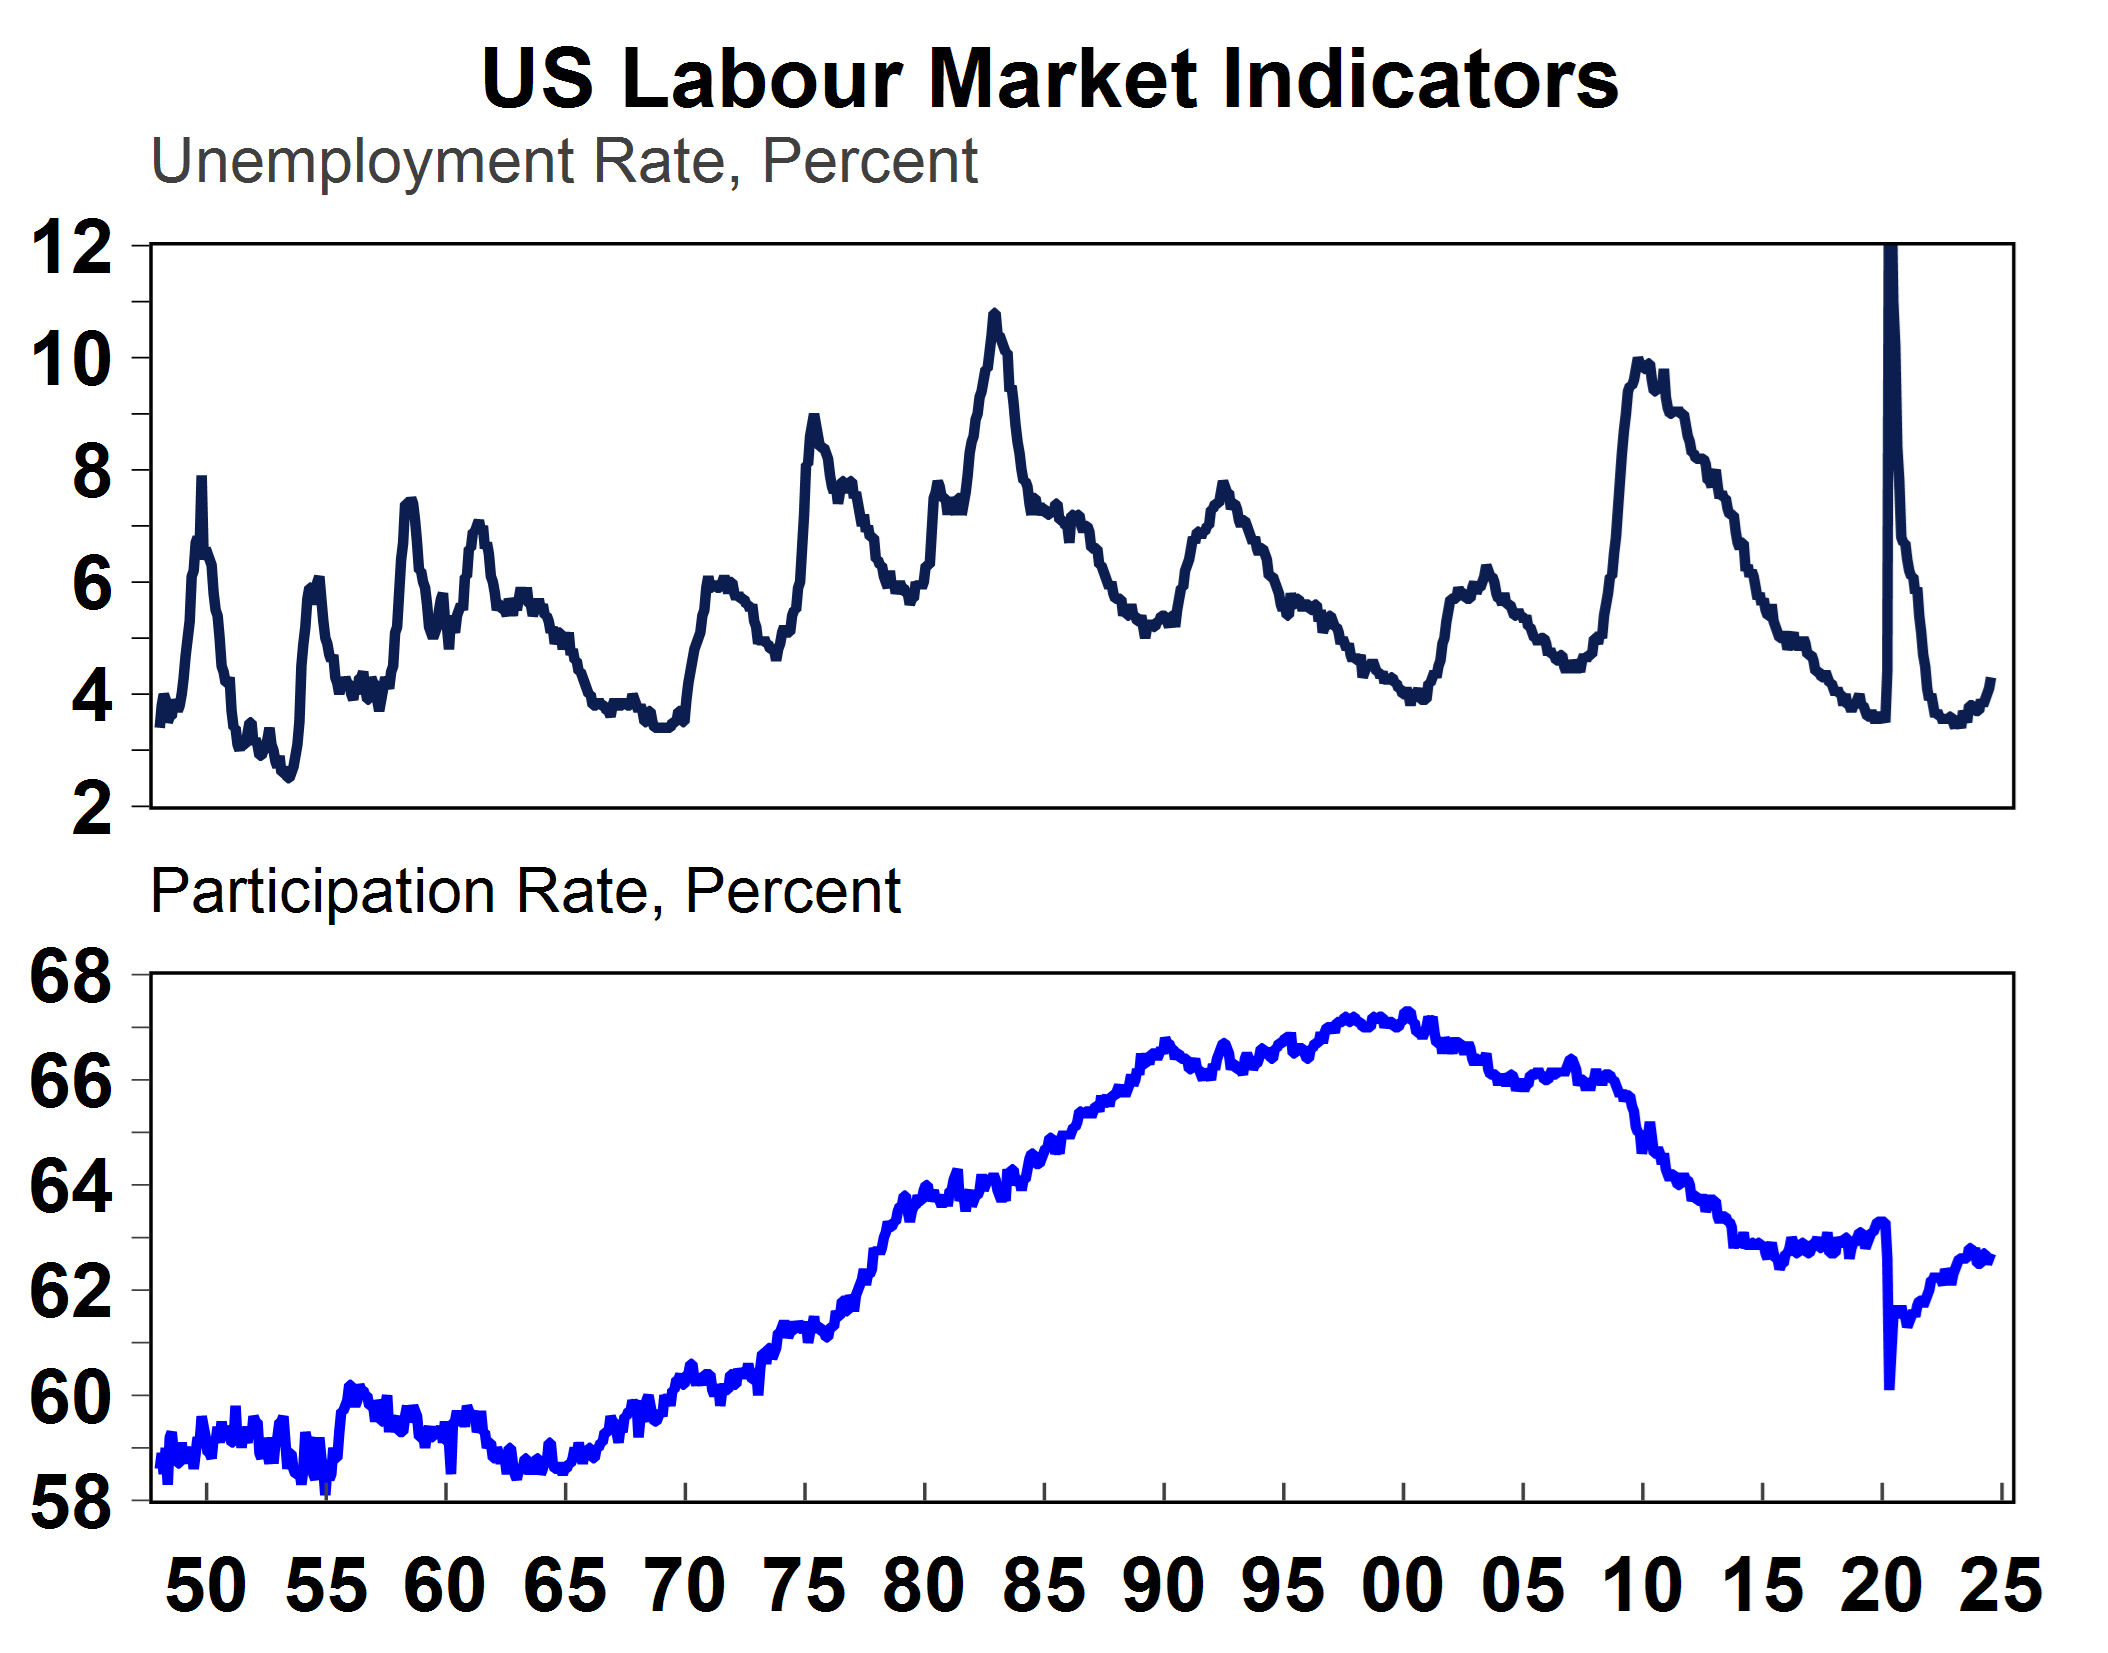
Source: Macrobond, BLS, AMP
Wages growth soared to 5.9% per annum at its peak (according to average hourly earnings). Labour demand (the sum of job vacancies and employment) was well above the supply of labour (the number of people in the labour force), otherwise known as a “positive jobs gap”. This situation is uncommon in the US labour market. The chart below looks at the US jobs gap since the early 2000s. Since this particular data set started, the jobs gap has never been as positive as it was in this current cycle, which explains why wages growth increased significantly. The jobs gap is now declining back to its pre-COVID norm, as job vacancies have fallen and employment growth has slowed. However, it is still positive which means that there is still excess demand in the labour market.
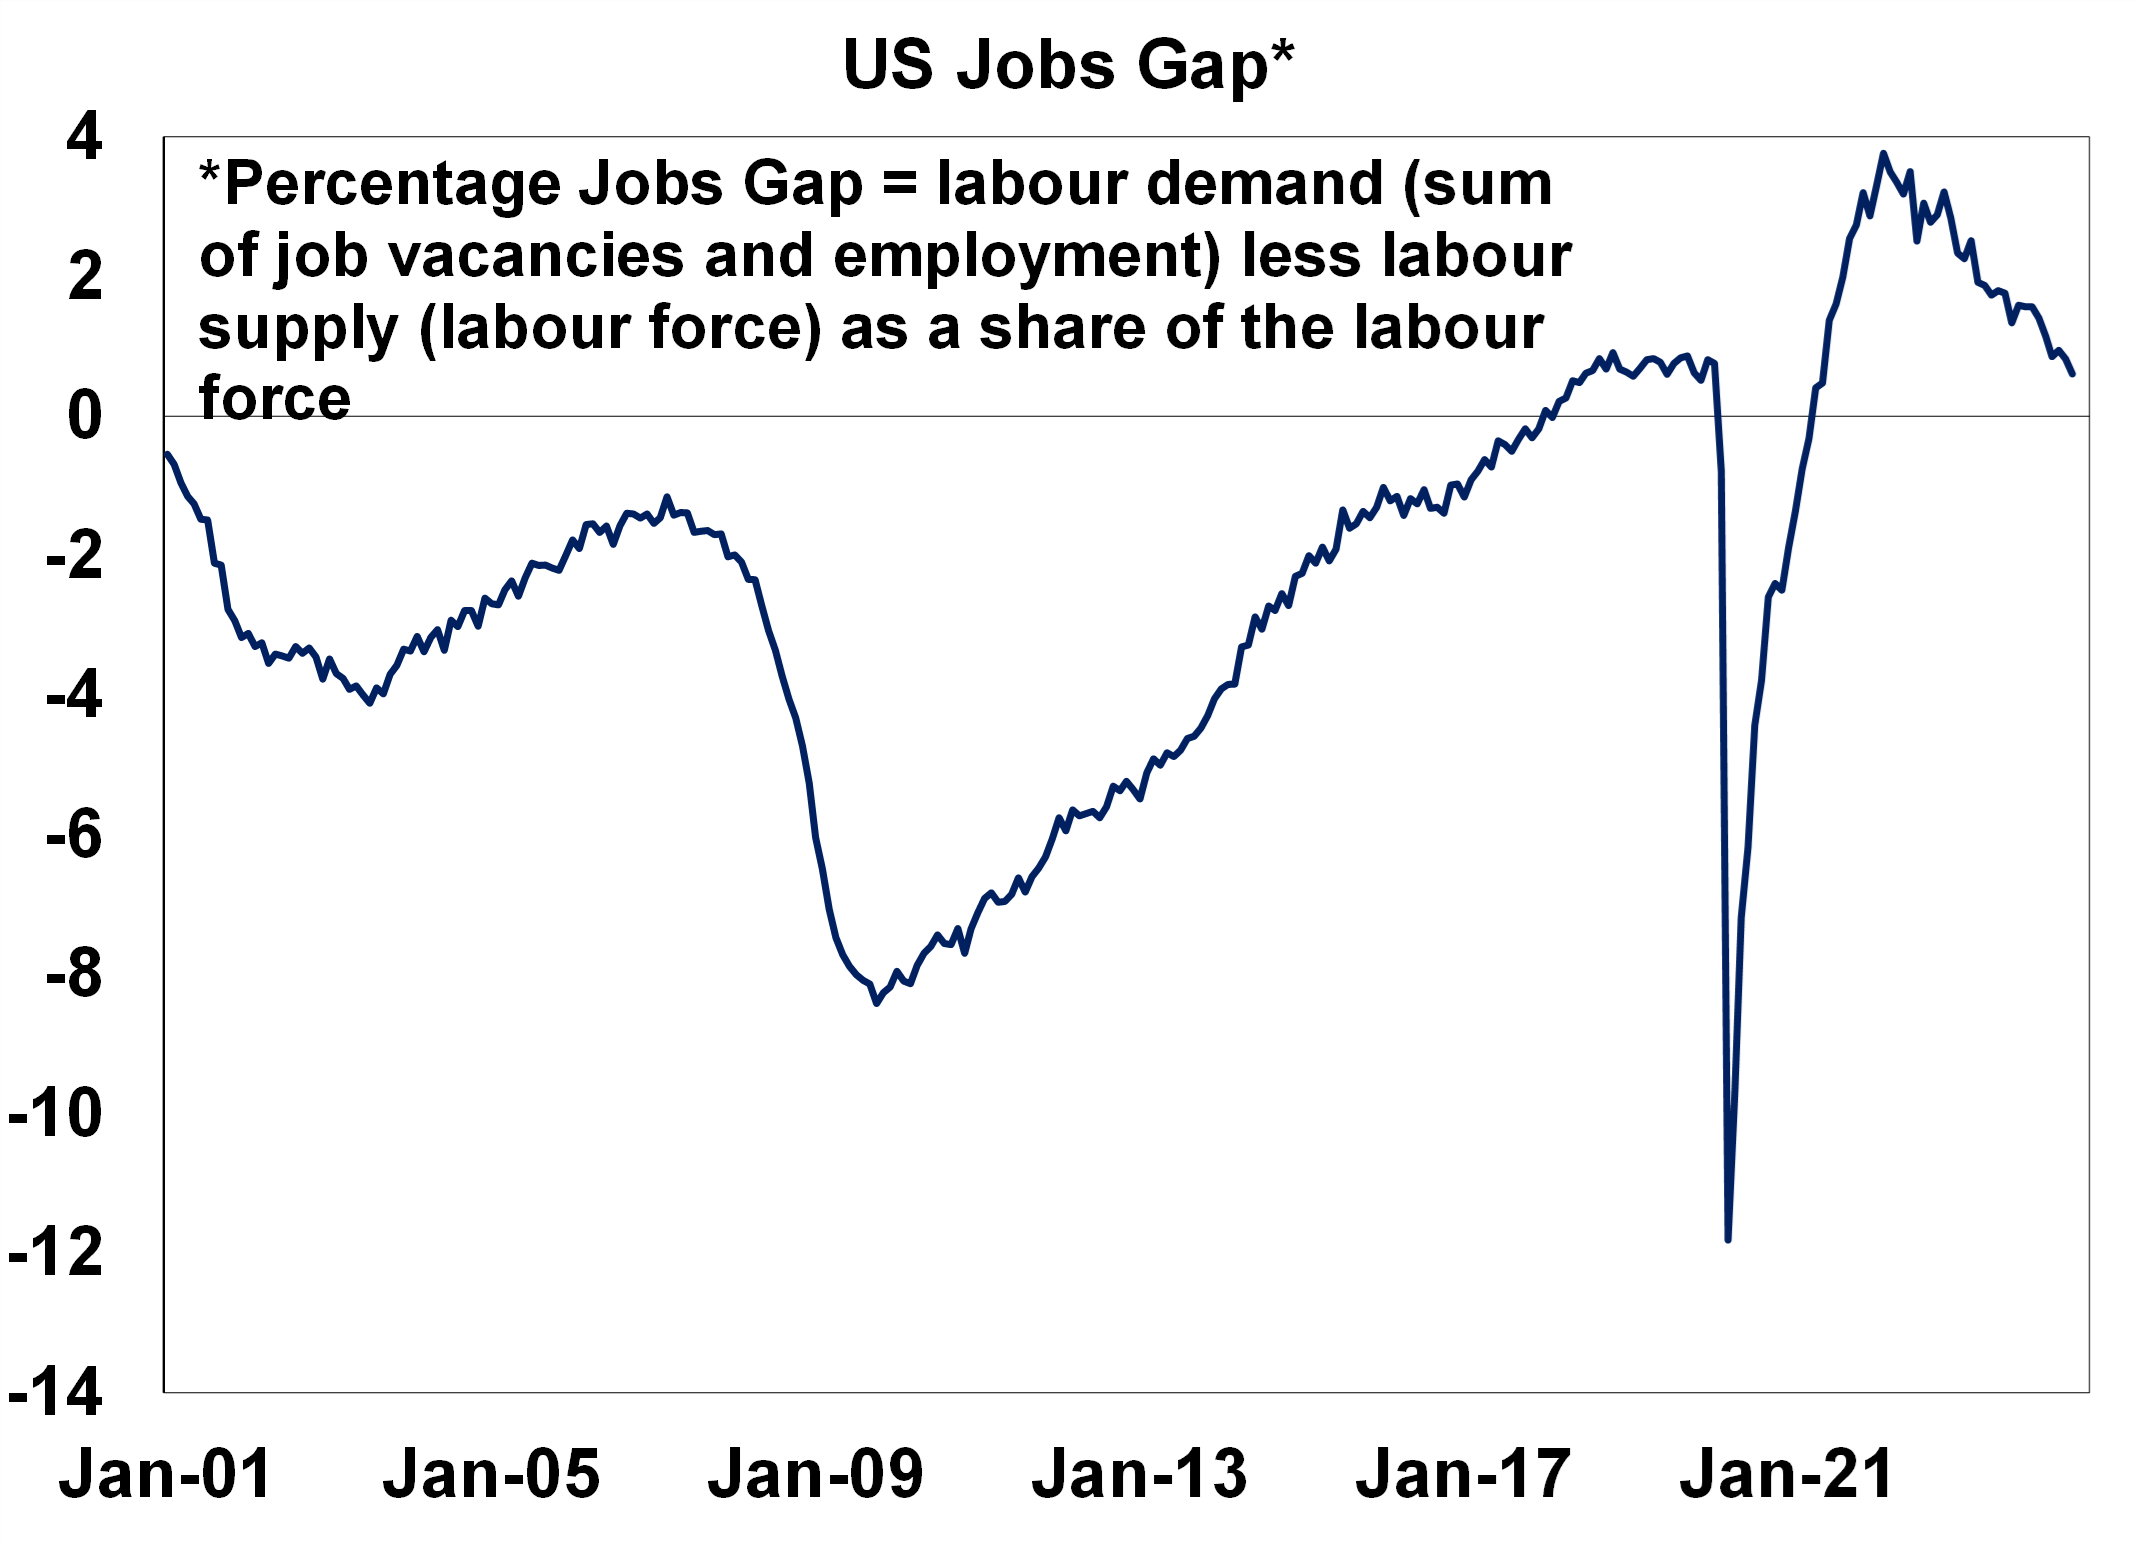
Source: Bloomberg, AMP
Over the past year, job gains have been strongest in education and health, government, hospitality, construction and transportation (see the chart below).
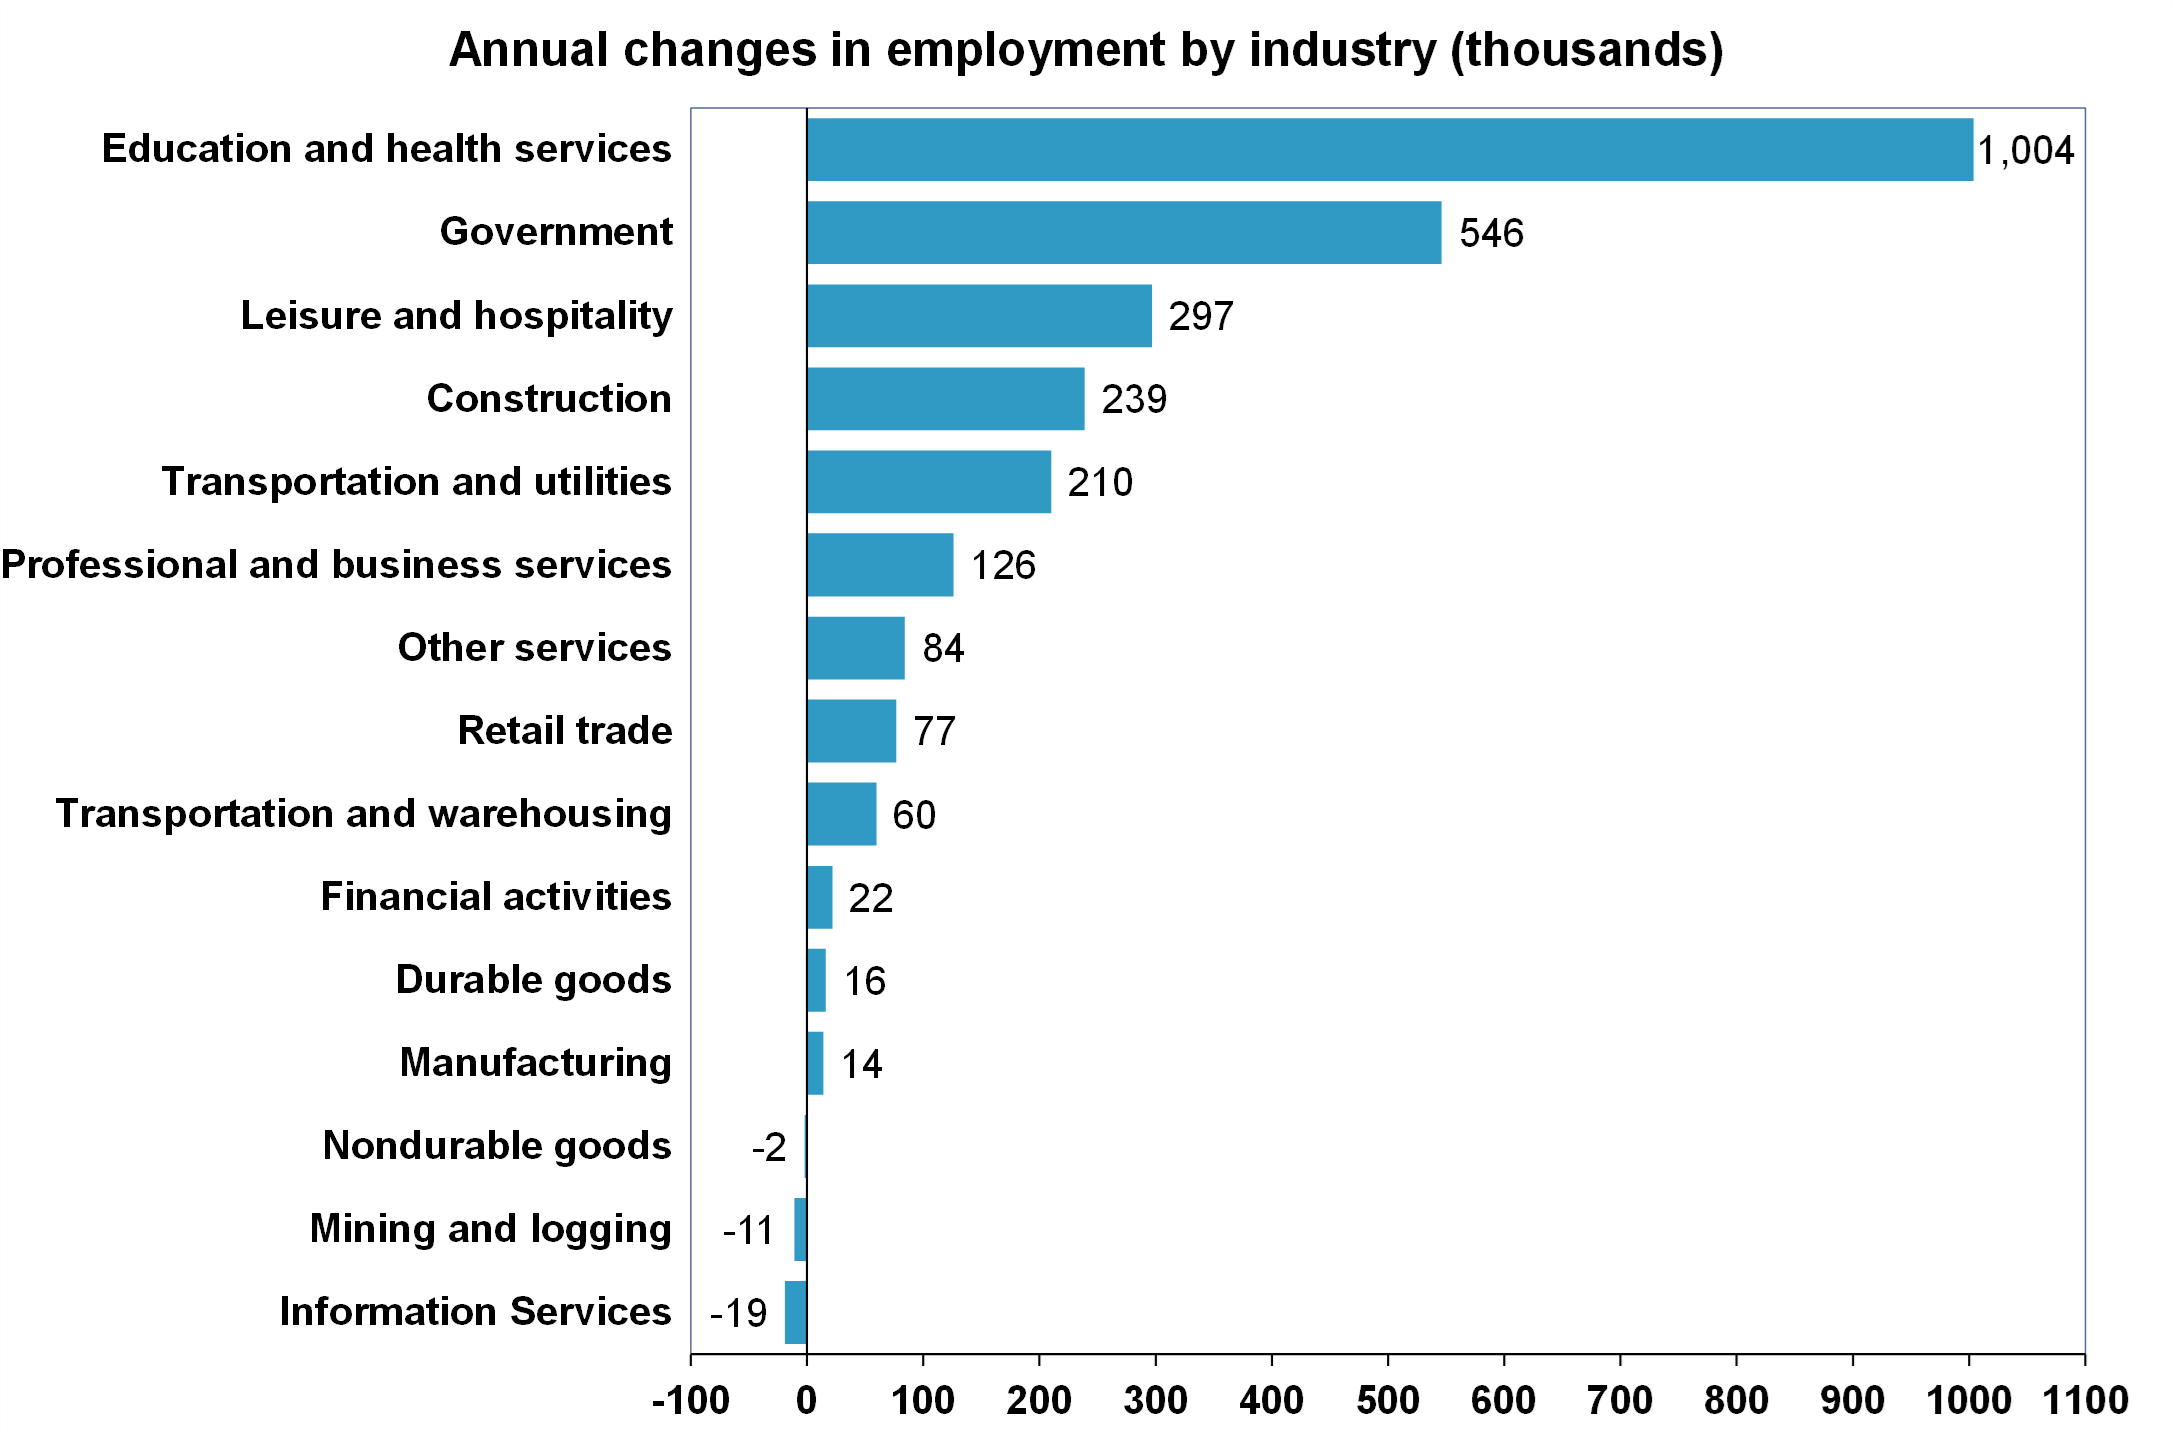
Source: Bloomberg, AMP
Recent labour market indicators
The July non-farm payrolls data got the market worried about a US downturn because the unemployment rate increased to 4.3%, a jump from 4.1% in the prior month and the highest level since late 2021 (although this may be impacted by the recent hurricane in the south).
This increase in the unemployment rate made many economists look to a recession indicator derived from the unemployment rate known as the “Sahm Rule”, devised by a macroeconomist Claudia Sahm who worked at the US Federal Reserve. The rule states that when the 3-month moving average of the US unemployment rate is 0.5 percentage points or more above its prior 12 month low then it’s a signal of recession. This has been a good indicator at other times of recession in the past. After the July data, this Sahm rule was triggered (see the chart below) and is getting investors concerned that the unemployment rate will rise further from here as the US economy goes into a recession. Since 1948, the average lift in the unemployment rate during a recession is 3.5 percentage points, usually occurring over the space of a year. In the current cycle, the unemployment rate has risen by 0.9 percentage points.
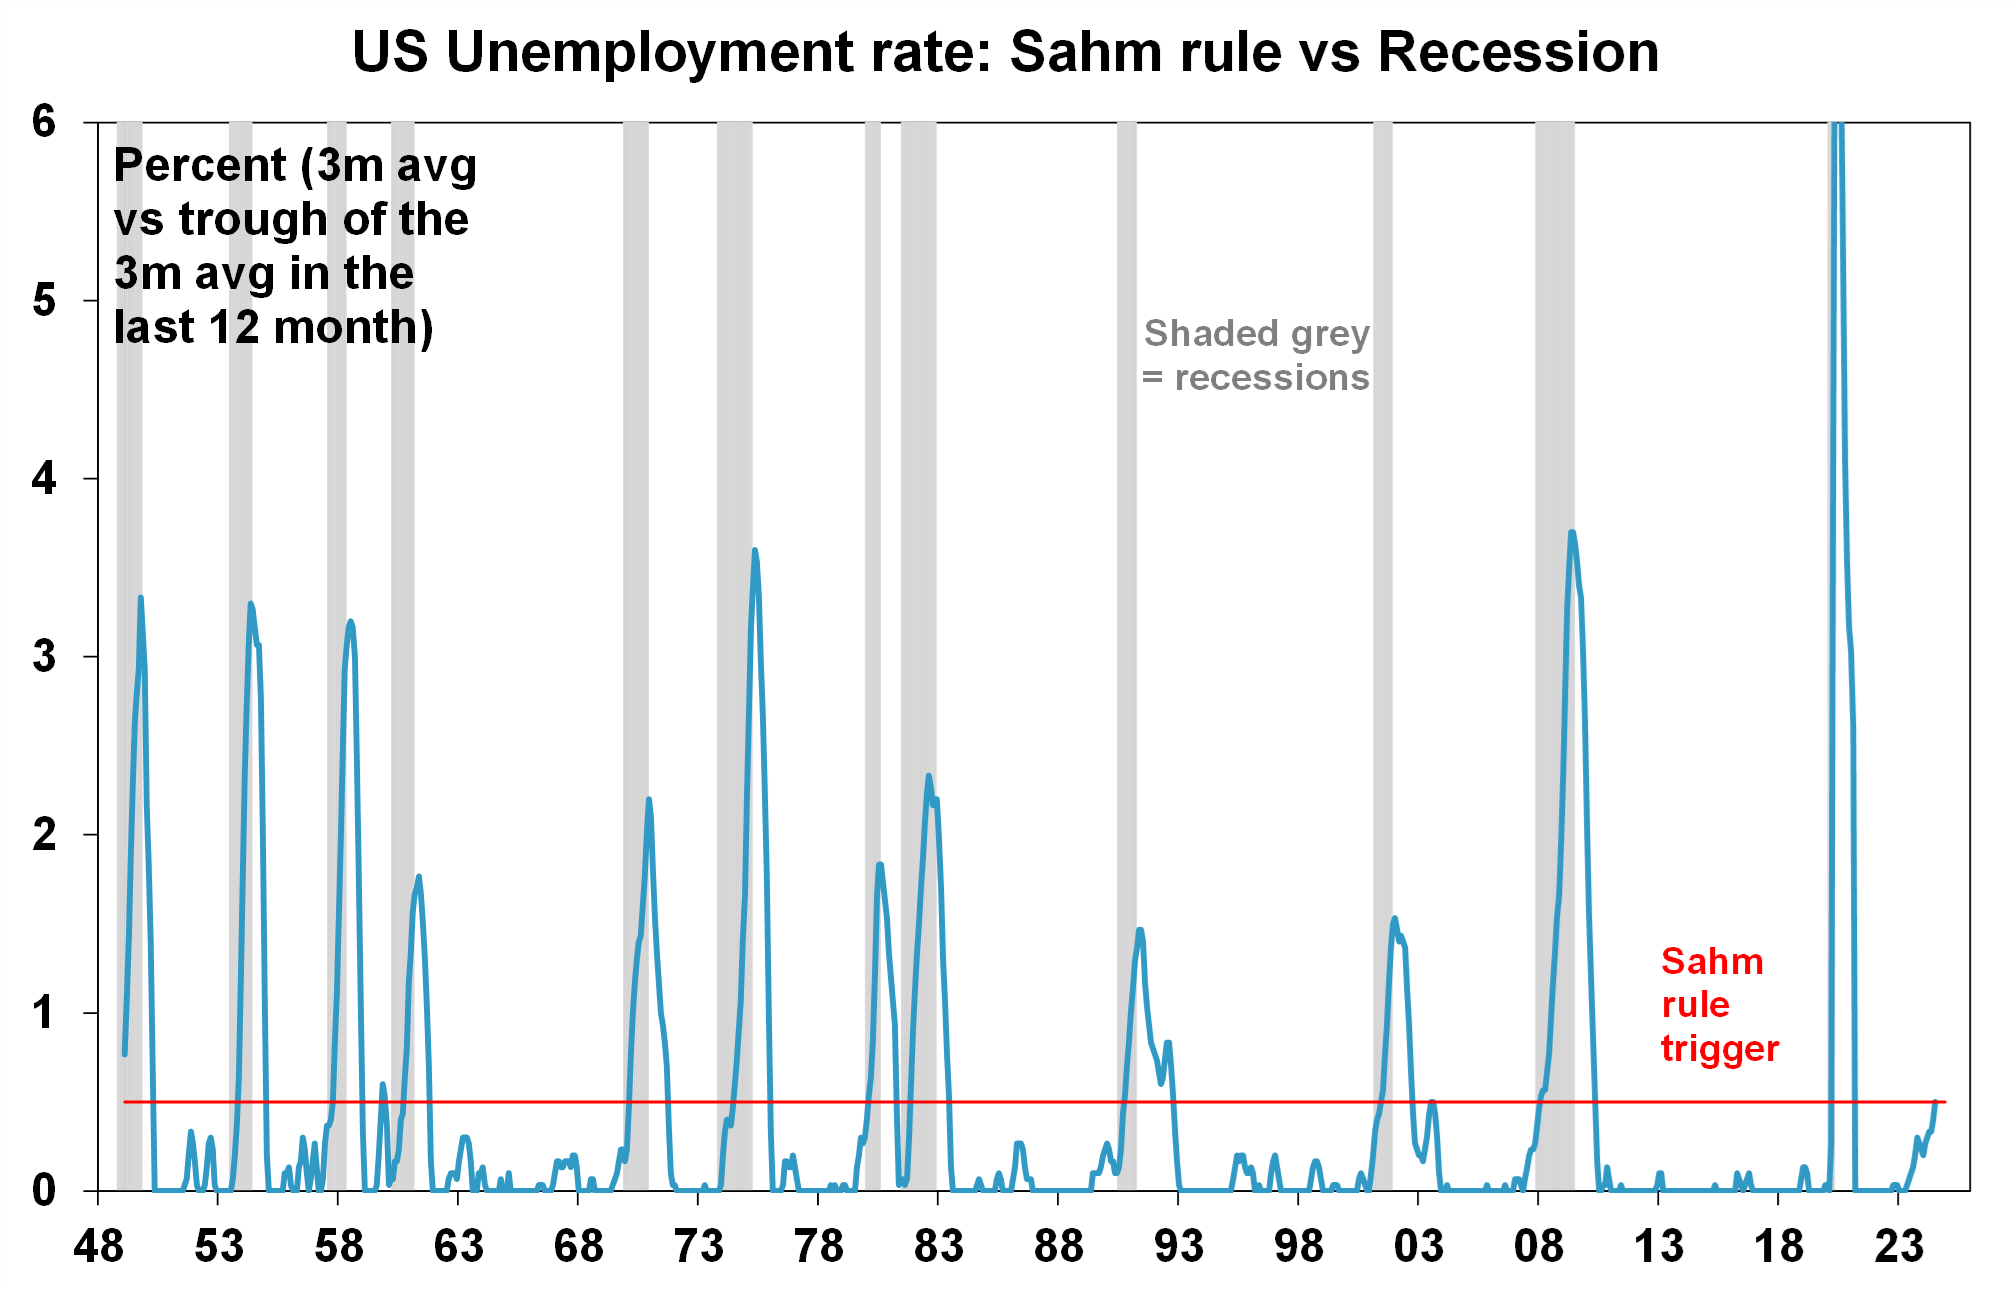
Source: Bloomberg, AMP
The broader suite of labour force data has also been signalling a slowing in conditions. The ratio of job openings relative to the number of people unemployed (and therefore looking for work) has fallen back to pre-COVID levels (but has not collapsed), the quits rate (number of people voluntarily leaving their job) has declined to its lowest level in 6 years (outside of the pandemic), initial and continuing jobless claims have been trending up for weeks and are also back to pre-COVID levels and the number of workers on permanent layoff has increased noticeably (see the chart below) which historically has occurred alongside a recession.
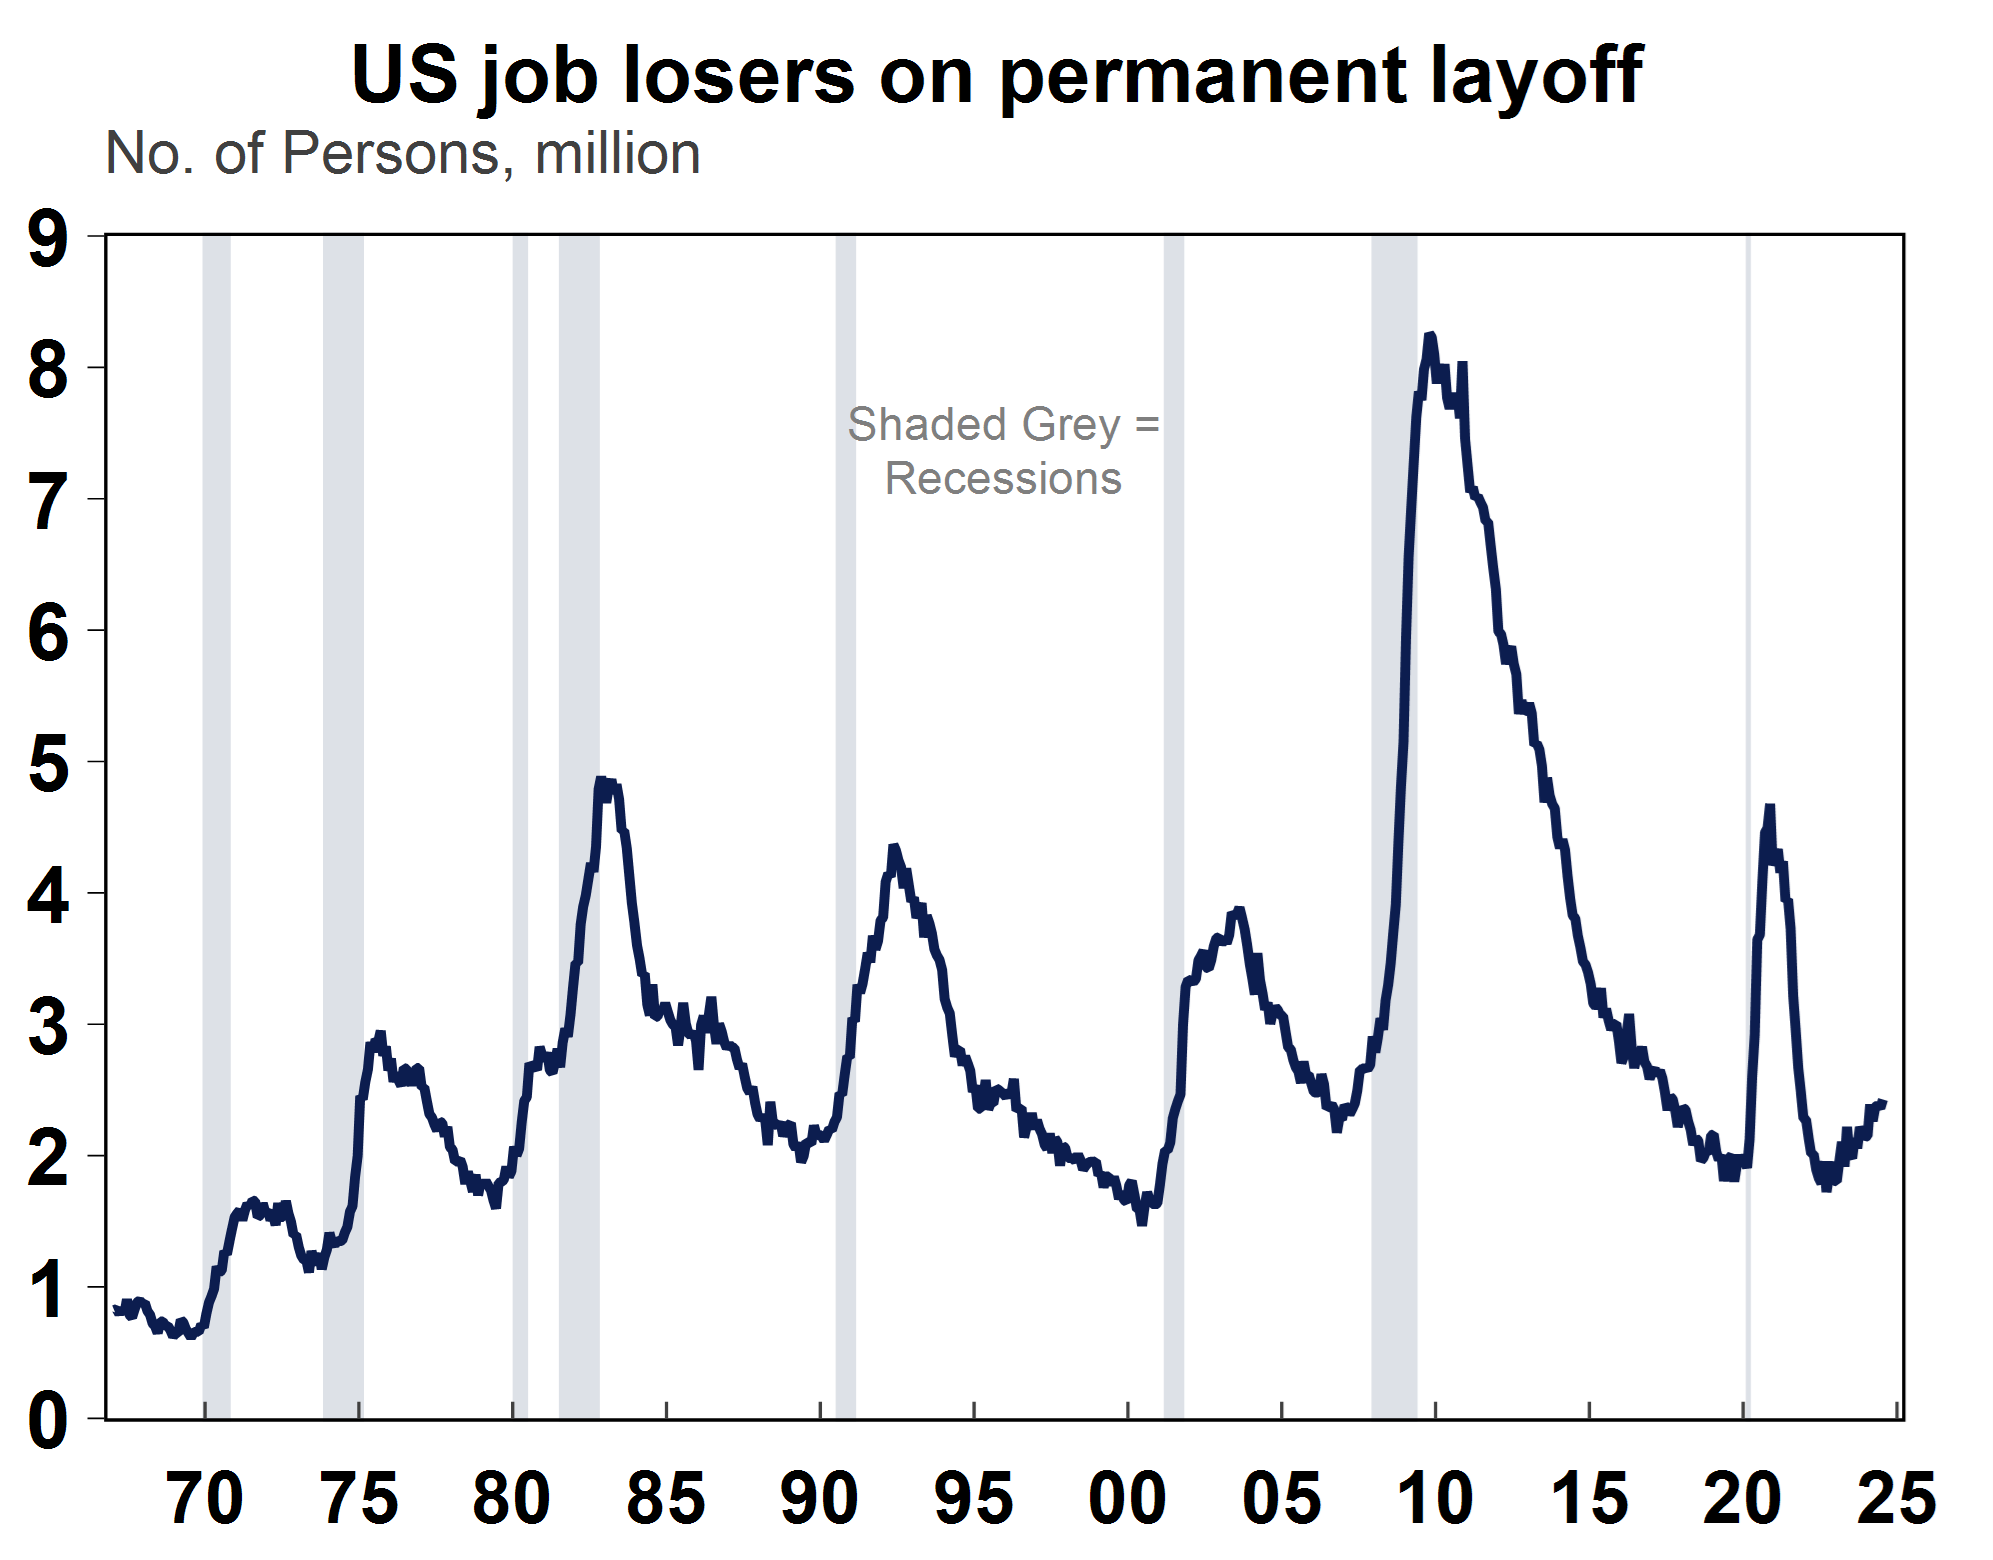
Source: Macrbond, AMP
We put together a leading indicator of employment growth using initial jobless claims, temporary service staff help, the NFIB index of businesses increasing employment, job openings, the Conference Board “jobs hard to get” index from its survey of consumers and the quits rate. The next chart shows our leading indicator of employment growth.
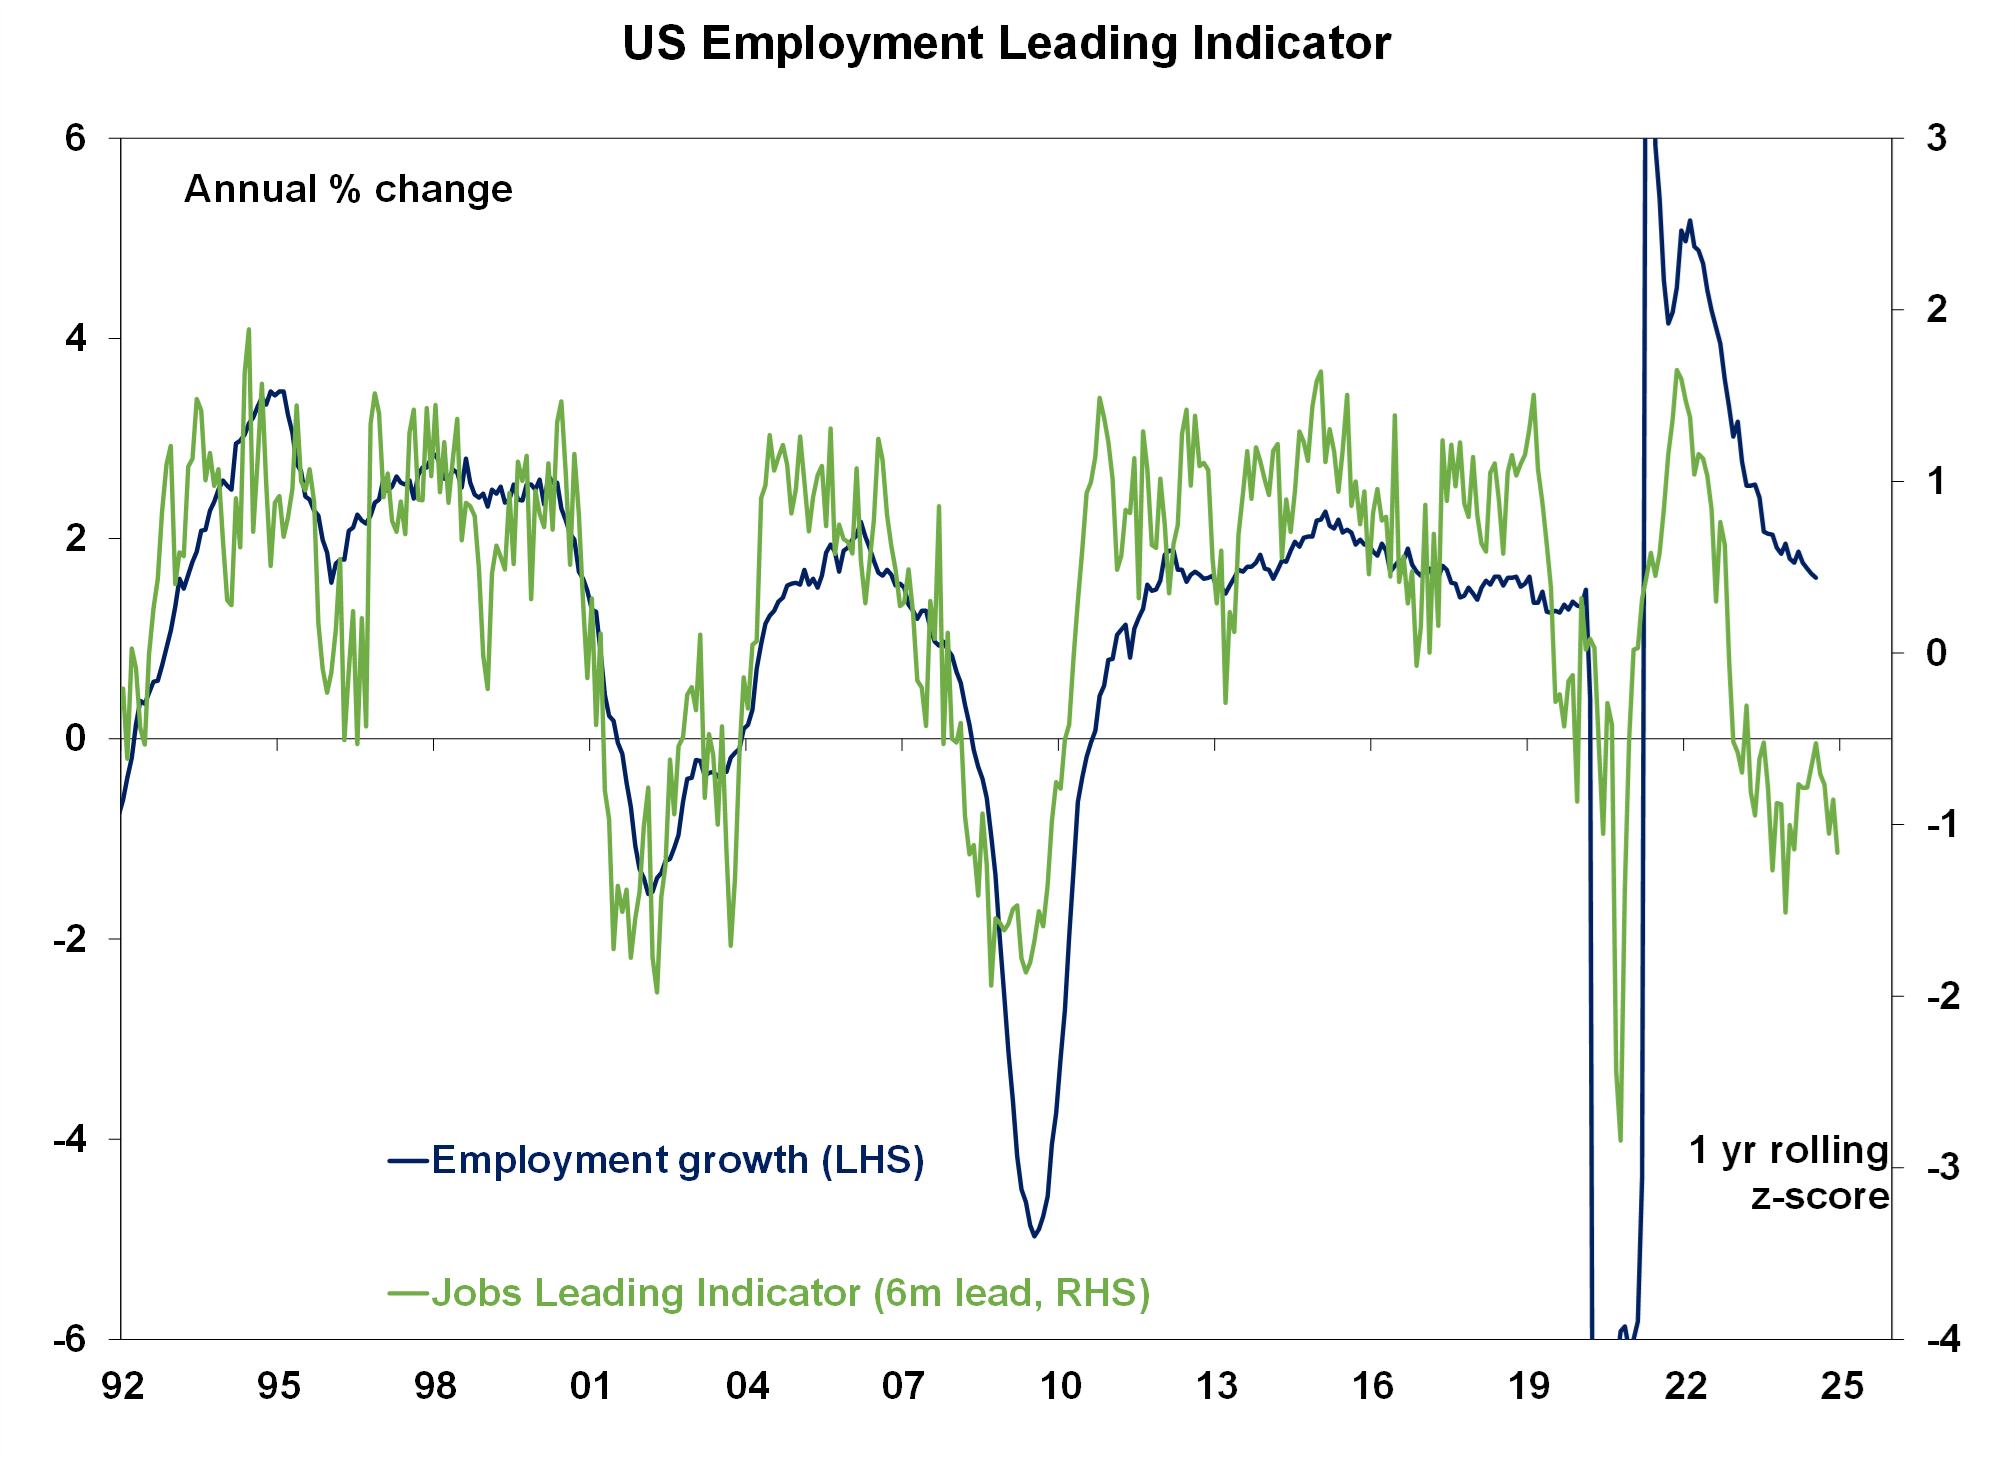
Source: Bloomberg, AMP
The employment leading indicator has been falling for some time, but actual employment has been more resilient, indicating potential labour hoarding from business. The indicator shows that employment conditions are likely to remain weak in coming months, but it has not fallen to the same levels as in the early 2000s recession or the Global Financial Crisis. The unemployment rate may hover around its current level for some time.
Implications for investors
Besides the negative signal from the Sahm Rule, other recession indicators are also pointing to a high risk of a downturn, including the gauge from the US leading index (which combines various economic data), the ISM manufacturing index below 50 (which means it in contraction) and the inverted yield curve. However, to counter these issues, the recent services PMI index was above 50 (and therefore remains in expansion). The market is focussed on the risks of a downturn or recession because the worst sharemarket declines coincide with a recession as our Chief Economist Shane Oliver wrote about here. The weakening in the US labour market would hurt the US consumer, which has been the source of strength and outperformance for the US economy post-pandemic (see the chart below).
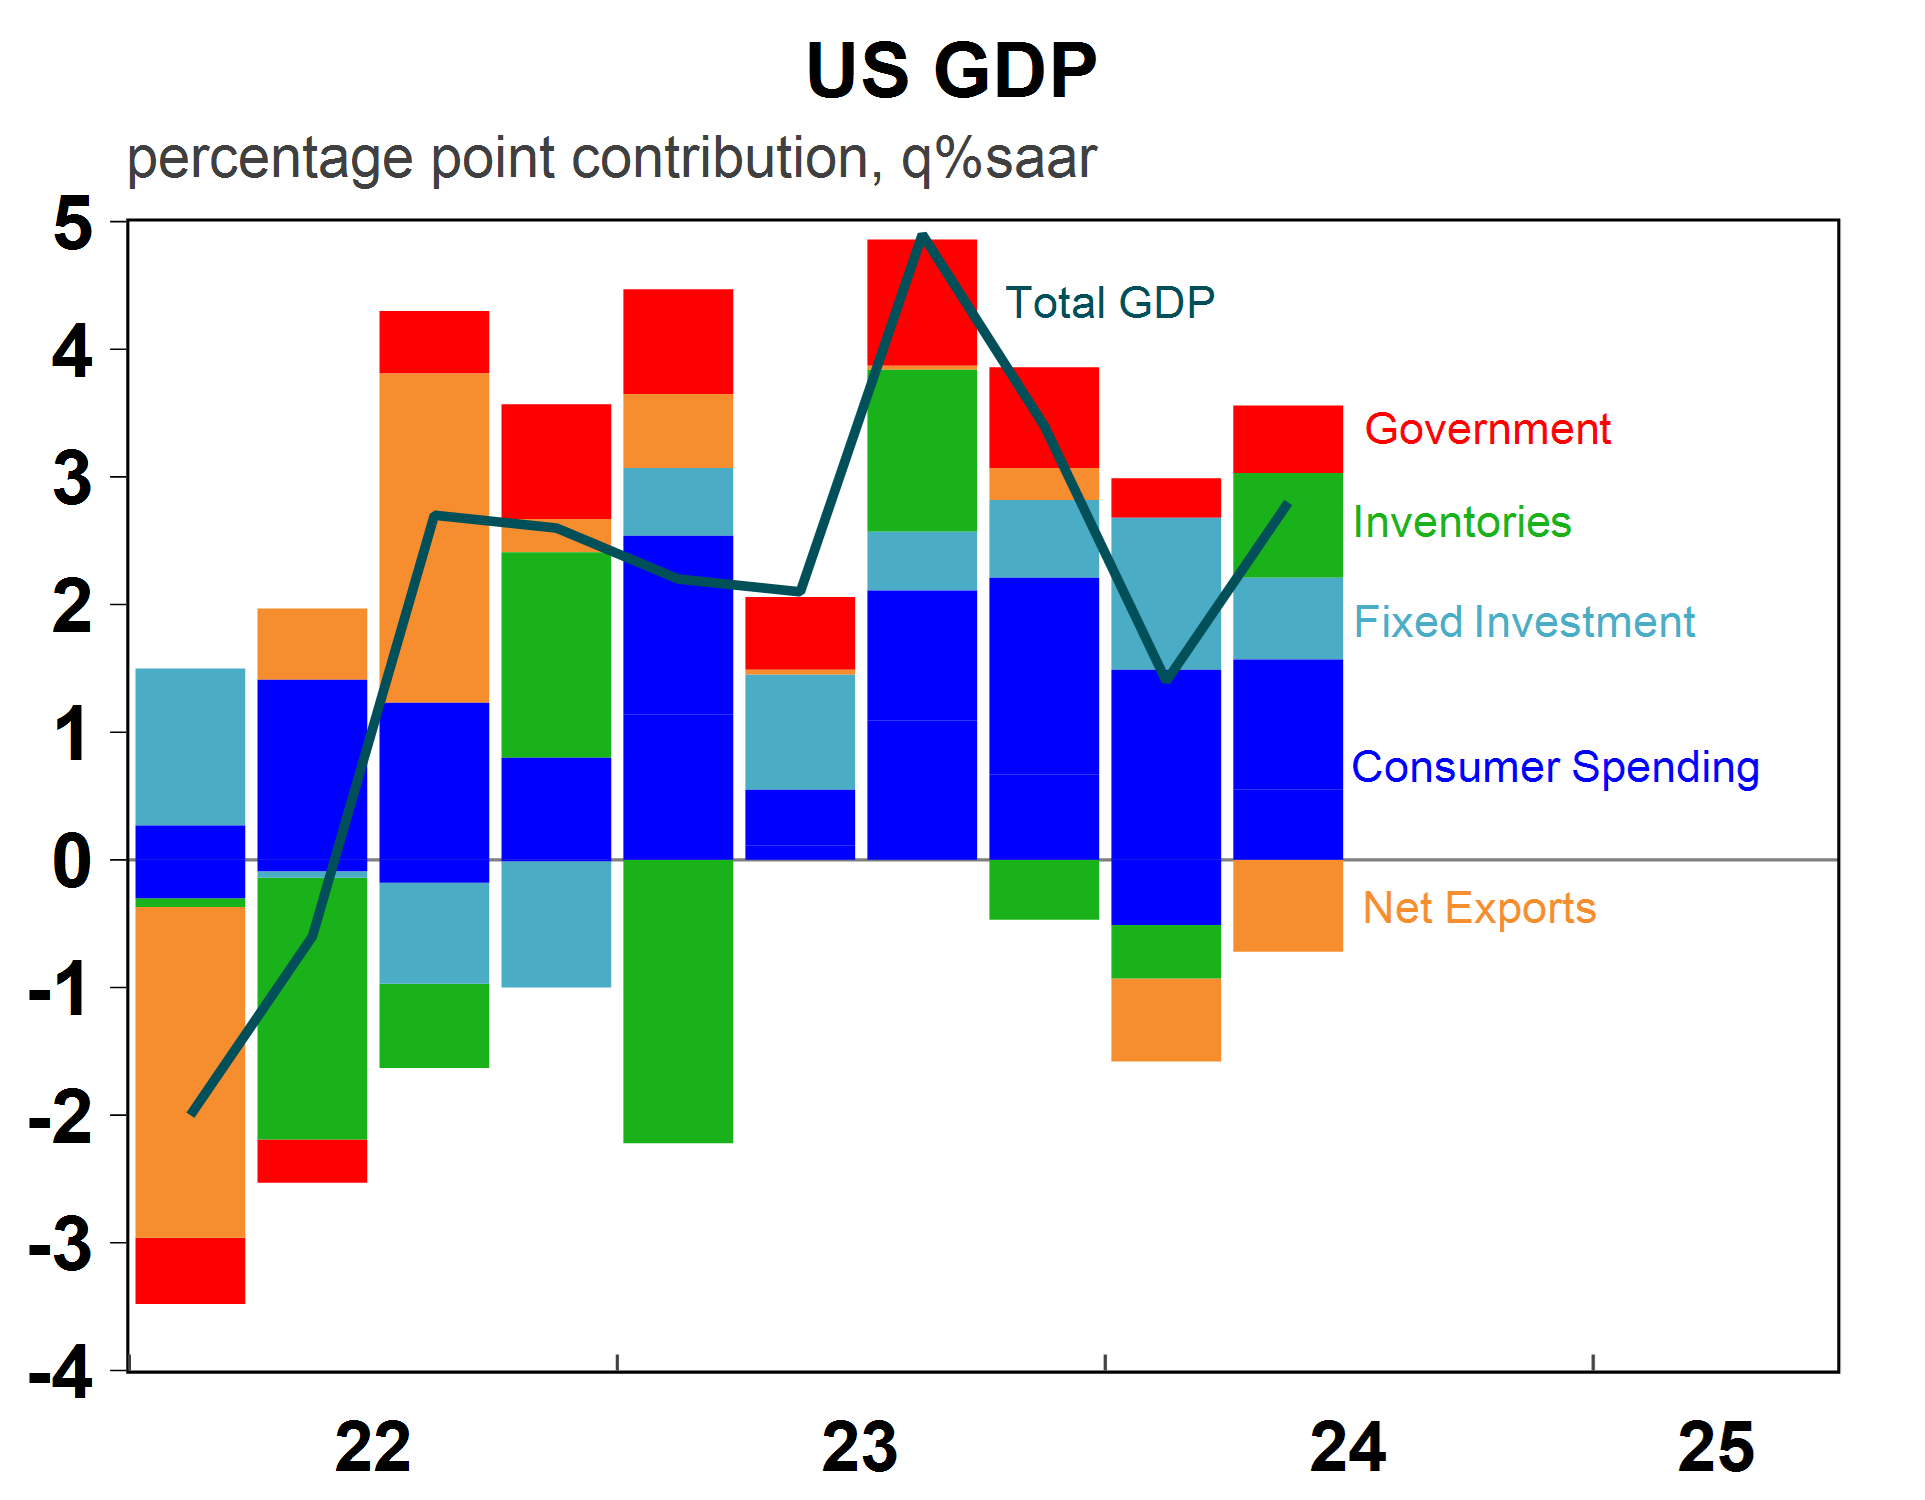
Source: Macrobond, BEA, BCA, AMP
The risk of a US recession in the next 12 months is high at around 50%, but there is not enough evidence right now that a recession is a certainty or that it would be a “bad” recession (i.e. deep and prolonged rather than short and sharp like some major economics have experienced in recent years). The US Federal Reserve is almost certainly going to cut interest rates at their September meeting, potentially even by 0.50 percent, depending on how financial market conditions and economic data track over coming weeks.

Weekly market update 09-08-2024
09 August 2024 | Blog This week Dr Shane Oliver discusses the worries about a US recession and how shares remain at high risk of further falls over the next few months, RBA rates on hold and seven reasons why they have peaked and more. Read more
Oliver's insights - recession fears and market falls
06 August 2024 | Blog Share markets have seen big falls on the back of rising recession fears. For the last two years there has been constant fears of a recession – or a contraction in economic activity – on the back of central bank rate hikes. Read more
Weekly market update 02-08-2024
02 August 2024 | Blog This week Dr Shane Oliver observes a correction to be getting underway; recession worries with soft US data; global rate cutting cycle gathers pace; ABS should ditch the Monthly CPI; RBA to hold; and more. Read moreWhat you need to know
While every care has been taken in the preparation of this article, neither National Mutual Funds Management Ltd (ABN 32 006 787 720, AFSL 234652) (NMFM), AMP Limited ABN 49 079 354 519 nor any other member of the AMP Group (AMP) makes any representations or warranties as to the accuracy or completeness of any statement in it including, without limitation, any forecasts. Past performance is not a reliable indicator of future performance. This document has been prepared for the purpose of providing general information, without taking account of any particular investor’s objectives, financial situation or needs. An investor should, before making any investment decisions, consider the appropriateness of the information in this document, and seek professional advice, having regard to the investor’s objectives, financial situation and needs. This article is solely for the use of the party to whom it is provided and must not be provided to any other person or entity without the express written consent AMP. This article is not intended for distribution or use in any jurisdiction where it would be contrary to applicable laws, regulations or directives and does not constitute a recommendation, offer, solicitation or invitation to invest.
The information on this page was current on the date the page was published. For up-to-date information, we refer you to the relevant product disclosure statement, target market determination and product updates available at amp.com.au.