

Key points
- Trump 1.0, COVID-19 and a move to de globalisation has resulted in trade restrictions becoming more common around the world.
- The betting markets for the November election have Trump ahead of Biden by 9 percentage points. Trump 2.0 would result in trade policies that are much larger compared to those imposed in 2018 because he is proposing a 10% across-the-board tariff and a 60% tariff on Chinese imports.
- Sharemarkets had a large negative reaction to Trump’s 2018 trade restrictions.
- Markets are under-pricing the chance of a Trump victory in November and the high risk of a global trade war erupting which would be negative for growth and sharemarkets.
Introduction
We recently wrote about the issues surrounding the US election. In this Econosights we look specifically at Trump’s trade policies, which may result in significant downside risk to sharemarkets, in the event of a Trump 2.0 Presidency in 2025.
A history of recent US trade disputes
The US runs a trade deficit and has done so since the early 1990s (see the chart below). This means that the value of US imports (both goods and services) is higher than US exports to the world. The Trump 1.0 trade war which started in 2018 was focussed on reducing bilateral trade deficits (directed mostly at China) and set the tone for a more closed global economy, which was then bolstered by COVID-19 pandemic.
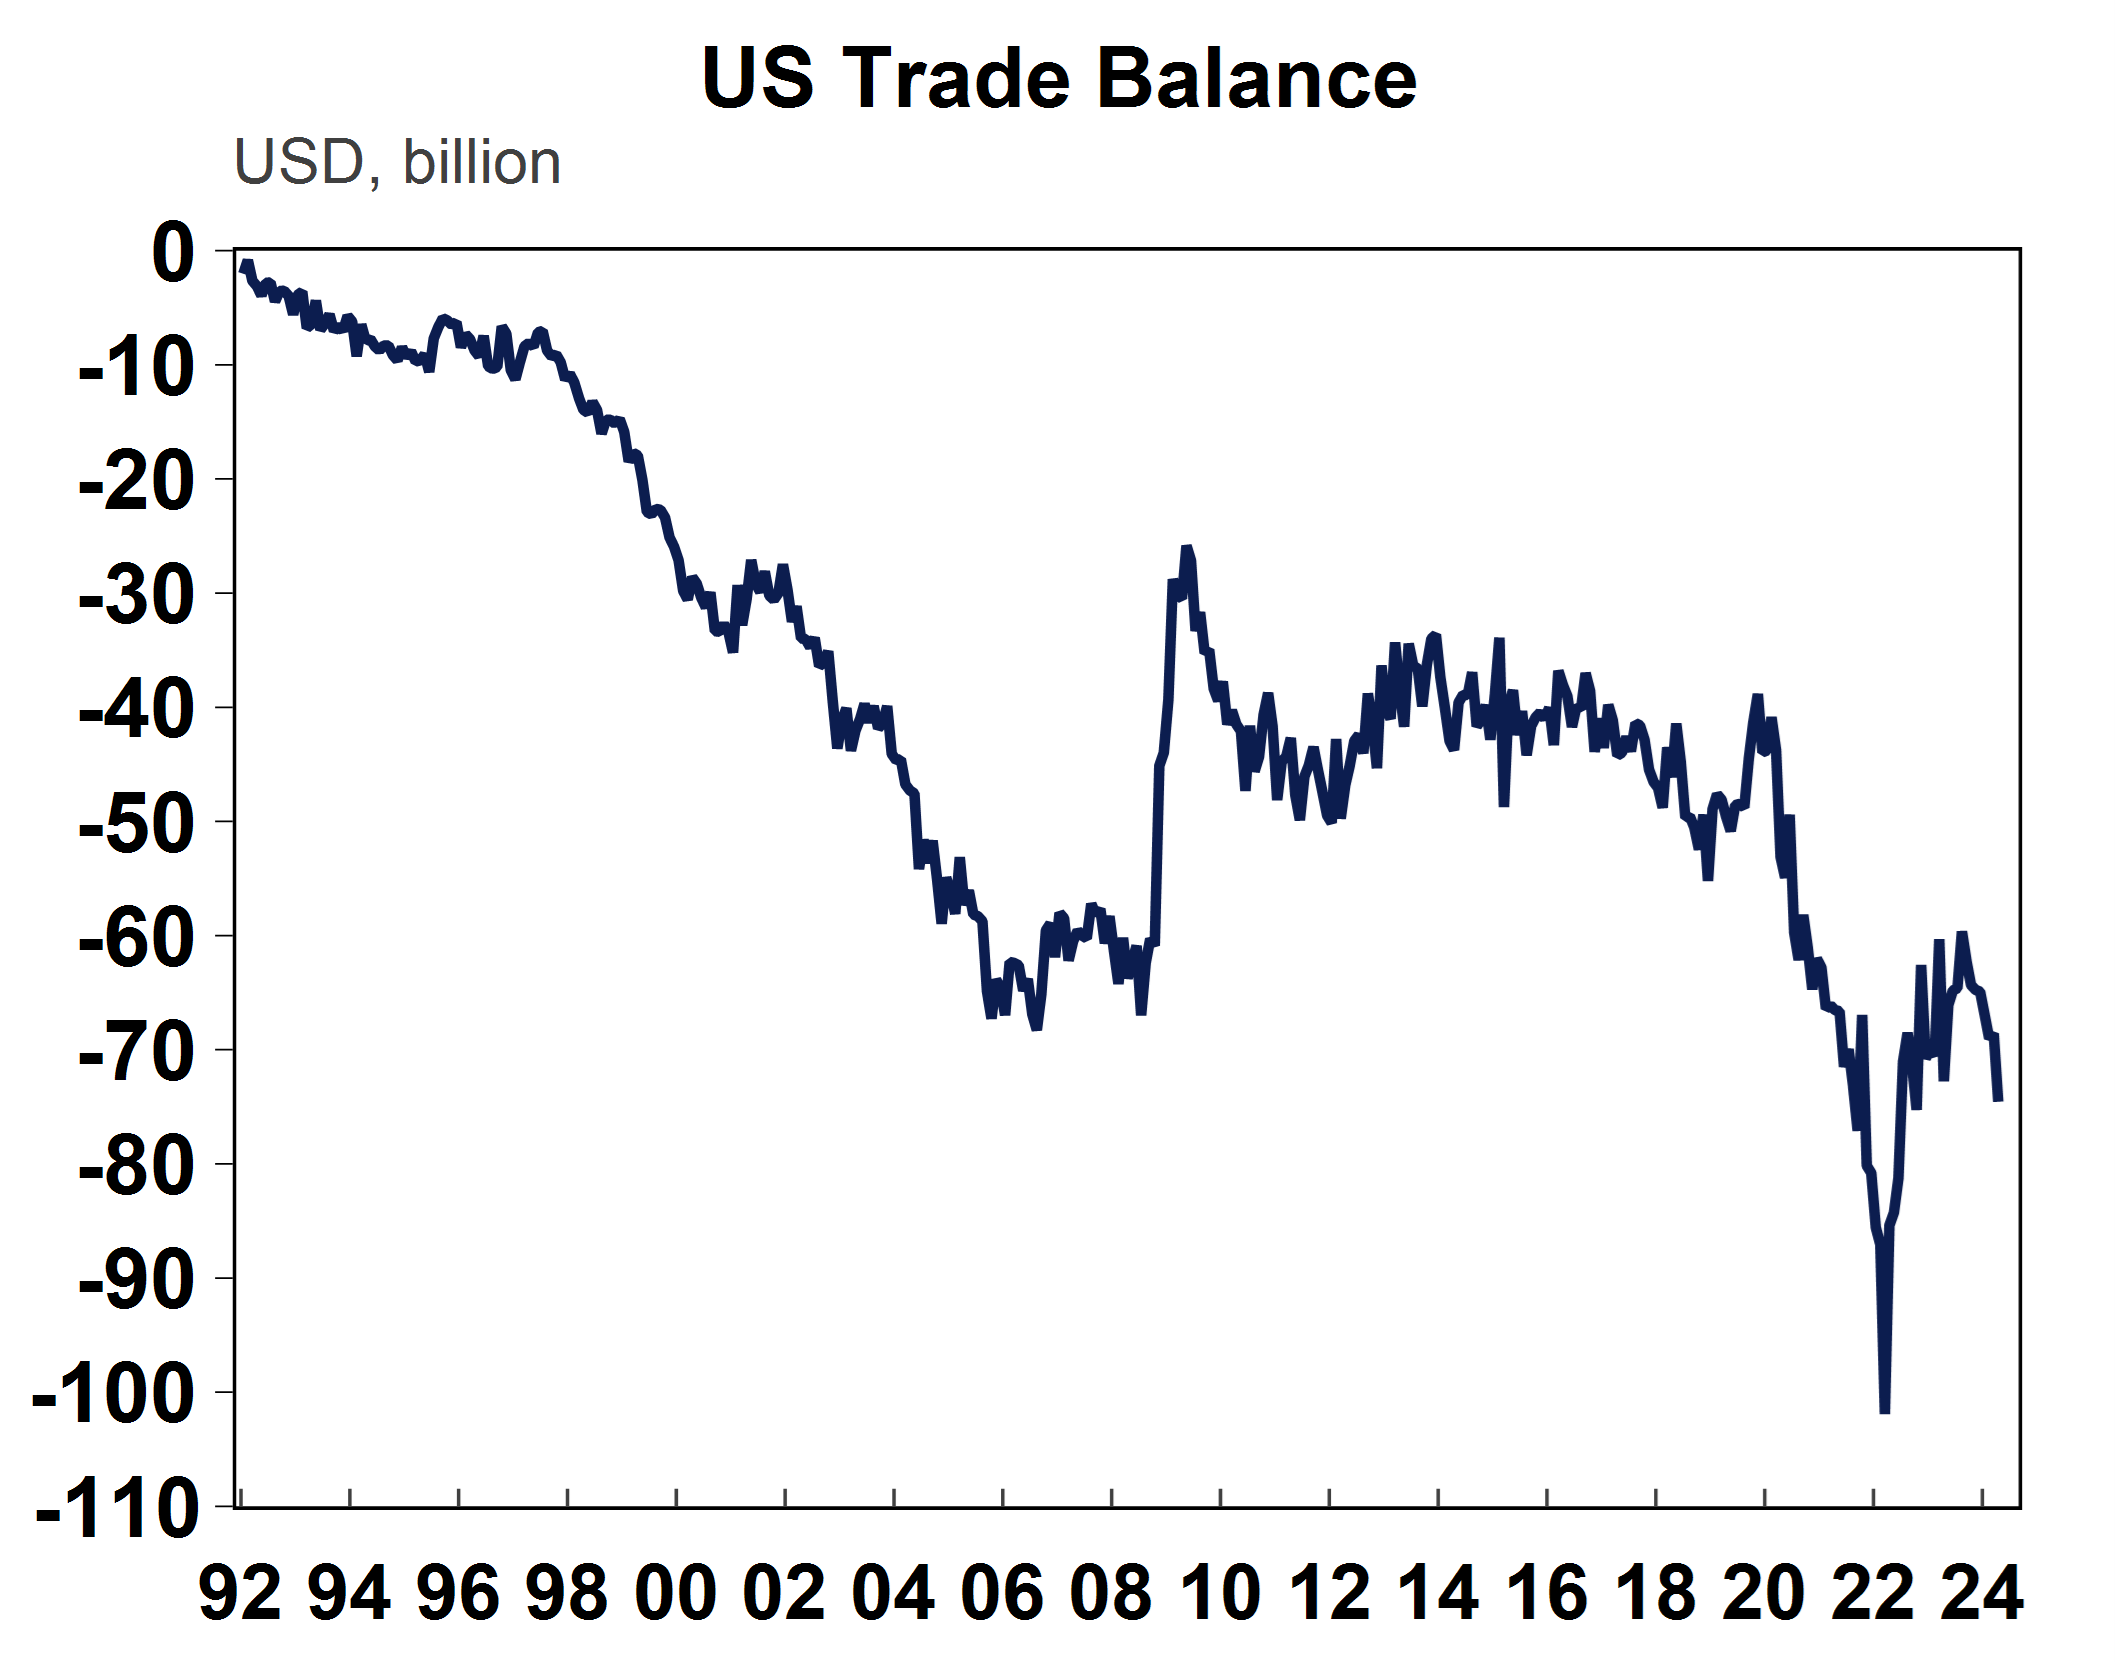
Source: Macrobond, AMP
According to the US Tax Foundation, Trump 1.0 in 2018 levied tariffs on ~$380bn of imports (13% of total imports) including steel and aluminium, washing machines, solar panels. Around 70% of Chinese imports were subject to a tariff (ranging from 7.5% to 25%). Tariffs on European Union goods included aircrafts, agricultural and other products (which have since been suspended by Biden). China and Europe responded with some retaliatory tariffs on items such as US agriculture, although there were some exclusions over time.
Financial markets had a big negative reaction to the Trump 1.0 trade tariffs. The US S&P 500 fell by nearly 16% between March 2018 when the tariffs started in earnest and reached a low in December. At this time, global trade policy uncertainty saw the largest lift on record, or at least since the data started in the mid-1990s (see the chart below). Although, there were other events going on at the same time, including concerns about rising interest rates due to the strength of the US economy which was also negative for sharemarkets.
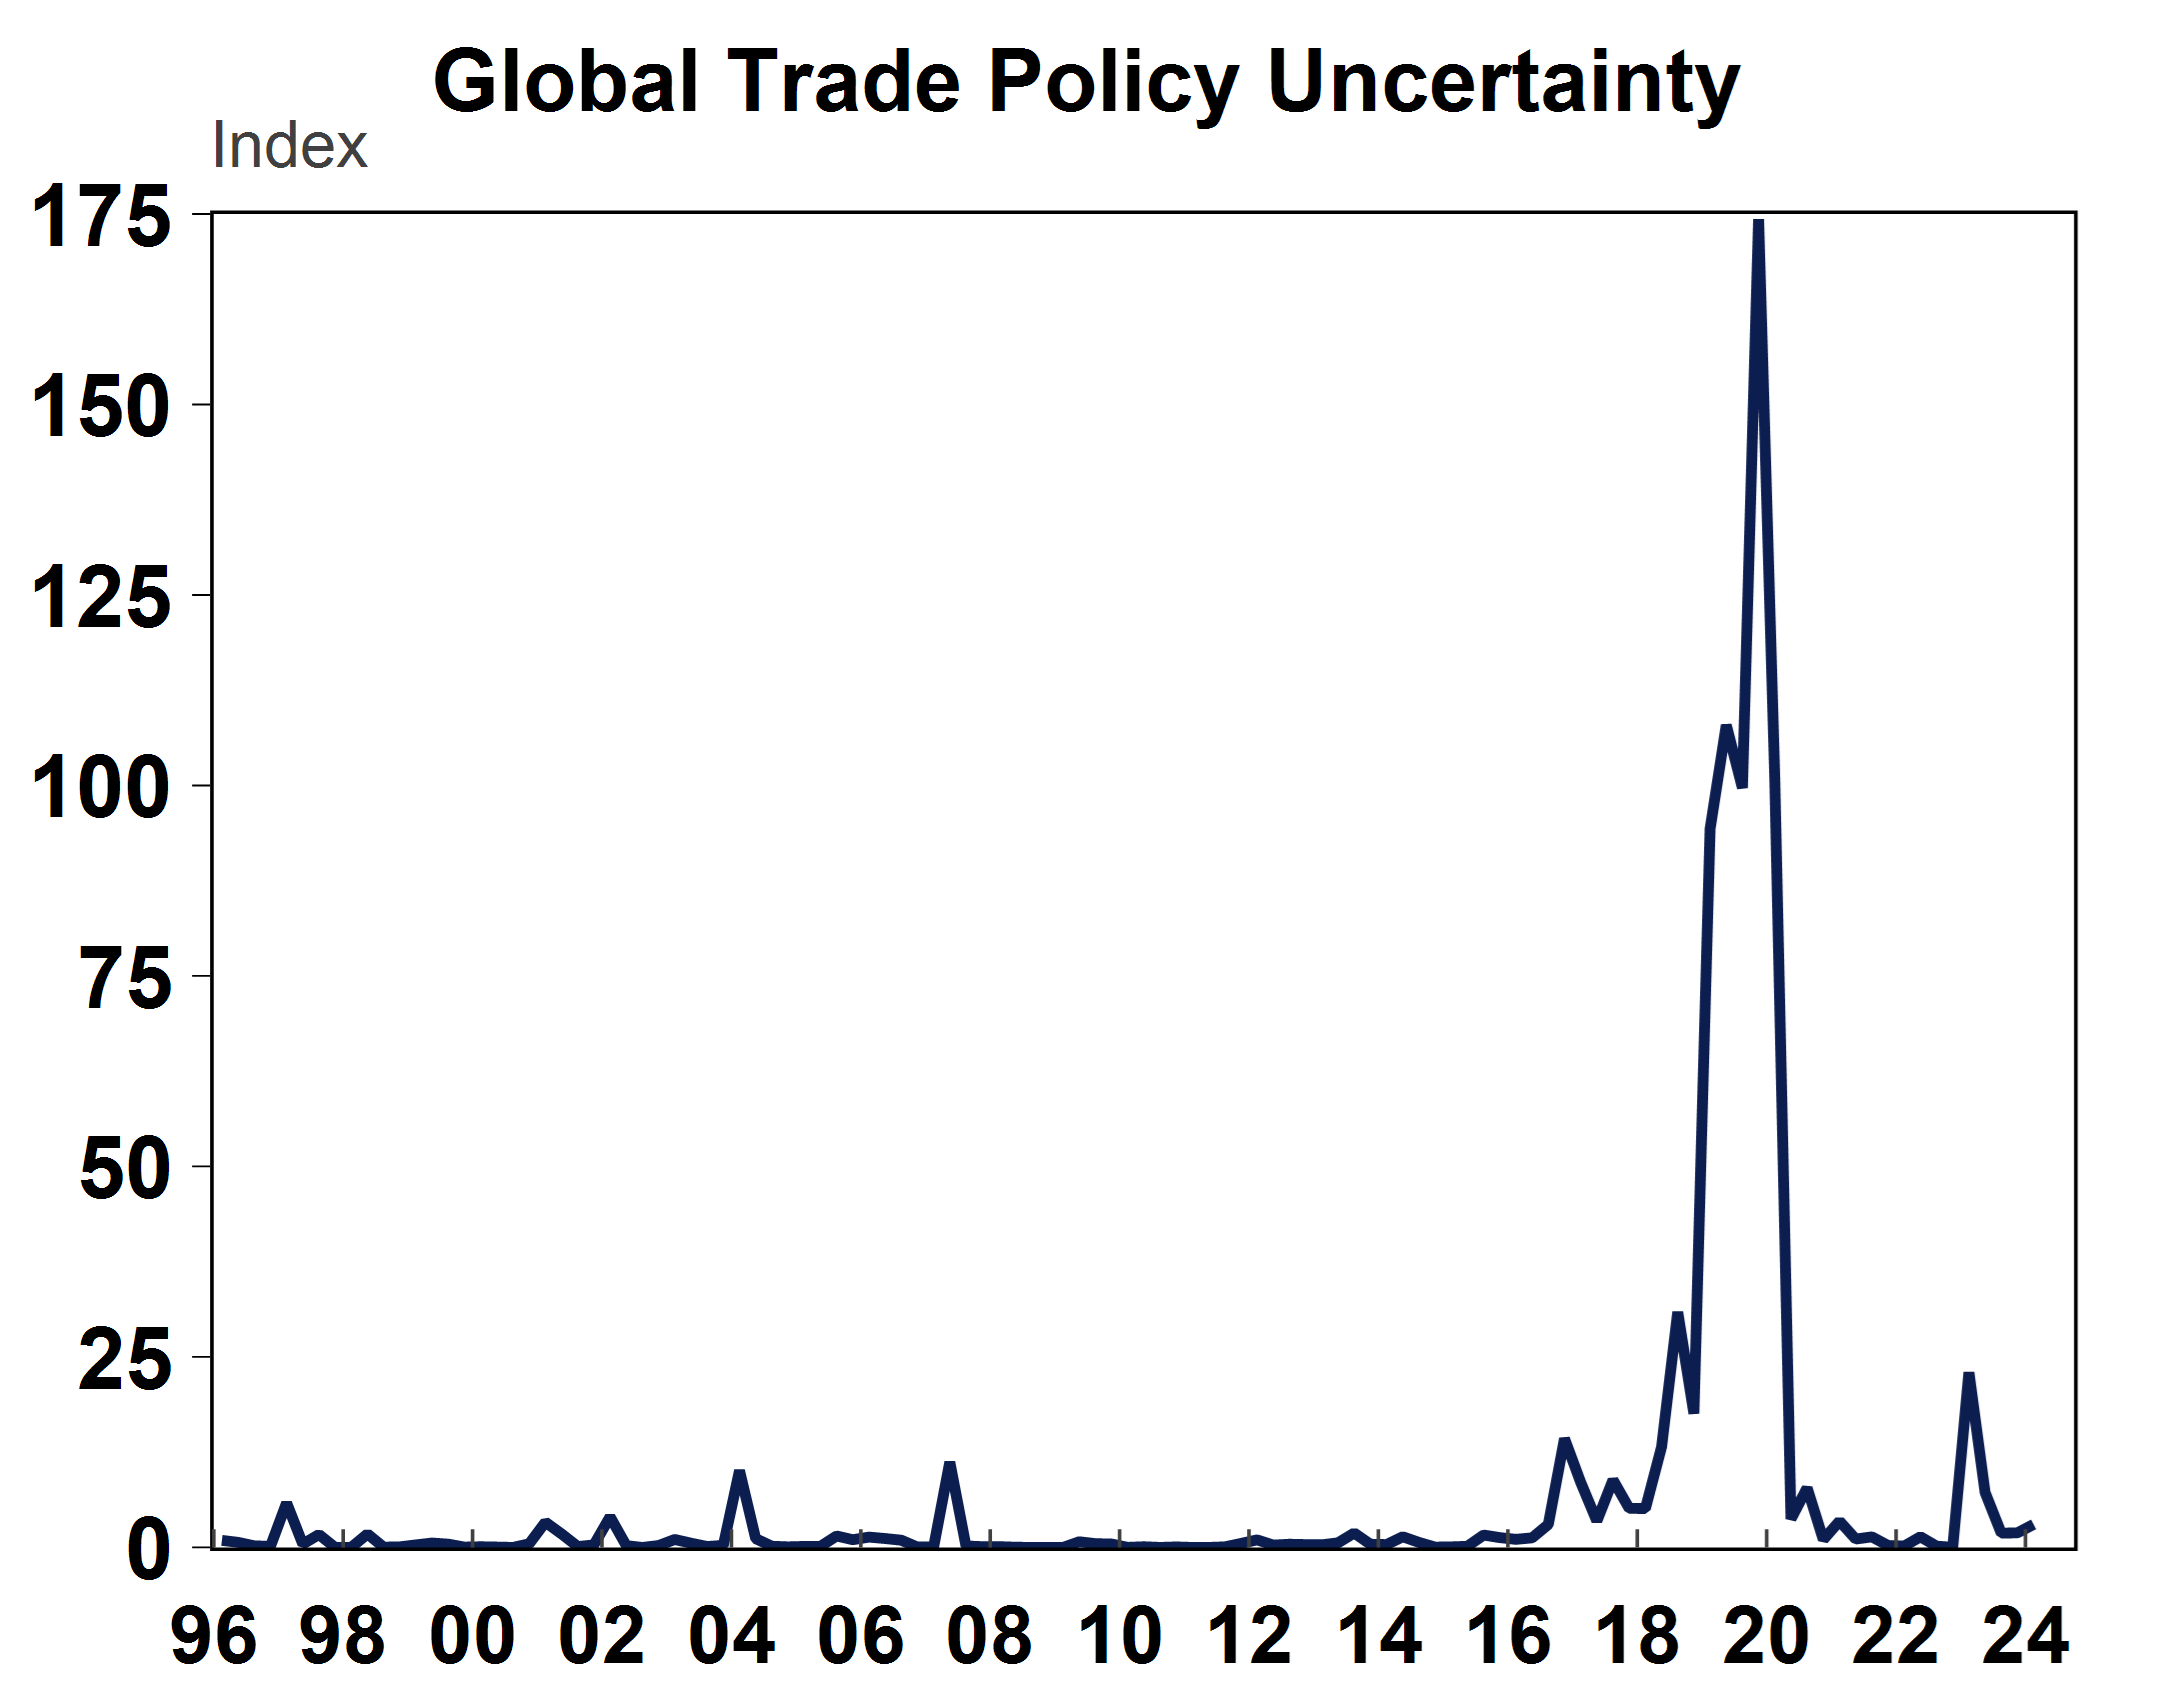
Source: Macrobond, AMP
Since then, President Biden has remained “tough” on China by retaining most of the Trump 1.0 tariffs (with minor exemptions on certain items), blacklisting Chinese officials, investigating banning TikTok and recently increasing tariffs on renewables, semiconductors and health care products, including a 100% tariff on electric vehicles (up from 25%).
Tariffs are borne by the importer who pay the tariff levy/tax to the government, and the government budget benefits via higher revenue. Higher costs for the importers tend to be passed down to: businesses who use imported products in their own production, manufacturing firms who transform goods into another product and consumers who directly use the goods. Trade disputes usually cause more losers than winners. The uncertainty trade disputes cause hurt business confidence and (and therefore potentially business investment) and producer and consumer prices usually rise. Import-competing businesses in the tariff-levying country could benefit via higher employment and profits if demand shifts to these domestic producers (which some may argue has happened in the US with the US tariffs on China). Tariff-levying countries may experience a rise in their currency which erases some of the gains to the exporters because their products become more expensive on the global market. The US Tax Foundation estimates that the Trump-Biden taxes reduce long-term GDP by ~0.21 percent and wages by 0.14 per cent.
The trade deficit between the US and Chinas has narrowed by ~$10bn since 2018 (see the chart below). However, this has been offset by a deterioration in the trade deficit with the rest of the world which has increased the US trade deficit (the trade deficit has worsened to ~$75bn from ~$40bn in 2018). So, it’s not clear that the 2018 trade tariffs have actually done anything to reduce US import reliance on the world! Ultimately, the US trade deficit reflects that the US saves less than it spends as a nation.
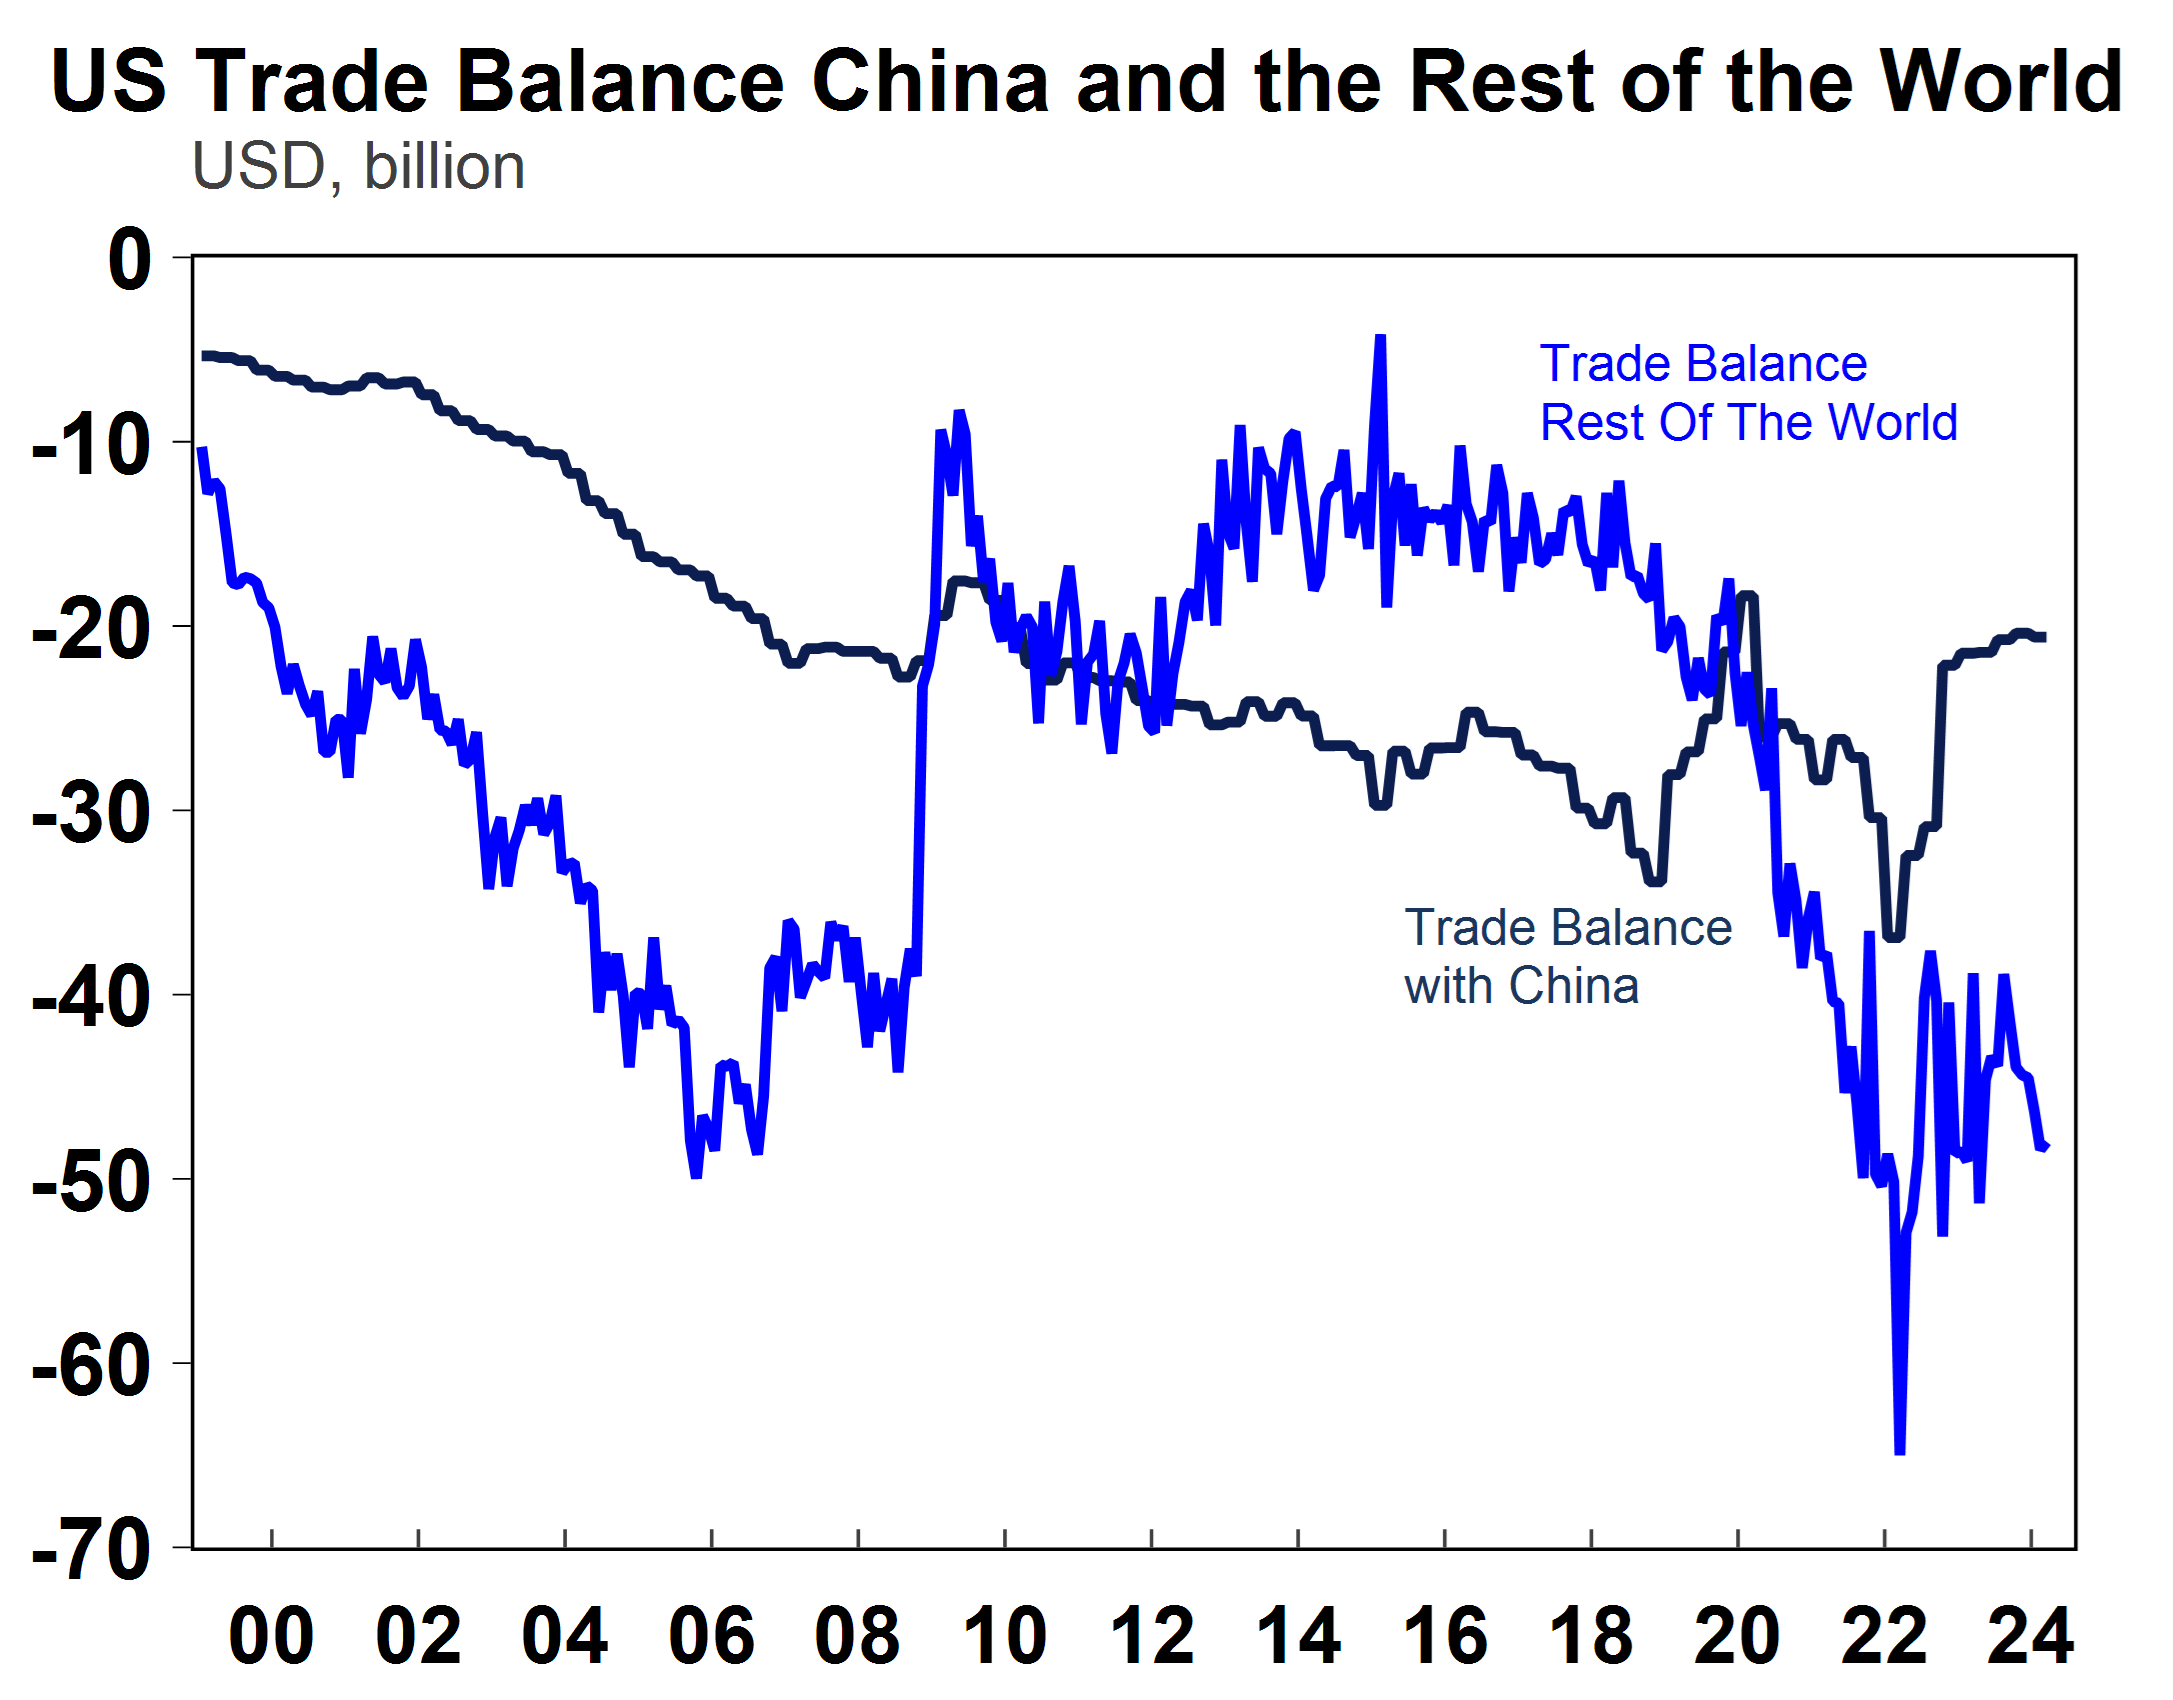
Source: Macrobond, AMP
Trump 2.0 – what to expect
Trump has been campaigning on the premise that he will move to impose a 10% tariff across-the-board and a 60% tariff on imports from China. Under these policies, the US tariff rate would increase to nearly 17% from its current level of ~3%, which is the highest tariff rate since the 1930’s Smoot-Hawley tariff era (see the chart below). It would be expected that other countries would retaliate significantly to these tariffs, and the risk is that this would then turn into a full-blown global trade war. Given the broad range of uncertainties and potential change in spending behaviour if consumers start demanding domestic-produced goods instead of foreign imports, it is hard to be accurate about the impact of tariffs in the long-term. However, estimates from Bloomberg suggest that the tariffs would lift US consumer prices by 2.5% and reduce GDP growth by 0.5% after two years.
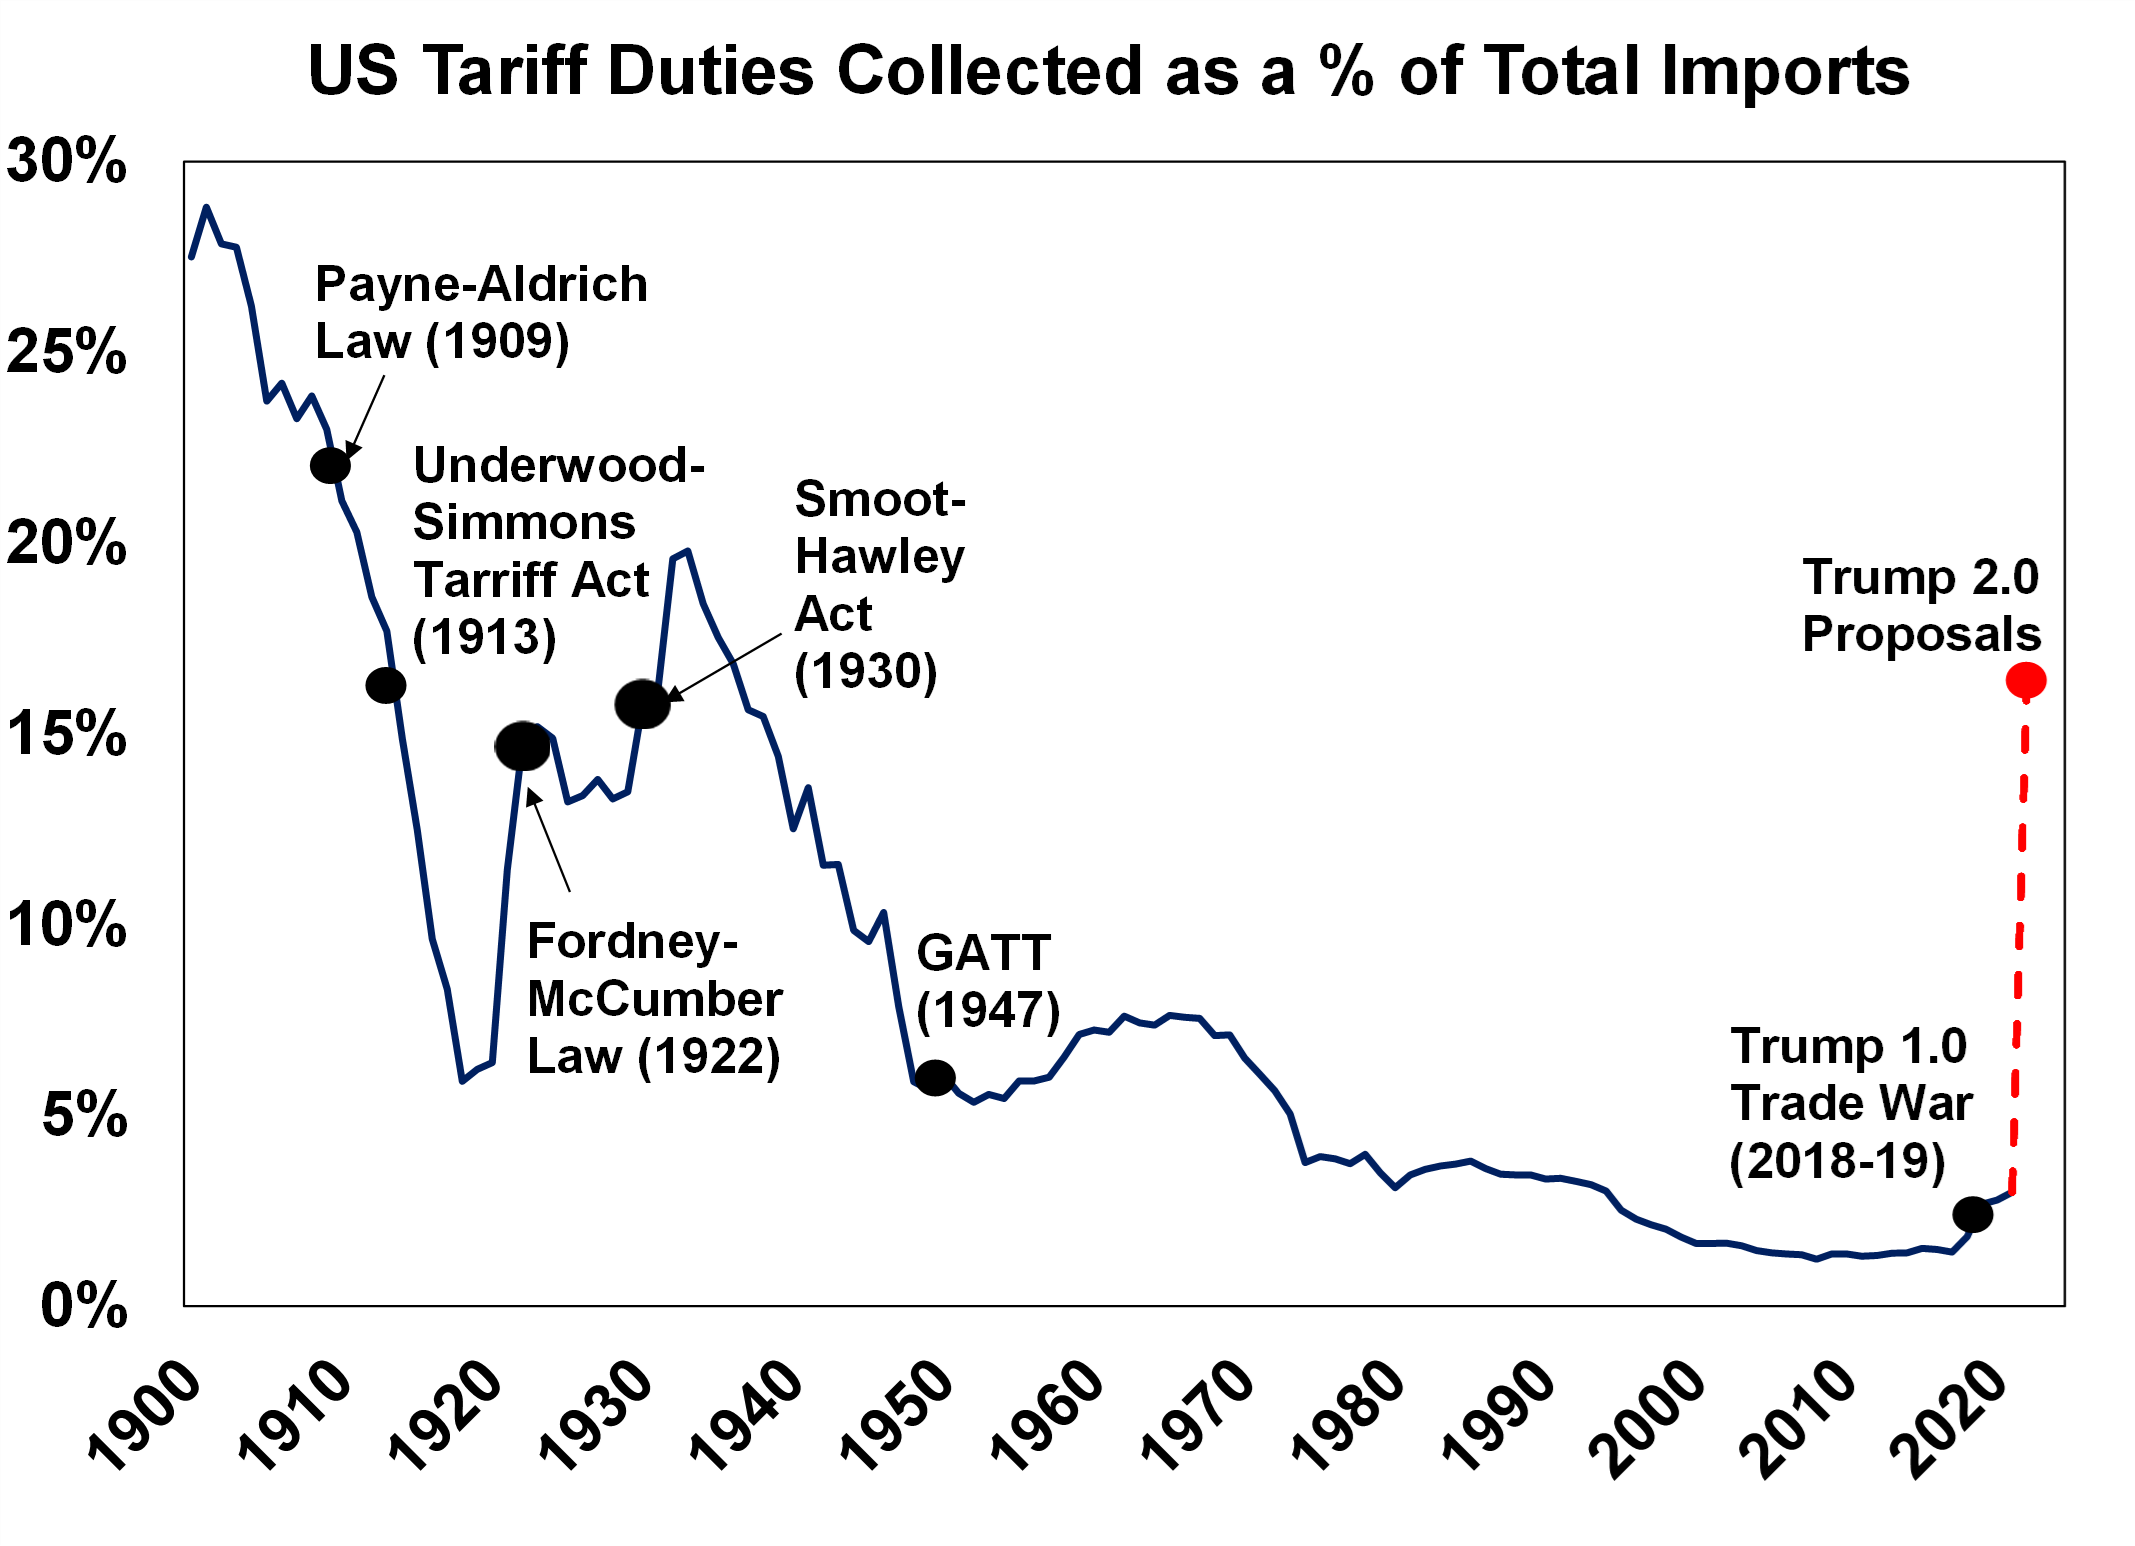
Source: US International Trade Commission, Evercore, AMP
Implications for investors
So far, financial markets have not reacted to the high risk of a trade war if Trump wins the US election in November. There are a few reasons for why this could be the case. Firstly, while the betting markets have Trump ahead of Biden by 9 percentage points (see the chart below) this has bounced around a bit and some may (again) not be taking Trump too seriously, especially after his criminal conviction or assume that he will dial down the trade rhetoric after he is elected (although this certainly didn’t happen in 2016!). Secondly, some may think that Trump is a “known” commodity after his first term and assume that the trade war didn’t cause havoc on global or US growth so any trade war now would be manageable as countries would try to by-pass tariffs through changing production routes. Thirdly, perhaps the market is offsetting potential tariffs with the chance of corporate and personal tax cuts. The Trump 1.0 personal tax cuts are due to expire at the end of 2025. Trump would support extending these (at a cost of $4trillion over 10 years) as well as other proposals like expanding tax credits for children and healthcare and Biden would extend some (for those earnings under $400,000). And recently Trump spoke about reducing the corporate tax rate further to 20% (from 21% at the moment) and expect to pay for these tax cuts through the increase to tariffs. Lastly, perhaps the market is optimistic on the tech theme in markets and assumes that companies like Nvidia can weather trade risks given solid earnings growth forecasts.
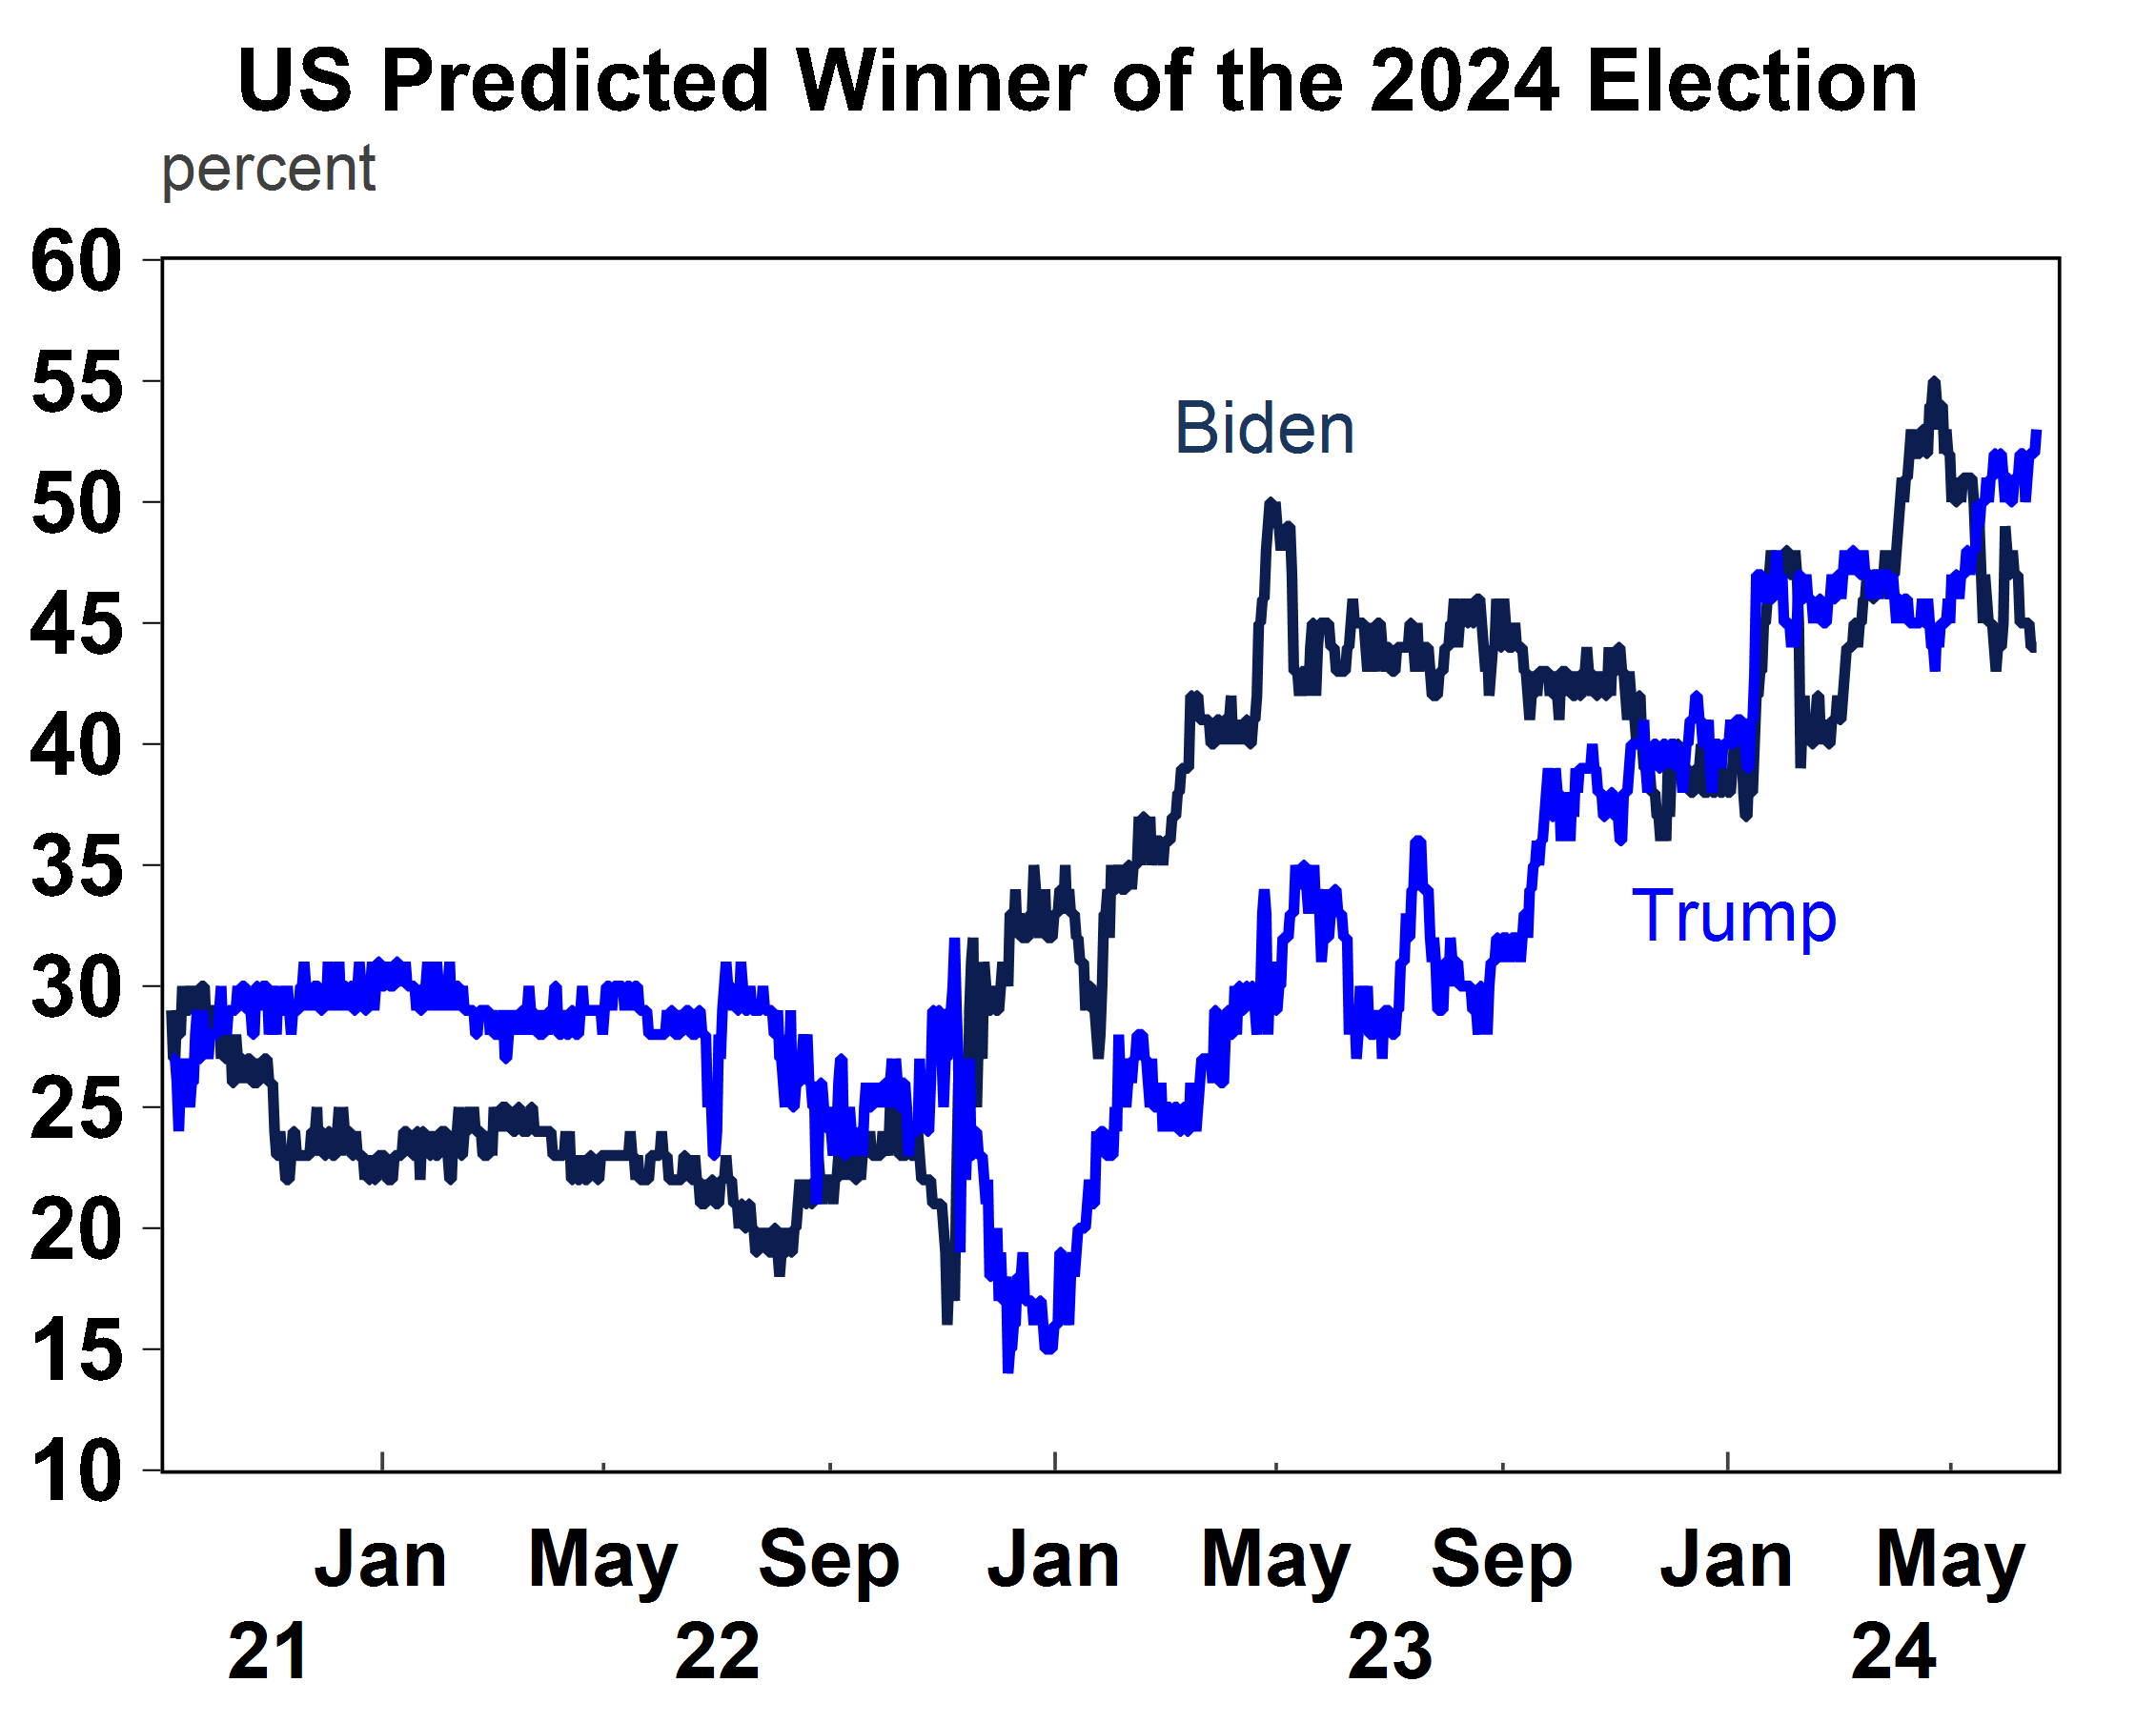
Source: Macrobond, Predictlt, AMP
However, in our view the market is underestimating the potential negative impact of an intensified trade war on US and global growth, especially with the close election odds. Even if Trump was to scale back some version of his current proposals, it would still be worse than the 2018 tariffs. Additionally, the market is probably underestimating and under-pricing the long-term potential negative of the broader geopolitical tension between the US and China which will continue as the US is threated by the strategic threat China poses as it expands its technological capabilities and emerges as a key rival in the global tech race.

Weekly market update 28-06-2024
28 June 2024 | Blog Dr Shane Oliver observes strong financial year returns - but can it continue?; Trump odds up after debate - watch trade war risks; risk of another RBA hike up but not fait accompli; Australian jobs market cooling; another big Australian budget surplus and more. Read more
Oliver's insights - investing 40 years
25 June 2024 | Blog Dr Shane Oliver shaes his nine most important lessons from investing over the past 40 years. Read more
Weekly market update 21-06-2024
21 June 2024 | Blog This week, narrowing US share gains; drip feed of falling global inflation & rates is good sign for RBA; Federal & state governments making the RBA's job harder; the pros & cons of nuclear; and more. Read moreWhat you need to know
While every care has been taken in the preparation of this article, neither National Mutual Funds Management Ltd (ABN 32 006 787 720, AFSL 234652) (NMFM), AMP Limited ABN 49 079 354 519 nor any other member of the AMP Group (AMP) makes any representations or warranties as to the accuracy or completeness of any statement in it including, without limitation, any forecasts. Past performance is not a reliable indicator of future performance. This document has been prepared for the purpose of providing general information, without taking account of any particular investor’s objectives, financial situation or needs. An investor should, before making any investment decisions, consider the appropriateness of the information in this document, and seek professional advice, having regard to the investor’s objectives, financial situation and needs. This article is solely for the use of the party to whom it is provided and must not be provided to any other person or entity without the express written consent AMP. This article is not intended for distribution or use in any jurisdiction where it would be contrary to applicable laws, regulations or directives and does not constitute a recommendation, offer, solicitation or invitation to invest.
The information on this page was current on the date the page was published. For up-to-date information, we refer you to the relevant product disclosure statement, target market determination and product updates available at amp.com.au.