Key Points
- The growth backdrop is challenging in the US over the next 6-12 months because of high inflation and further interest rate increases. As a result, the risk of recession is high at around 40-50%. Even if a recession is avoided, we expect very low US GDP growth of around 1% in 2023.
- The outcome of the US midterms (next Tuesday 8 November) is likely to be a return to “gridlock” as the Republican party get control of the House of Representatives and/or Senate (which means the Democrats lose their majority in the House of Representatives or Senate or both).
- This outcome is not necessarily bad for markets. US sharemarkets and GDP growth tend to perform better in the year after midterms because a source of uncertainty is removed and a gridlock environment means that policies pursued tend to be more centrist.
The growth backdrop
The US economic backdrop is very mixed. Like many other developed nations, inflation is too high and interest rates have been increased aggressively to reduce demand and get inflation back to the US Federal Reserve Bank’s 2% average inflation target. On the latest measure of monthly consumer prices, annual inflation was at 8.2% over the year, down from a peak of 9.1% in June but still in a range that is at a 33-year high. Inflation is expected to slow from here as supply chain bottlenecks have improved which is positive for goods prices, commodity prices are down from their earlier peaks and consumer demand is starting to slow. However, inflation is still likely to remain high in 2023, at around 4-5% per annum.
US interest rates are expected to reach around 5% in early 2023 (currently the fed funds rate is in a range of 3.75%-4%). The 30-year mortgage rate has already increased significantly, to 6.4% as at October from 2.6% at the beginning of the year. As a result, it is not surprising to see that leading indicators are pointing to an imminent growth slowdown. Business surveys have weakened for the services sector while manufacturing still looks okay its weakened significantly, small business confidence is at its lowest level since 2014 (notwithstanding Covid-related weakness) and CEO business confidence is at its lowest since the Global Financial Crisis. The consumer environment is mixed. The labour market remains strong, with the unemployment rate currently at its lowest level in 53 years at 3.5%. Household accumulated savings are still high and are worth $1.4tn, but are being drawn down. But, consumer sentiment (according to University of Michigan) is tracking around historical lows and the volume of retail spending has turned negative (see the chart below).
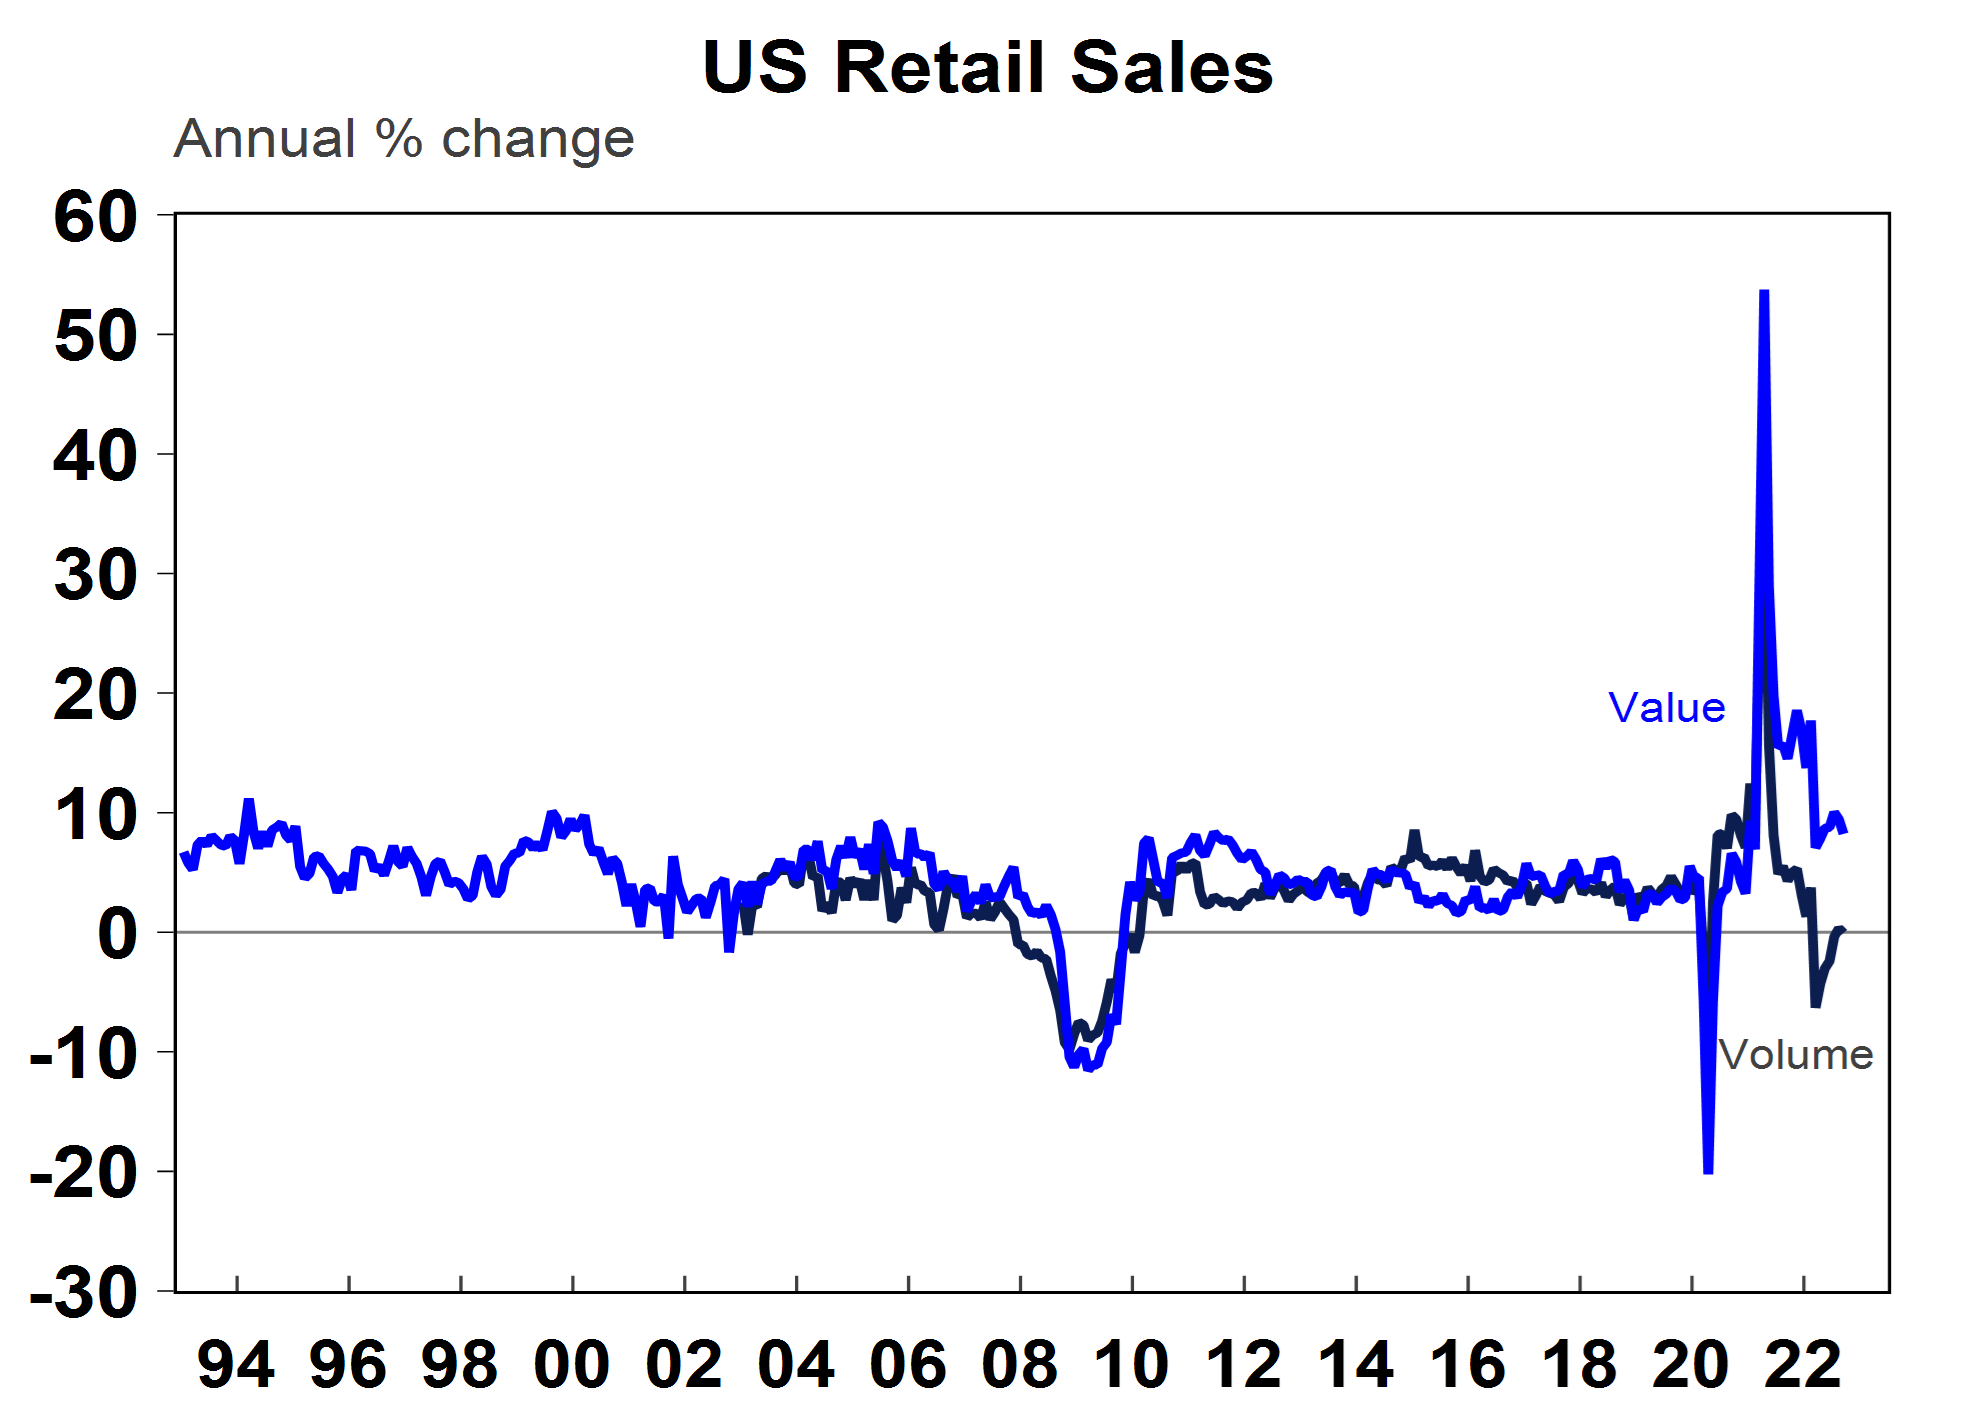
Source: Macrobond, AMP
With interest rates expected to rise further into 2023, the risk of a US recession in the next 12 months is high. While a US recession is not our base case forecast (we see near-term inflation surprising to the downside which will be positive for corporate and consumer purchasing power and should mean a peak in interest rates soon), clearly the risk of recession is high (at around 40-50% in our view). We expect US GDP growth to be low in 2023, at below 1% (more normal levels of growth is around 2-3% for the US). Markets have priced in some risk of a recession, as indicated by the inverted 2/10-year bond yield, but earnings estimates (up by ~4% over the year to September or -3% excluding energy) are still holding up much better than in a typical recessionary environment.
The growth backdrop will influence midterm election voting. If you track President Biden’s approval rating to gas prices (see the chart below), there is a positive correlation. President Biden’s approval rating bottomed in July at 38%, a month after gas prices peaked and picked up to its current level of 42% as gas prices fell and as the decision to overturn Roe v Wade also led to a rebound in support for the Democrats.
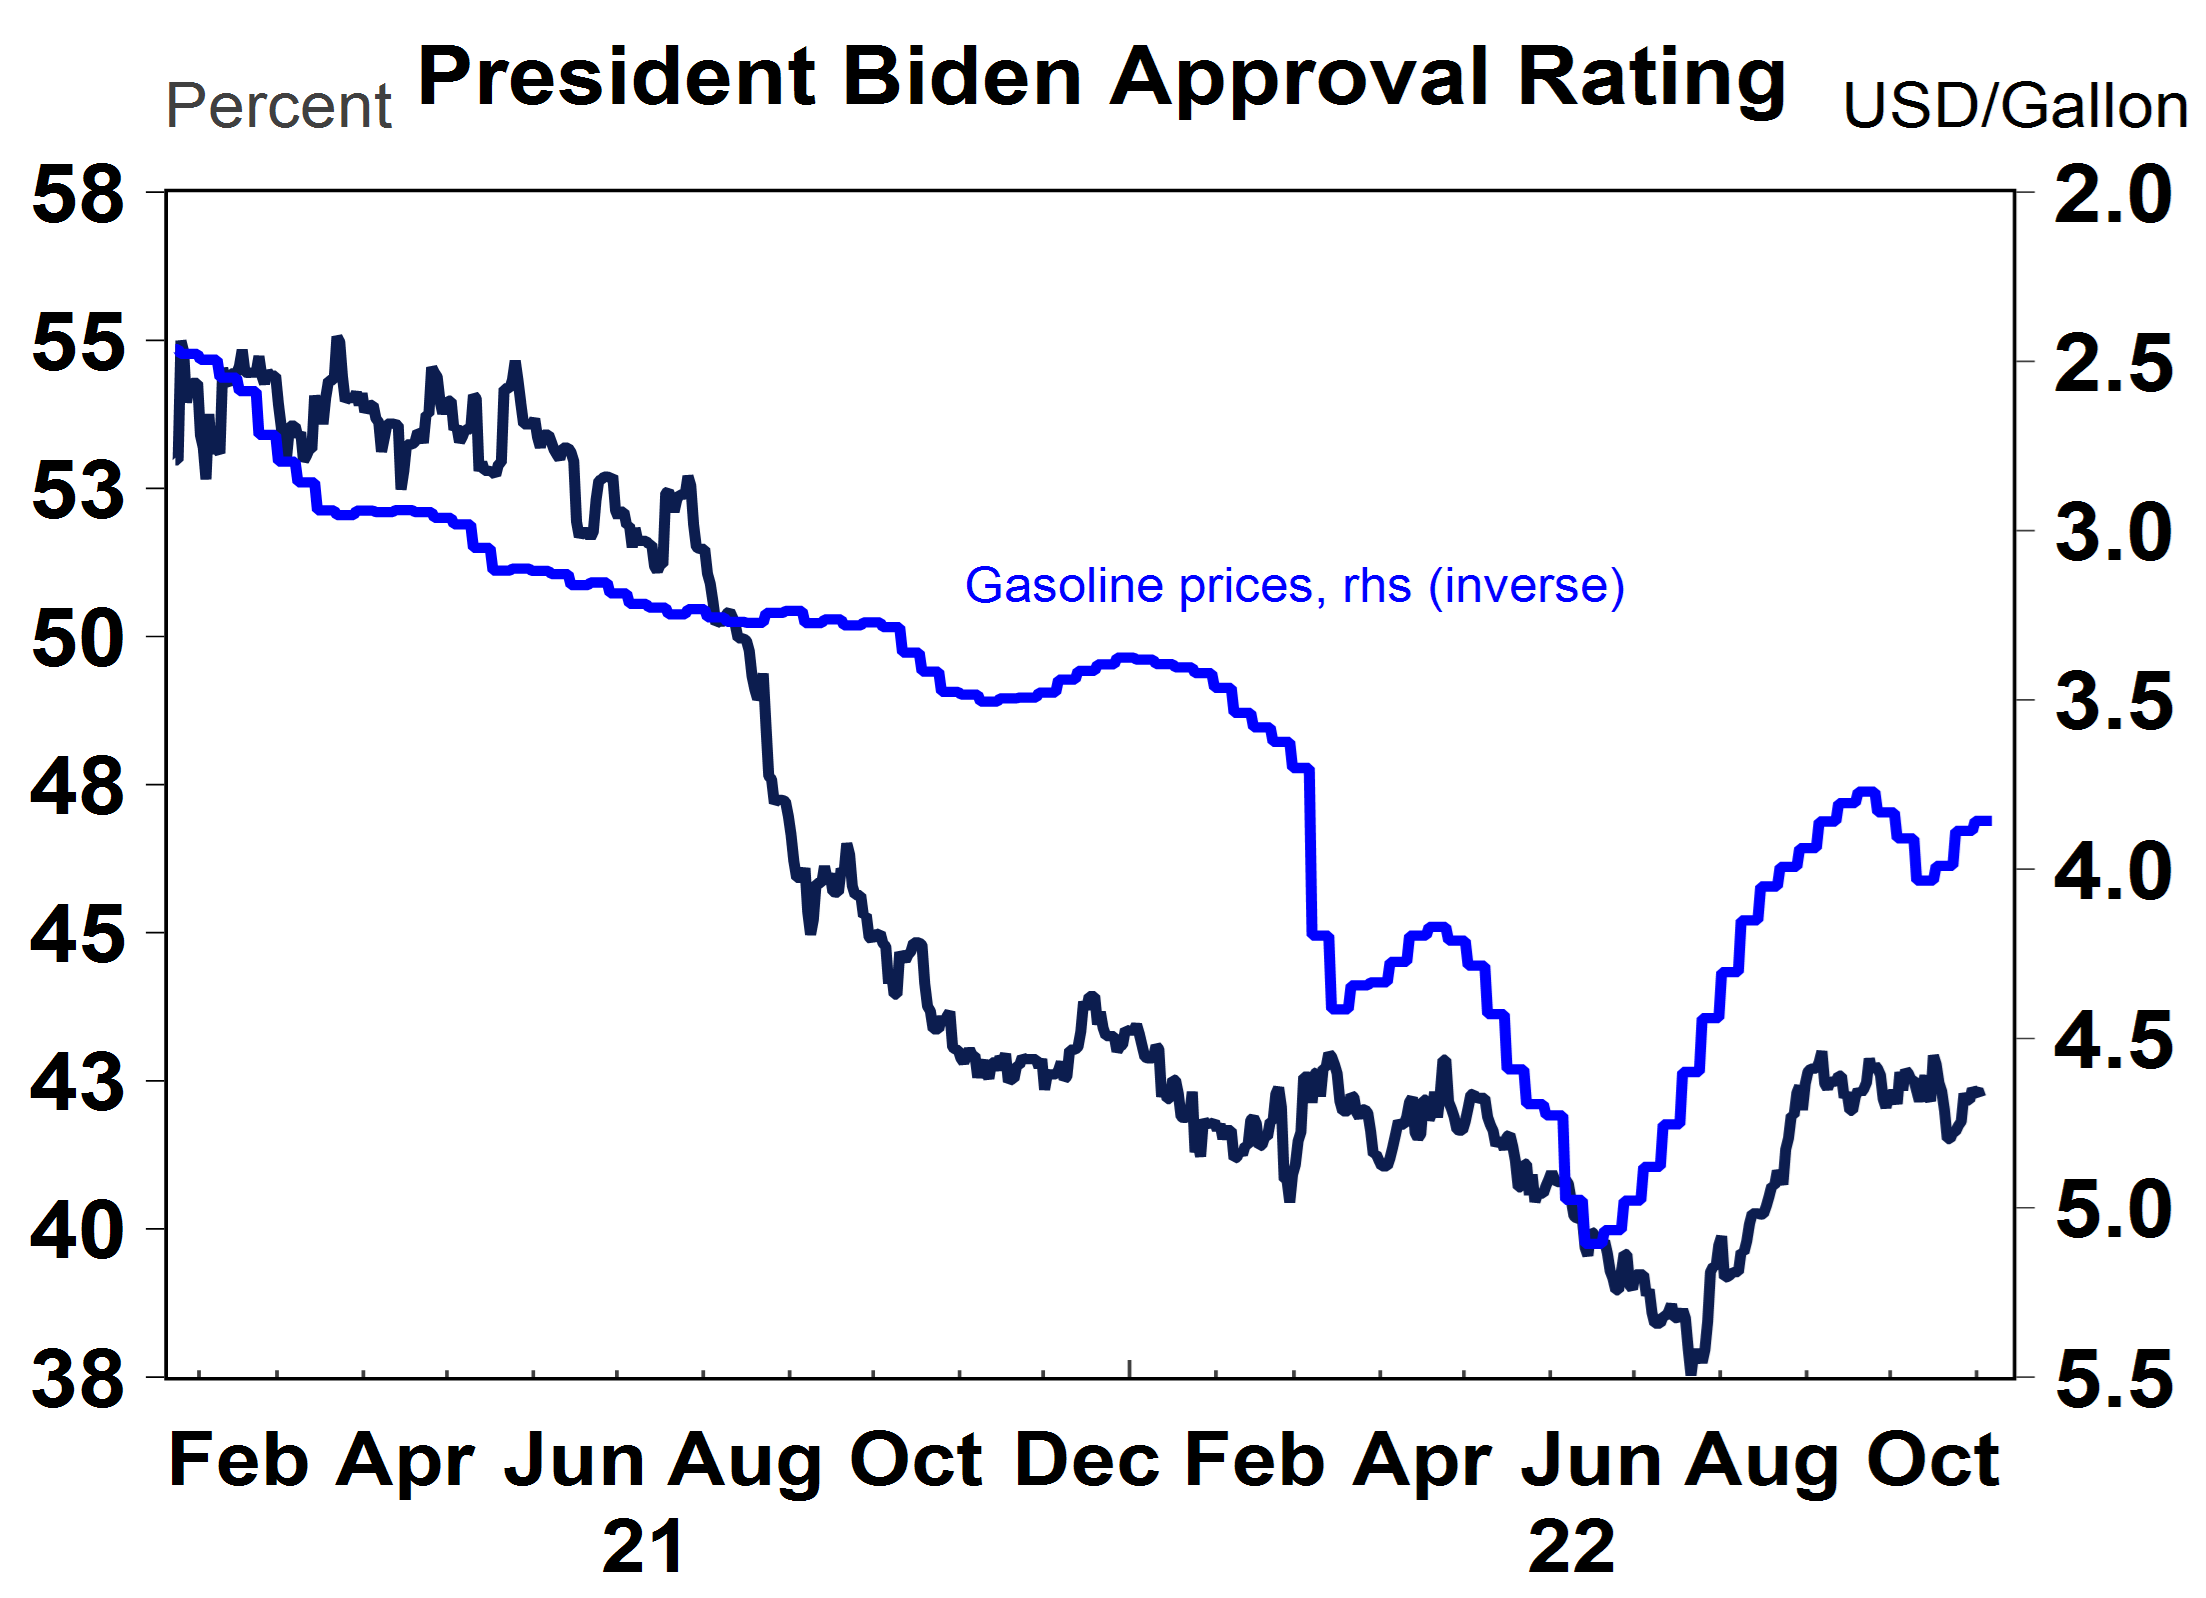
Source: Macrobond, AMP
The midterm election and market impacts
The US presidential election occurs every four years (the next one is due in 2024), with midterm congressional elections held in between, with all seats in the House of Representatives (lower house) and a third of the Senate (upper house) up for re-election. The midterms will be held on Tuesday 8 November. As things currently stand, the Democrats has a small majority in the House and an even 50-50 split in the Senate (with Vice President Kamala Harris having the tie-breaker vote). A change in the Democrat’s control of either the House or Senate has implications for fiscal policy because it means that policy needs to get support from the opposition (so ends up being more bipartisan). It is typical for the governing party to lose seats in the midterms.
The current polls indicate that the Democrats will lose the House of Representatives, with a 90% chance of a Republican victory (see the chart below), with polls favouring the Republicans all year.
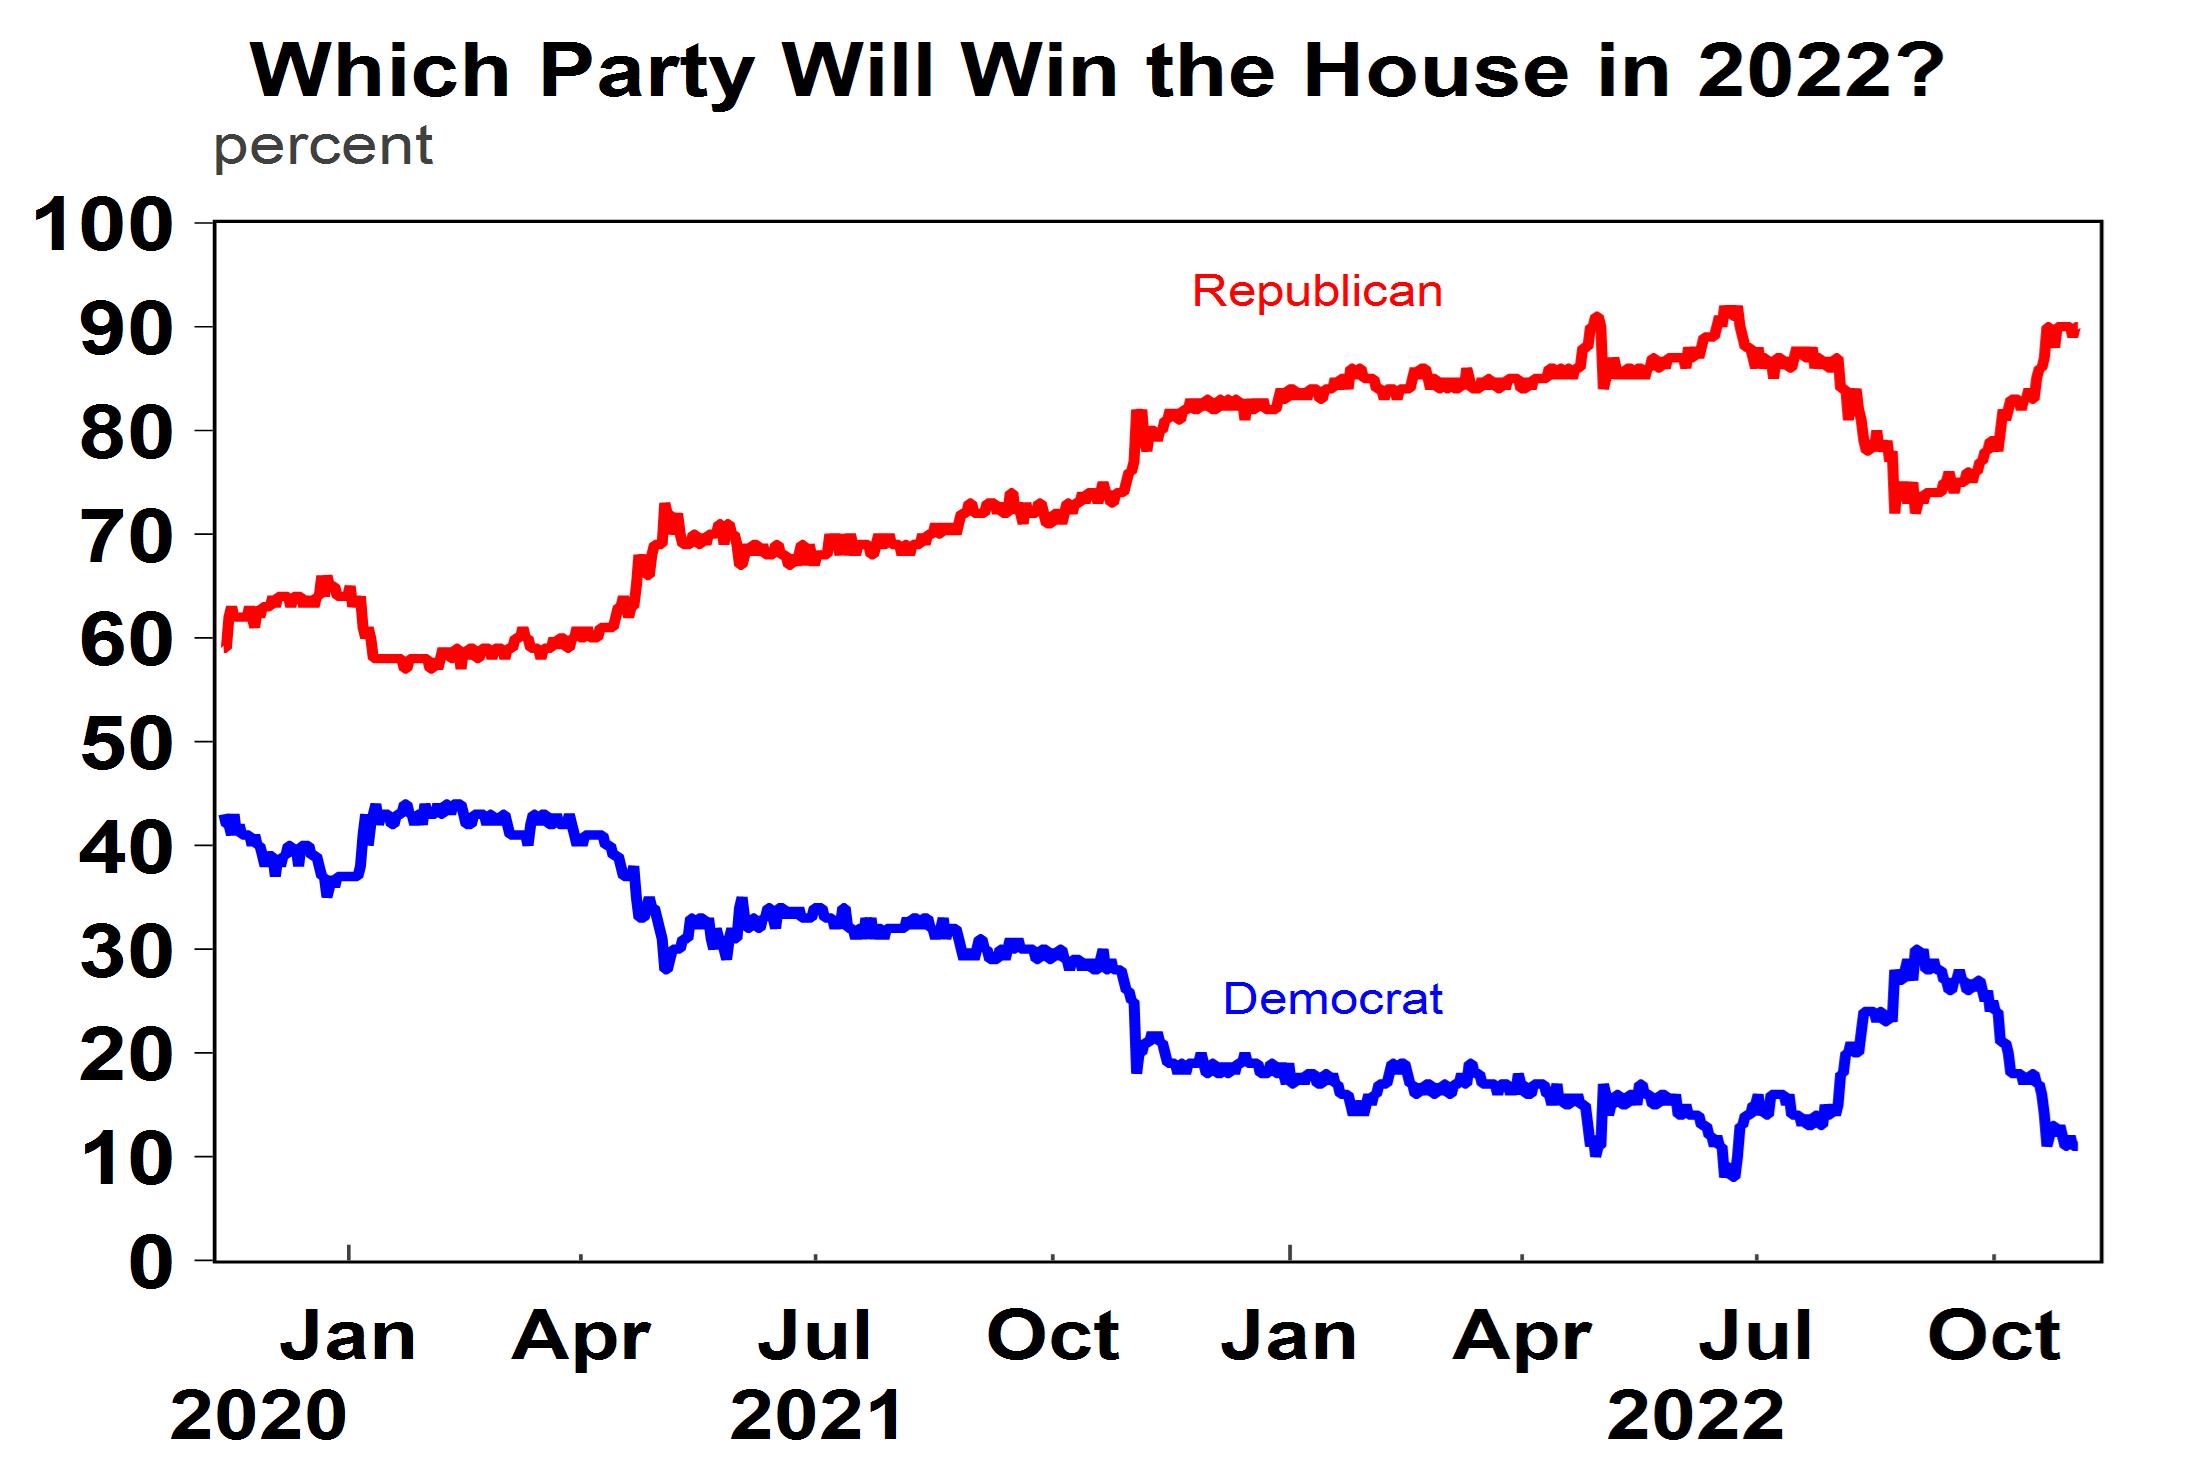
Source: Macrobond, AMP
However, the Senate is more contentious, as the odds favoured the Republicans prior to July-22 and swung to a ~65% chance of a Democrat Senate victory before swinging back to the Republicans most recently, with a 70% chance of Republican Senate victory (see the chart below). So, the risk for a Senate majority are fairly even between both parties.
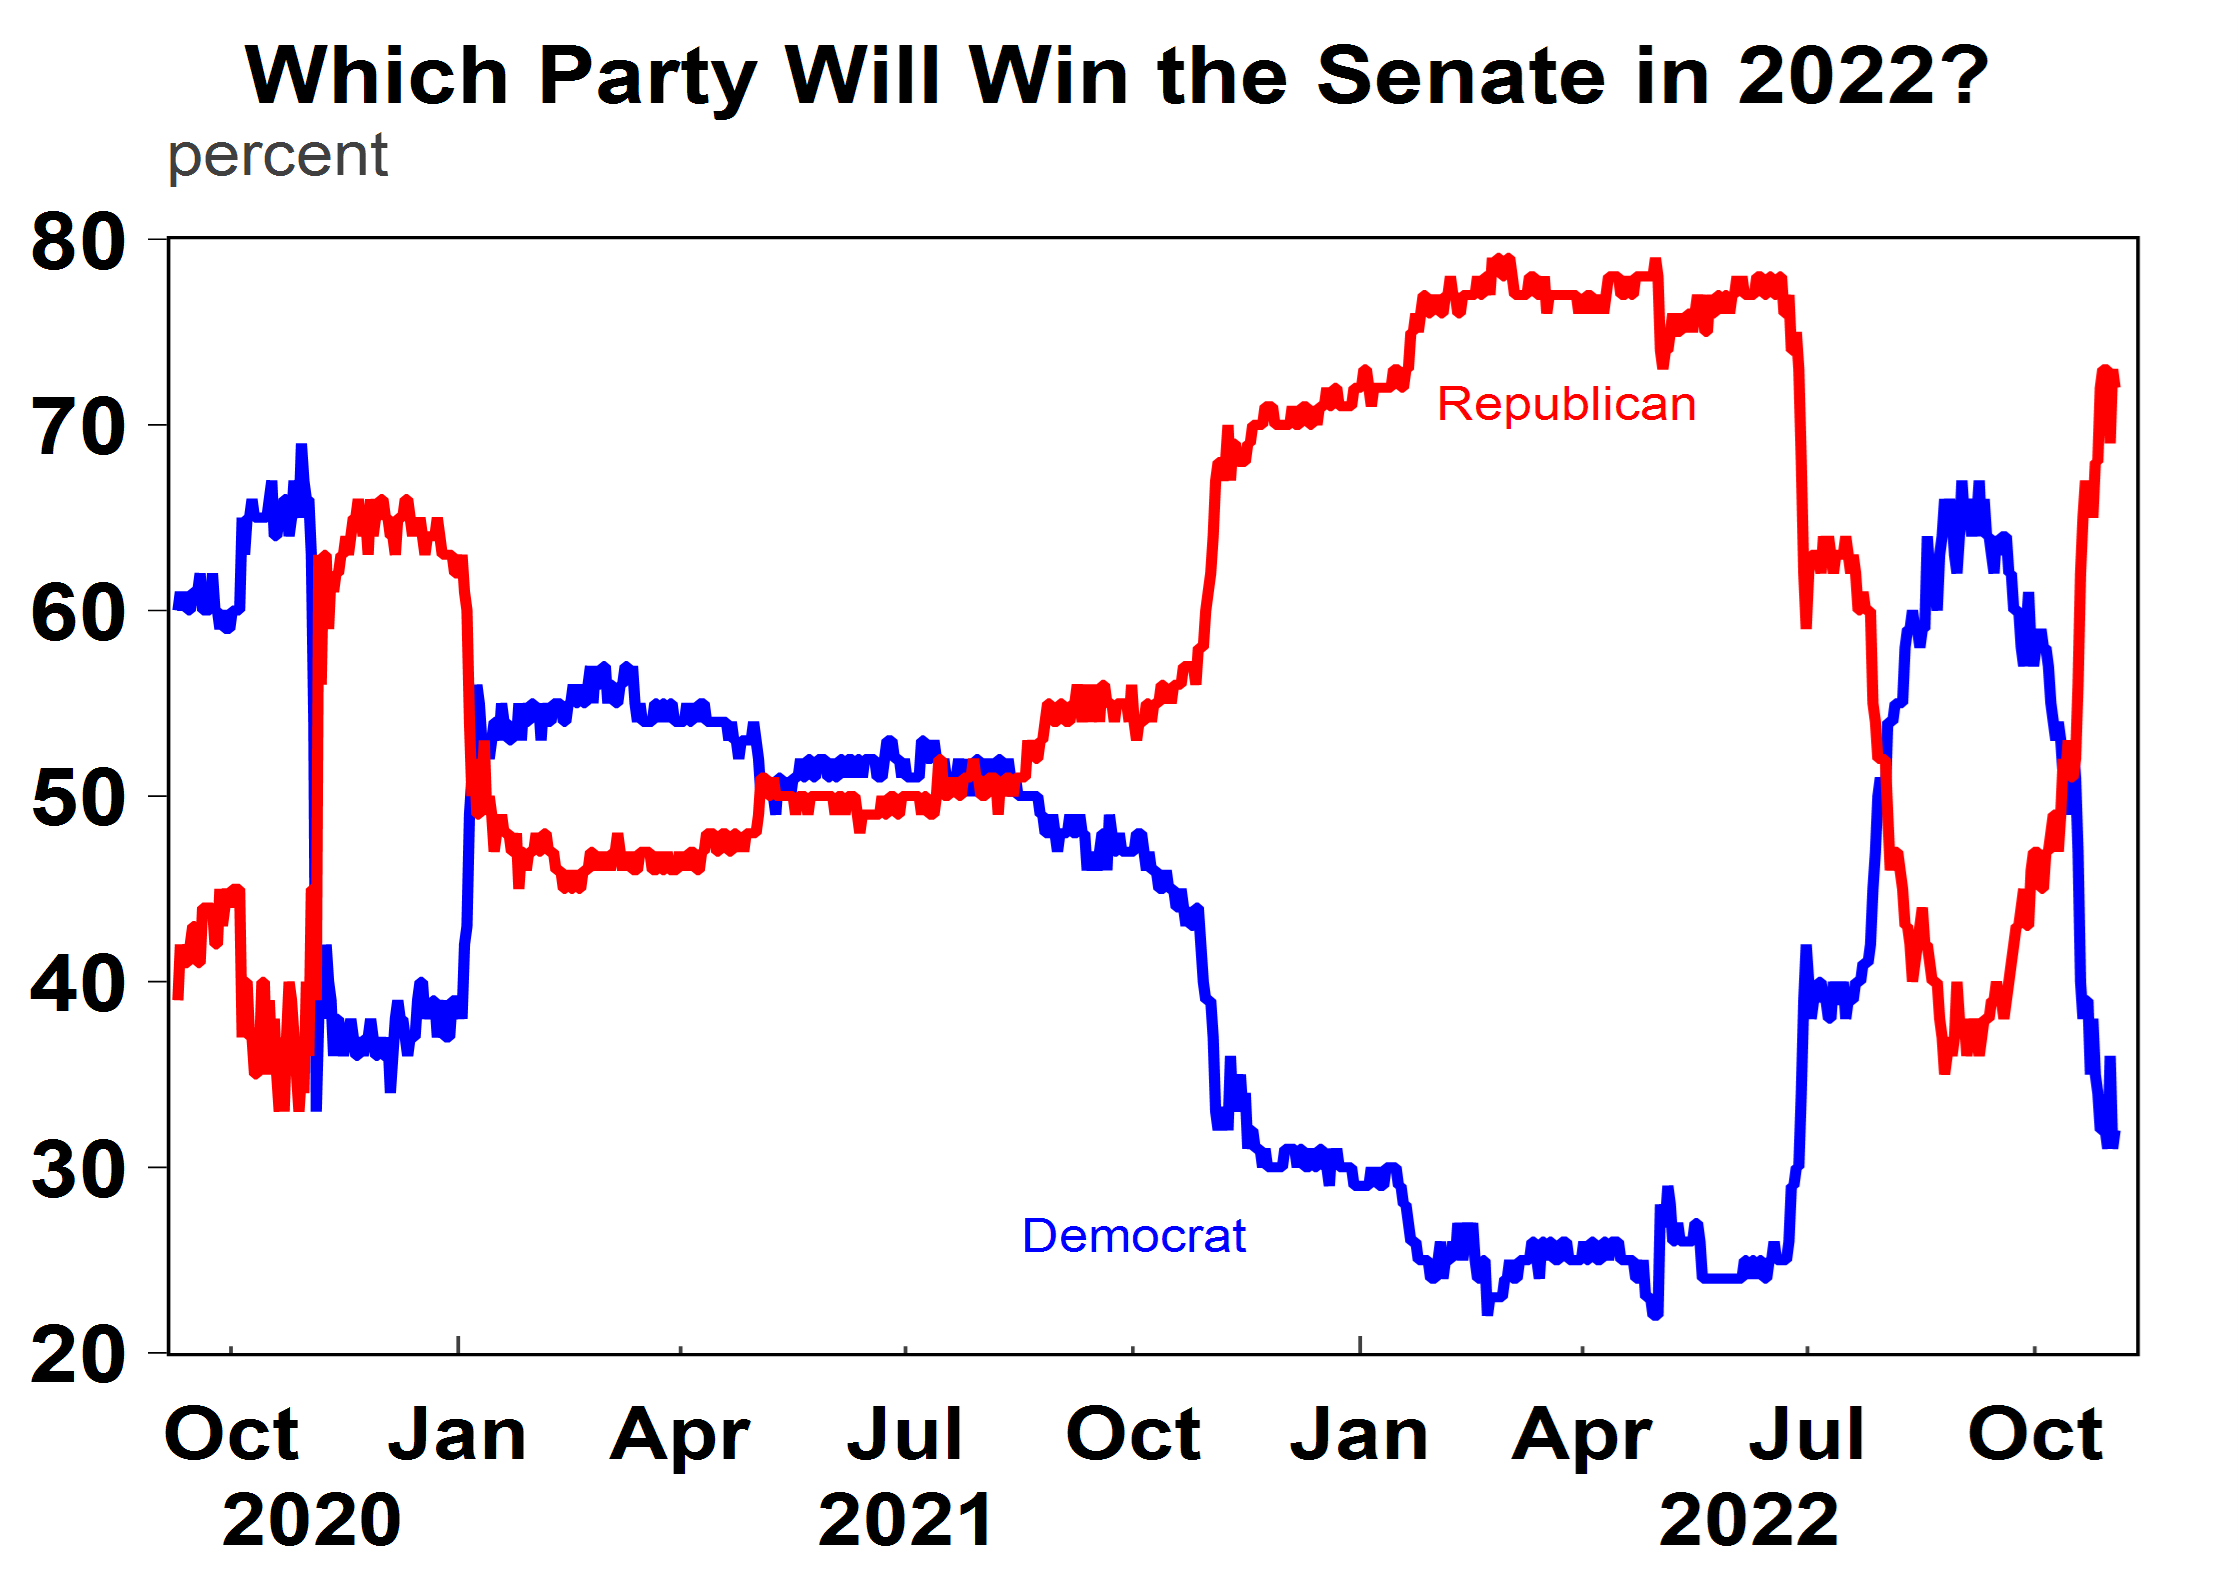
Source: Macrobond, AMP
The most likely outcome from the midterms is “gridlock” in Congress – the Republicans will control the House and/or Senate. This usually means that extreme policies are watered down (which is positive for sharemarkets) but it could also result in policy paralysis (when nothing is agreed upon). A unified Republican Congress (rather than the Republicans having control of either the House or Senate) would be more favourable for sharemarkets because it would reduce the risk of policy paralysis.
Sharemarkets tend to underperform in the year to June of the midterm election year with returns averaging 8% (versus a historical average return of 12% per annum) and perform well in the year after the midterm election with returns averaging 19% (see the chart below). The explanation for this trend is because a source of uncertainty is removed, and gridlock means that more centrist policies tend to be pursued.
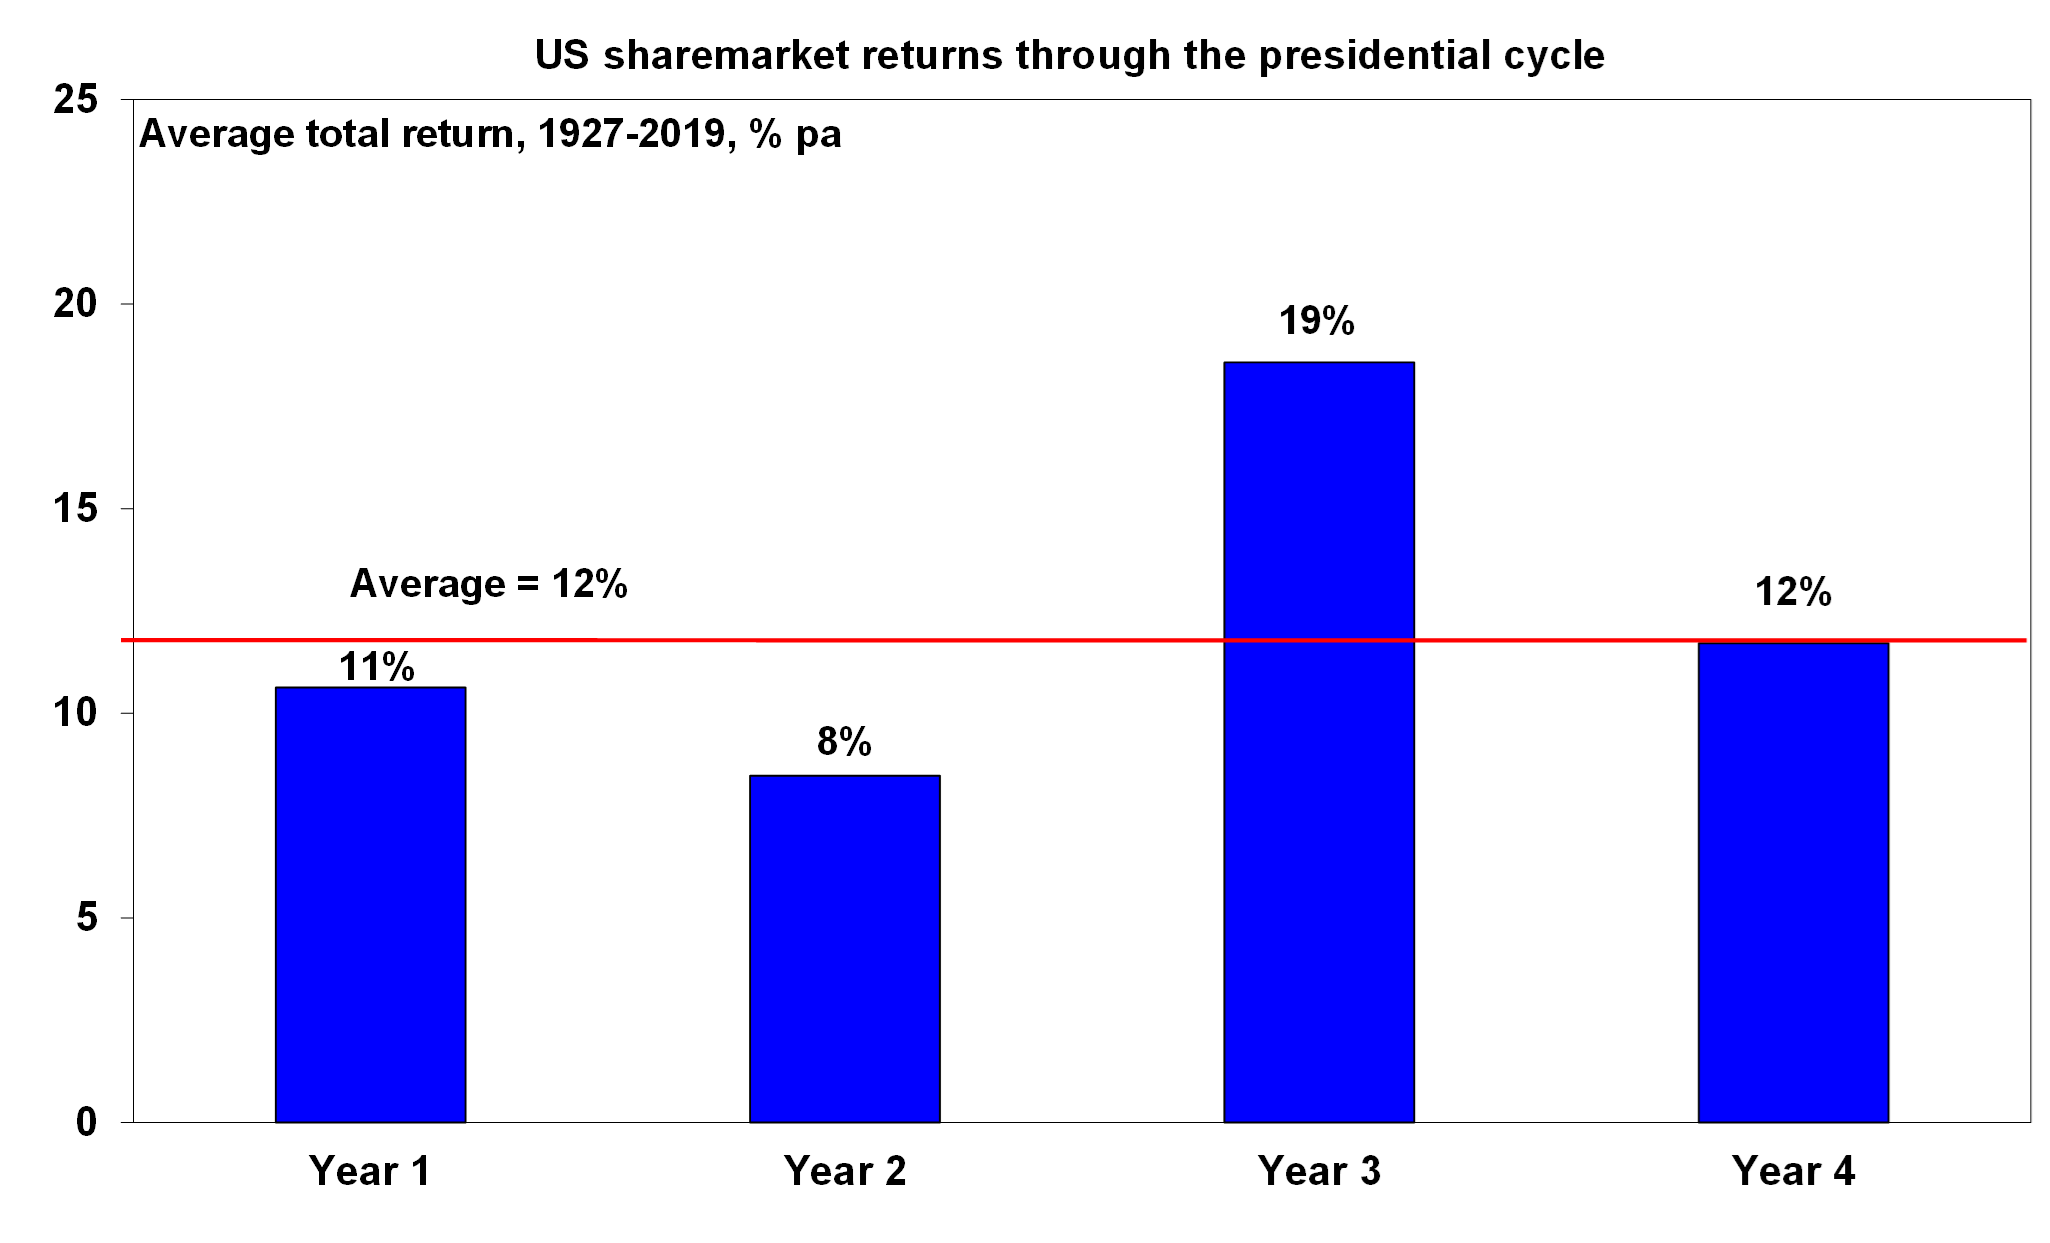
Source: Bloomberg, AMP
For GDP growth, the outcomes follow similar patterns to sharemarkets (see the chart below). In the 4-year Presidential cycle, year 3 tends to be the most positive for GDP growth as governments pursue election and growth friendly policies to get re-elected in the midterms (and policy changes have a lagged impact to actual GDP growth). Year 1 GDP growth also tends to have above-average growth, also reflecting growth-friendly policies pursued in Year 4 to get re-elected for another term which also has a lagged impact to actual growth outcomes.
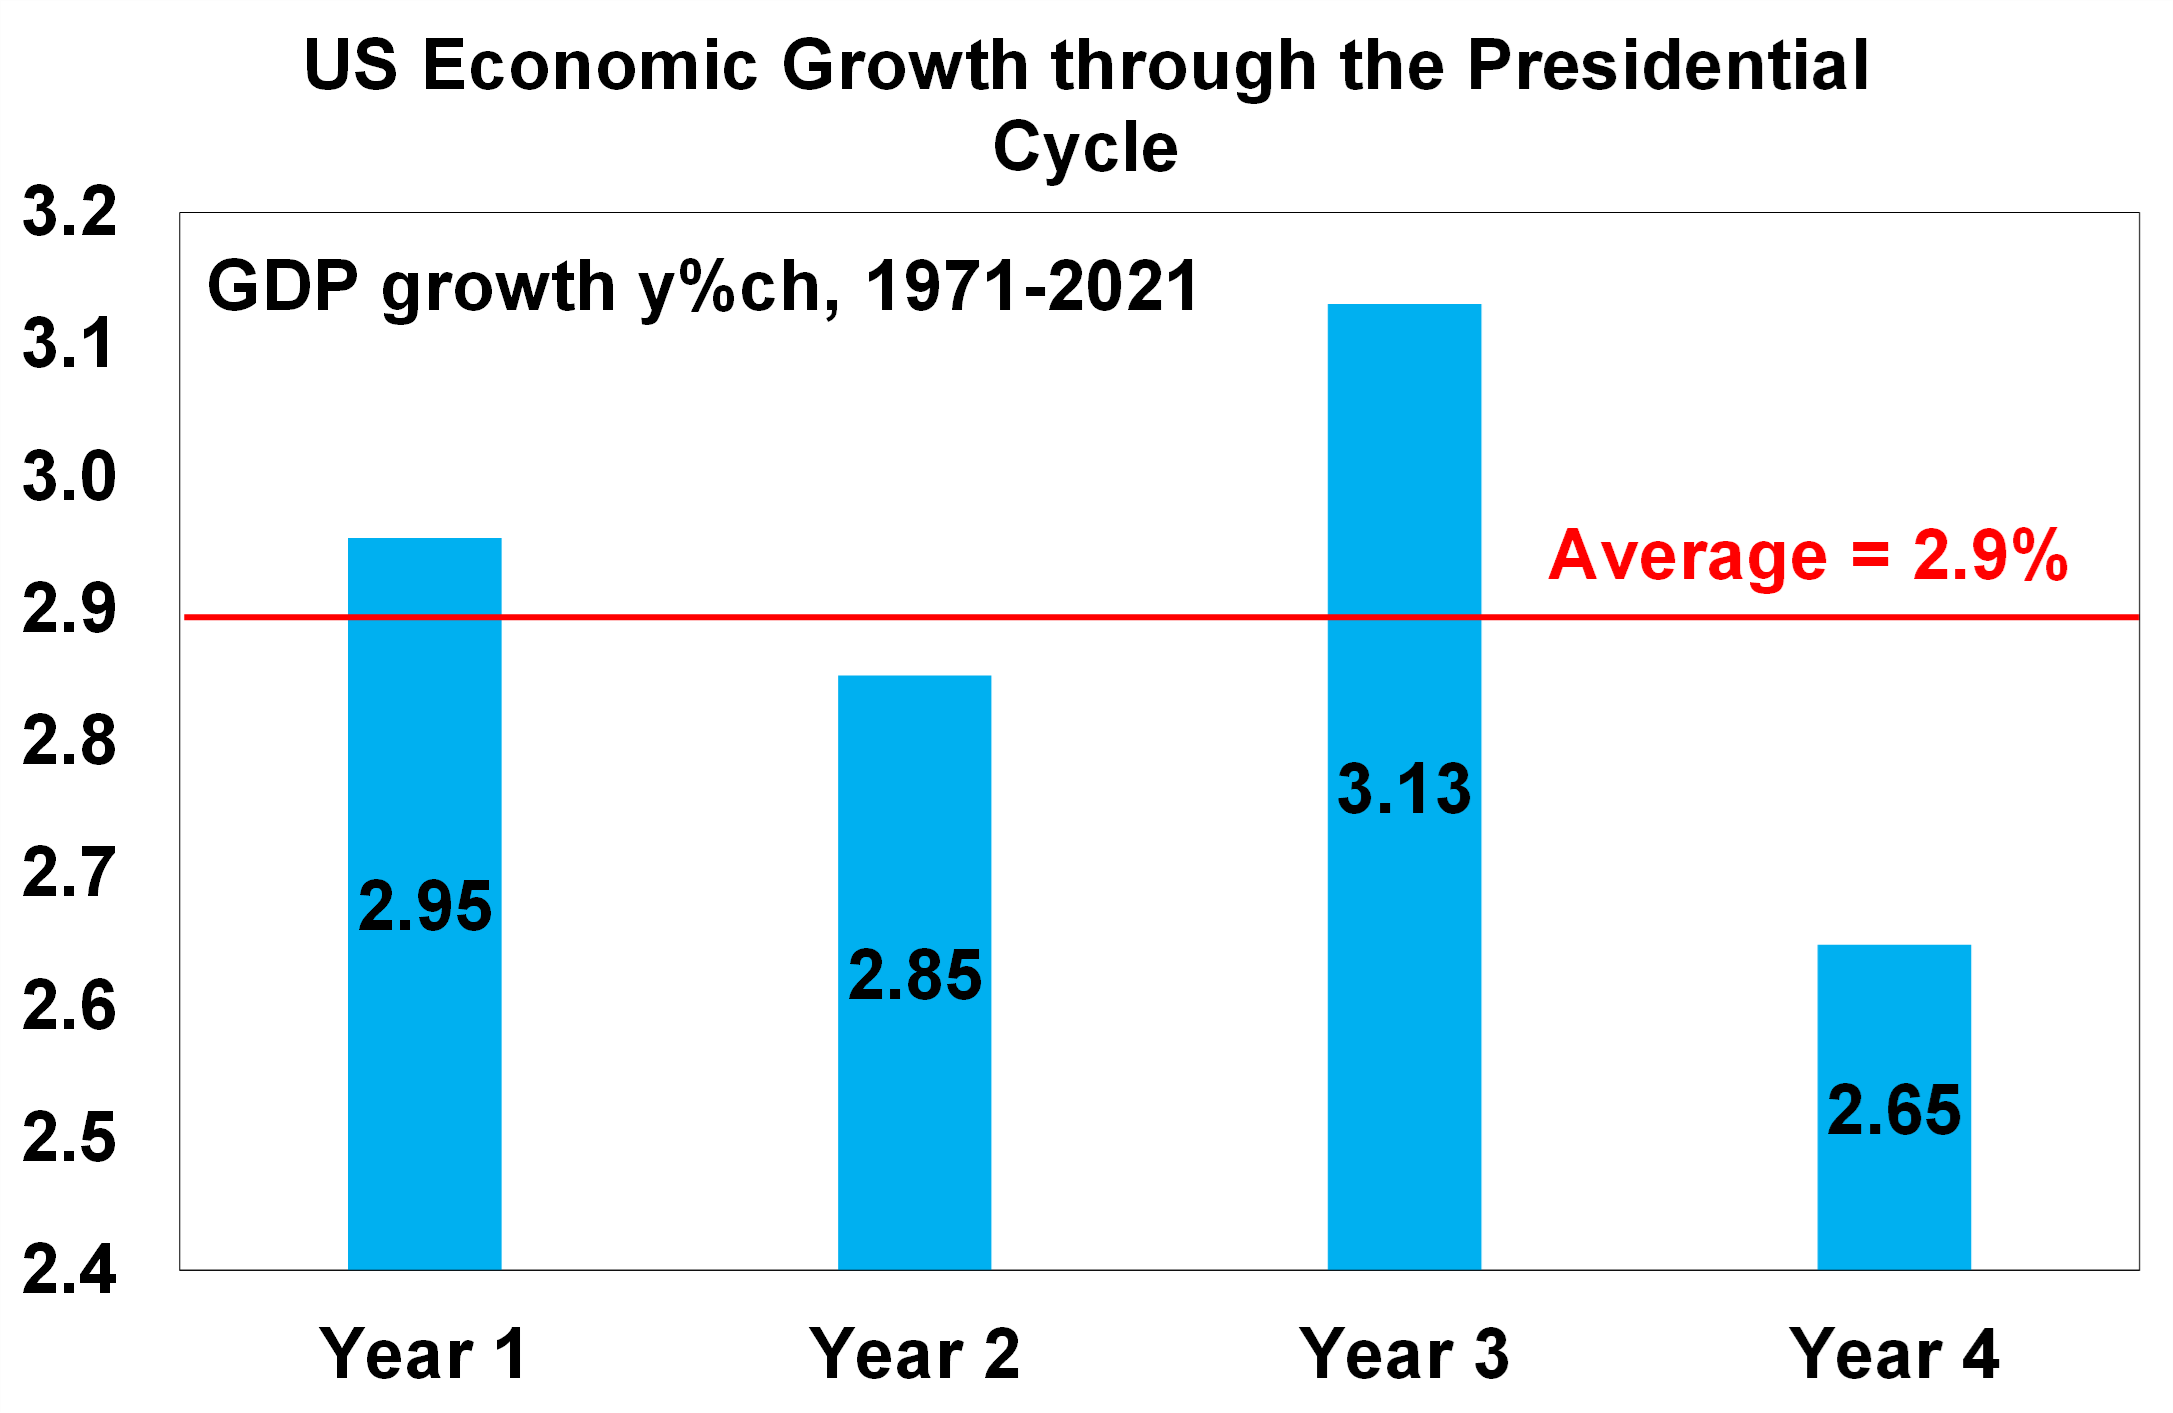
Source: Bloomberg, AMP
Key potential policy changes that are important to watch after the midterms are resolutions around the debt ceiling (which is likely to be reached in early 2023) and funding for the government which will need to be agreed upon in December by either passing a short-term resolution to keep government funded for a short period or a longer-term policy to fund spending for the whole fiscal year (up to 30 September 2023).
Conclusion
The US economic growth backdrop is very challenging for the next 6-12 months as interest rates continue to rise and inflation remains elevated (although lower than recent outcomes), and the risk of recession is high. While a US recession is not our base case forecast, we expect low US GDP growth of around 1% in 2023. However, the implications for sharemarkets may not be as negative. US shares have already fallen significantly (down by 20% since the beginning of the year) and if a recession is avoided, there could be room for equities to rally. As well, history suggests that the year after the midterm elections is positive for US sharemarkets.

Weekly market update 26-07-2024
26 July 2024 | Blog Dr Shane Oliver discusses the risk off as tech hit continues; correction risks into August/September; global rate cutting cycle underway; Australian June quarter CPI to rise but the hurdle to another RBA rate hike should be high; and more. Read more
Oliver's insights - rise of populism and bigger government
24 July 2024 | Blog This article takes a look at the rise of populism and what it means for economic policies and investors. Read more
Weekly market update 19-07-2024
19 July 2024 | Blog This week shares are down; US election/Trump prospects starting to impact; global rates easing cycle on track; China Plenum; Australian jobs still tight but easing so RBA needs to be careful; and more. Read moreWhat you need to know
While every care has been taken in the preparation of this article, neither National Mutual Funds Management Ltd (ABN 32 006 787 720, AFSL 234652) (NMFM), AMP Limited ABN 49 079 354 519 nor any other member of the AMP Group (AMP) makes any representations or warranties as to the accuracy or completeness of any statement in it including, without limitation, any forecasts. Past performance is not a reliable indicator of future performance. This document has been prepared for the purpose of providing general information, without taking account of any particular investor’s objectives, financial situation or needs. An investor should, before making any investment decisions, consider the appropriateness of the information in this document, and seek professional advice, having regard to the investor’s objectives, financial situation and needs. This article is solely for the use of the party to whom it is provided and must not be provided to any other person or entity without the express written consent AMP. This article is not intended for distribution or use in any jurisdiction where it would be contrary to applicable laws, regulations or directives and does not constitute a recommendation, offer, solicitation or invitation to invest.
The information on this page was current on the date the page was published. For up-to-date information, we refer you to the relevant product disclosure statement, target market determination and product updates available at amp.com.au.