Key points
- The Australian labour market has remained resilient in the past two years despite a softening GDP growth backdrop.
- While employment and GDP growth often move up and down together, they have diverged in this cycle. Instead, hours worked and GDP growth have had a better correlation. This probably reflects the idea that firms expect weak GDP growth to be transitory and are hoarding onto staff, especially given recent staff shortage problems.
- The non-market sectors of education and healthcare have accounted for ~60% of employment growth in the past year. Whilst the public sector has been a large contributor to GDP growth, the non-market sectors have had weak productivity growth, which actually weighs on GDP growth.
- We expect GDP growth to slowly improve from here and employment growth to moderate (but not crash). The unemployment rate is likely to go up to 4.5% (from 4.1% currently), which is still low for Australia.
Introduction
The persistent strength in the Australian labour market has occurred against a backdrop of poor GDP growth, which is unusual. We go through this issue in this edition of Econosights.
The historical relationship between GDP and employment growth
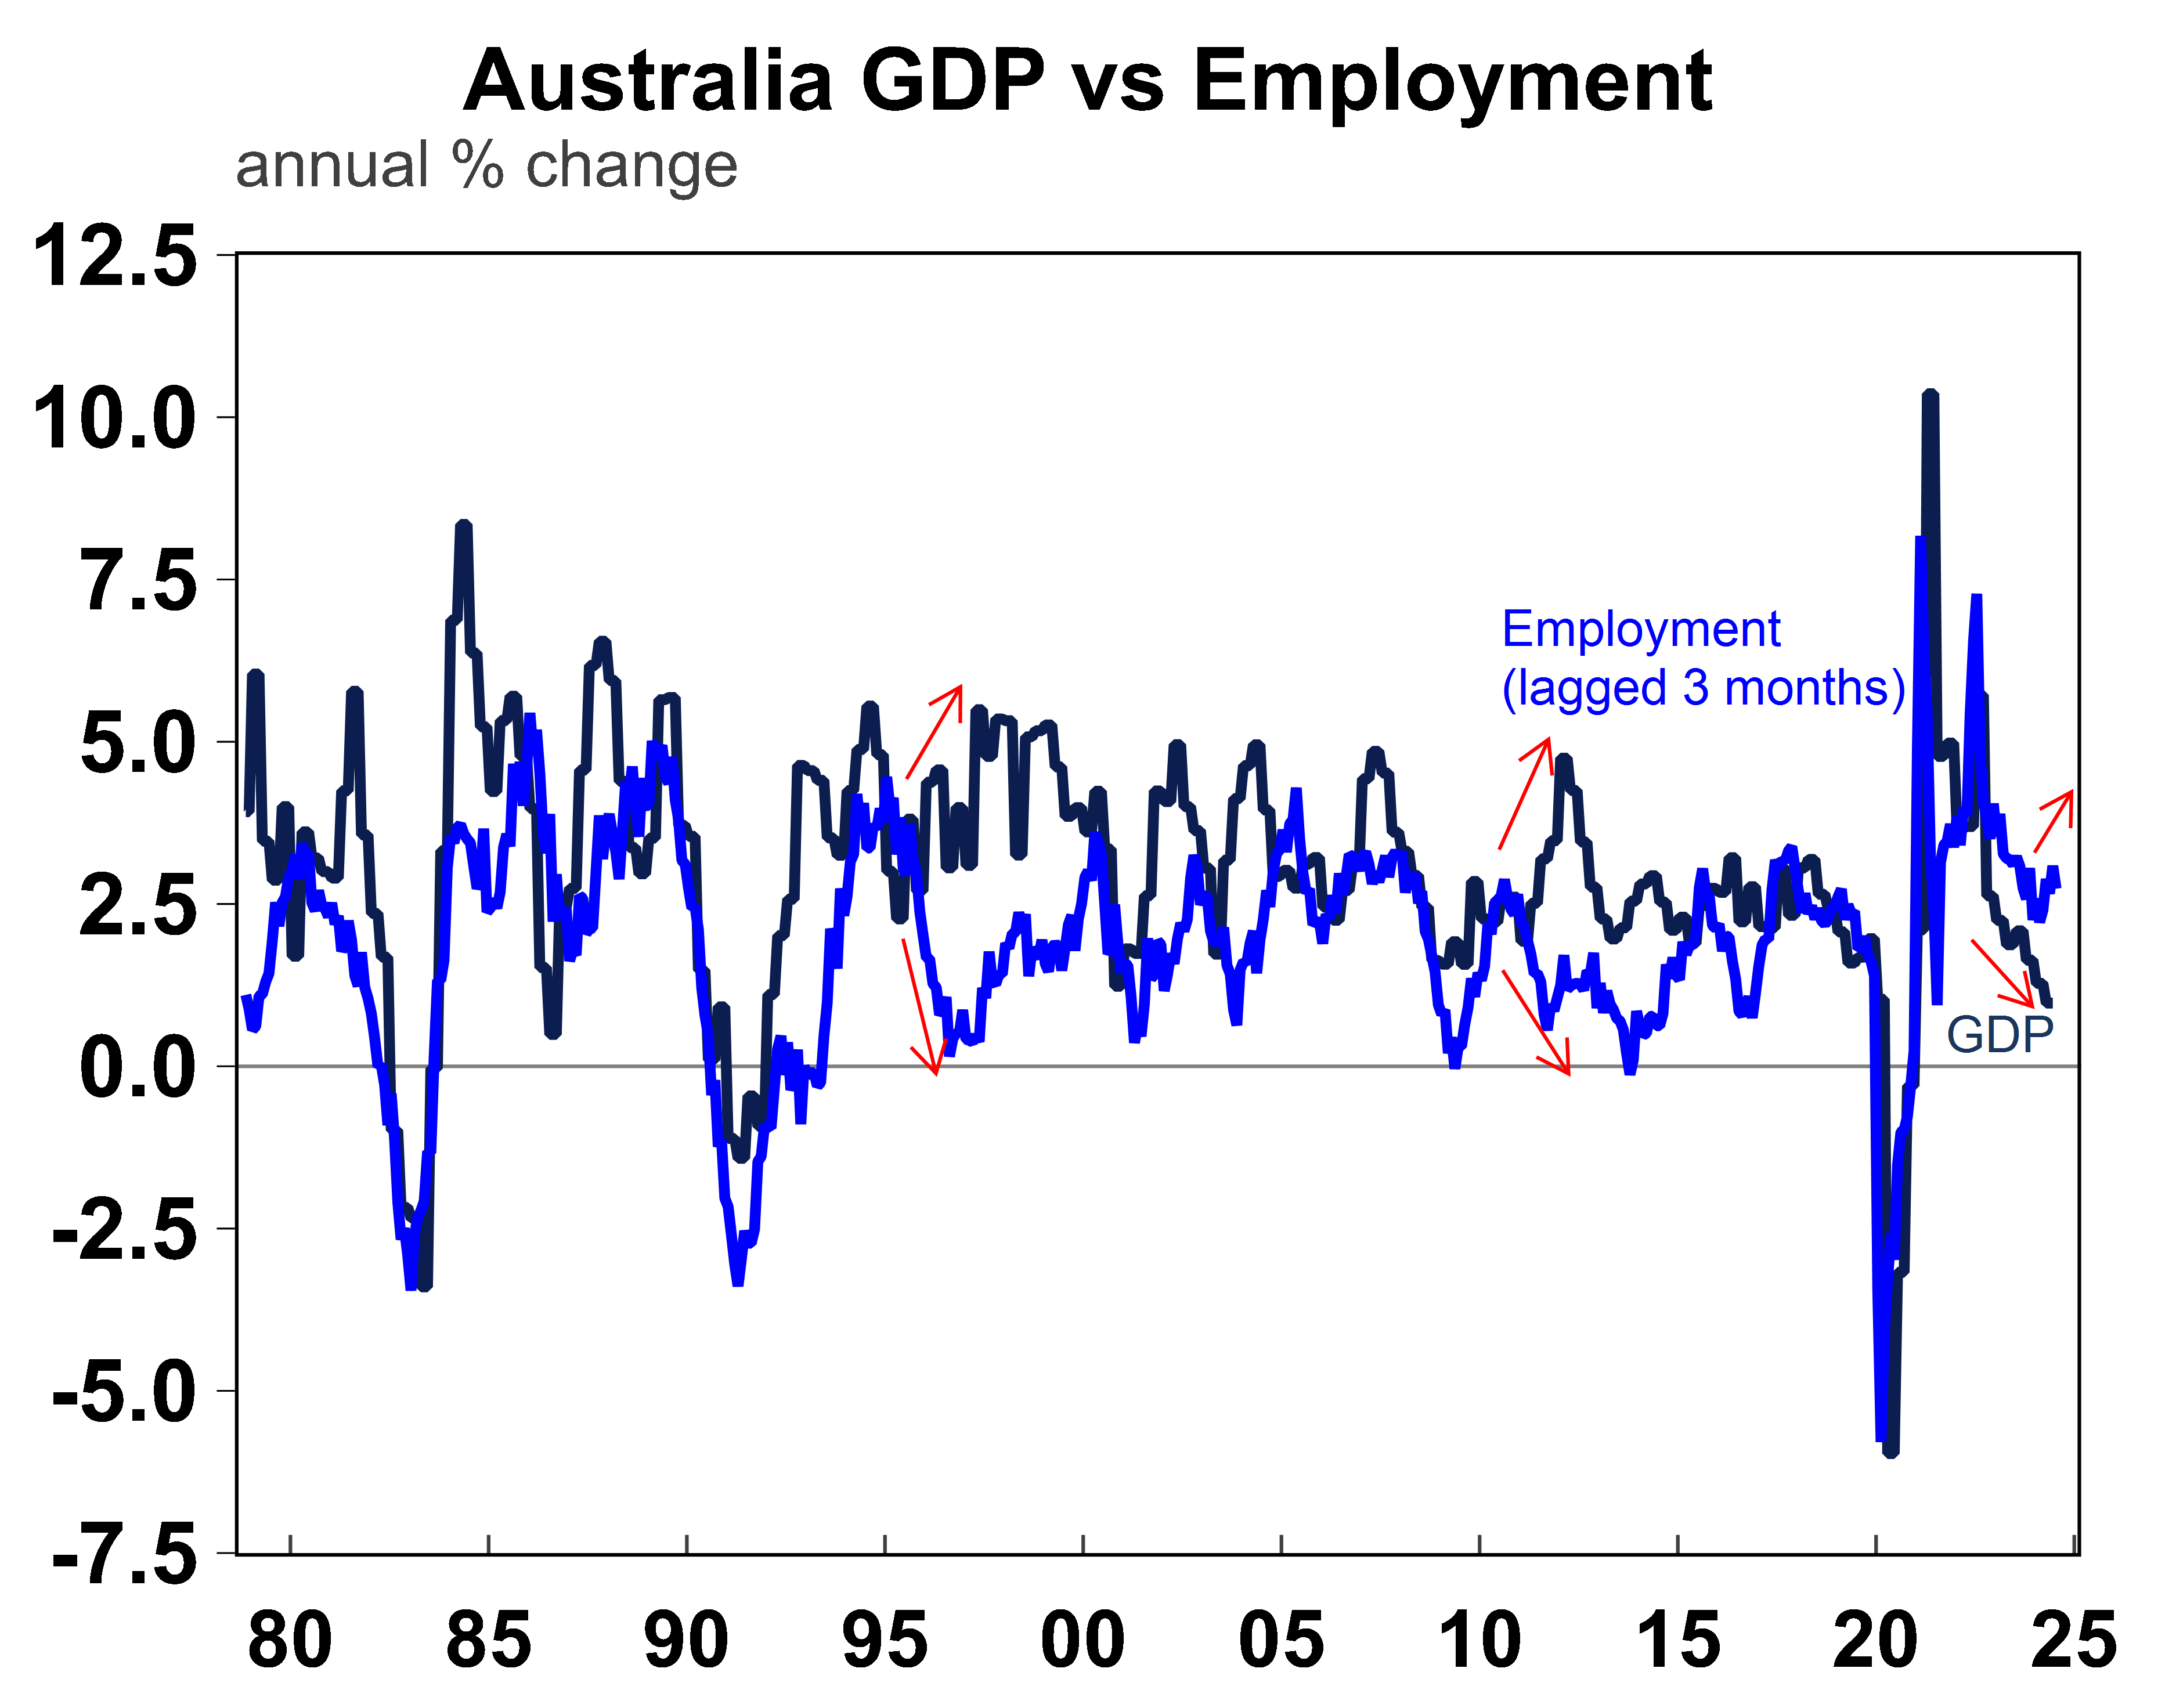
There have been periods of time when GDP and employment growth moved in different directions including in the mid 90s and after the GFC in 2010 (see the chart below).
Source: Macrobond, ABS. AMP
Usually, employment lags GDP growth by ~ 3 months. This is because employment is usually the last thing to change in an economic up or down cycle. When growth starts to pick up, firms will tend to wait and see if the pick up is sustainable before adding additional people to their staff. In a downcycle, firms are reluctant to shed workers until they absolutely have to, because eventually they will need to rehire staff once growth has improved. In the current cycle of slowing GDP growth, firms have arguably been more reluctant to cut back staff, given the experience of the pandemic with the difficulty in being able to recruit and find appropriate staff, which costs the business lost productivity in the short-term.
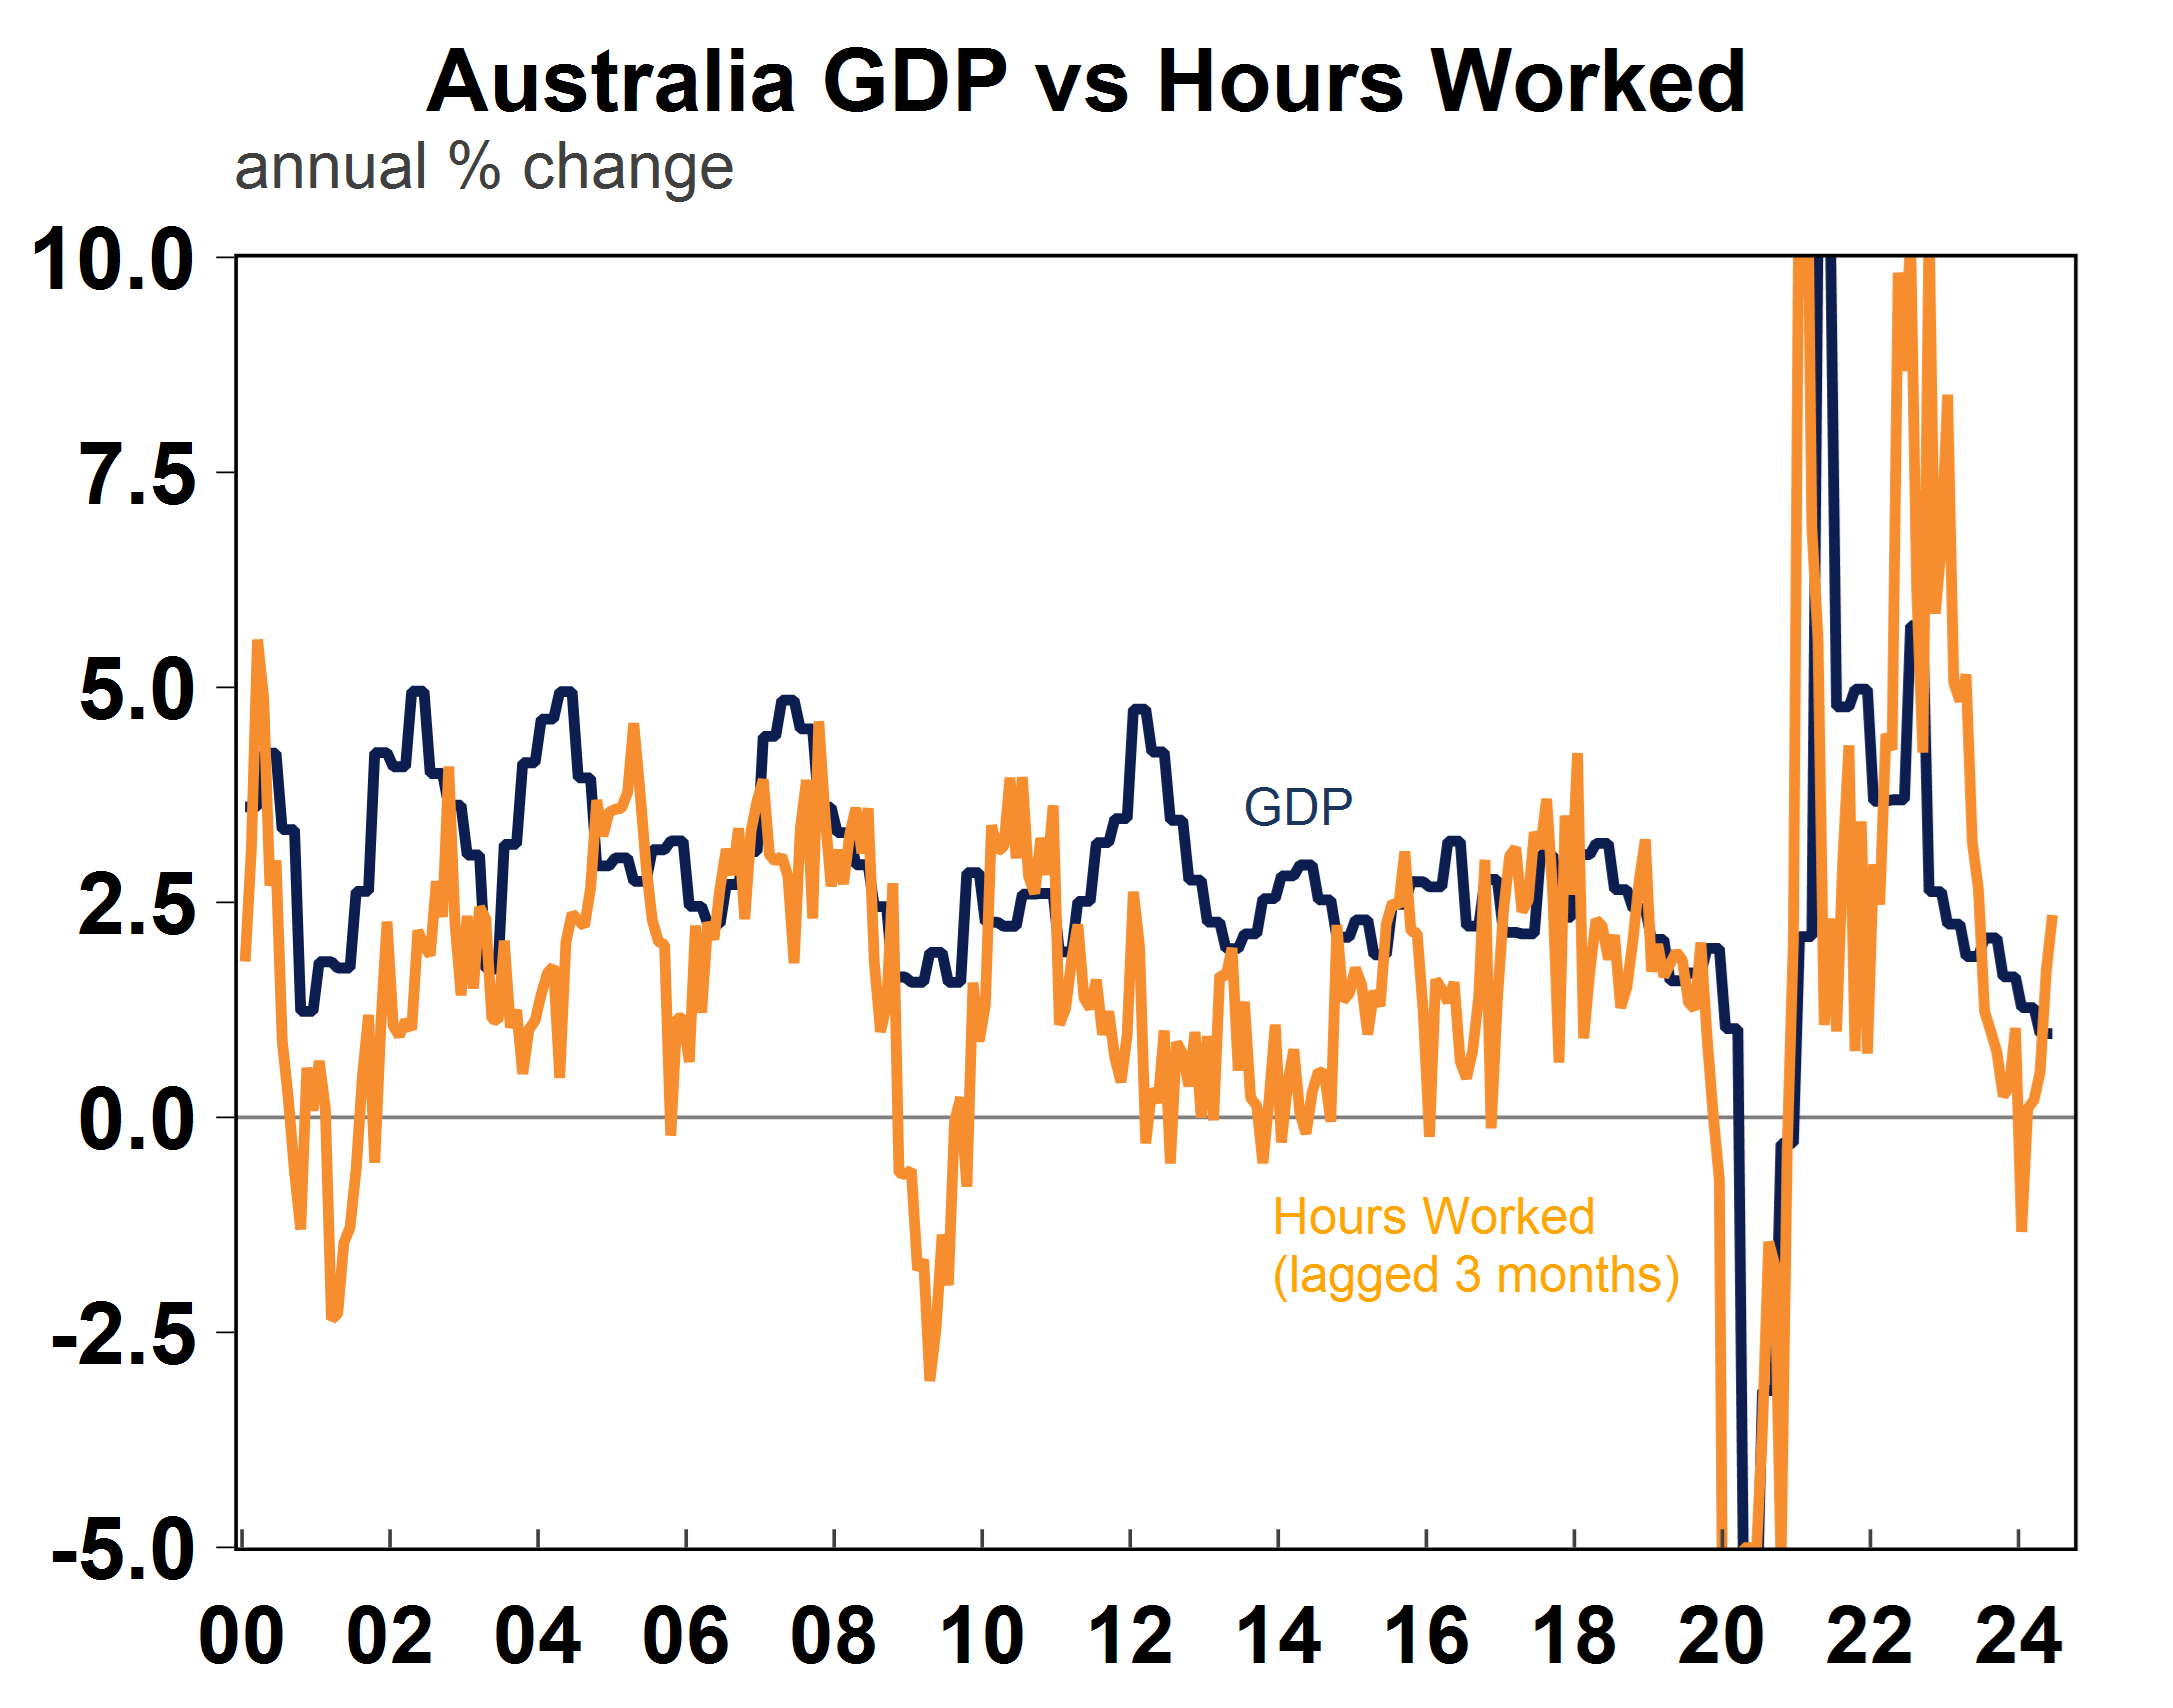
Australian GDP growth has been on a downtrend since 2022, currently running at 1% year on year. Over the same time, employment growth also slowed from over 3% per annum to just over 2% per annum. But over the last few months, employment growth has started lifting again against the backdrop of low GDP growth. Hours worked has moved more in line with the slowing in GDP growth, falling in mid-2024 (see the chart below) as workers hours normalised after very elevated levels in 2023. Hours worked have been rising again recently and are up by 2.5% over the year to September, alongside the pickup in employment growth.
Source: Macrobond, AMP
The divergence between solid jobs growth versus declining hours worked probably reflects this expectation of firms that the recent softness in GDP growth is not permanent and are cutting hours where possible to reduce staff shedding. We expect employment growth to slow over the next year towards 2% by mid-2025, as the supply of workers (immigration growth) decelerates and as demand for workers also moderates, as GDP growth remains pretty weak.
Does the composition of jobs matter?
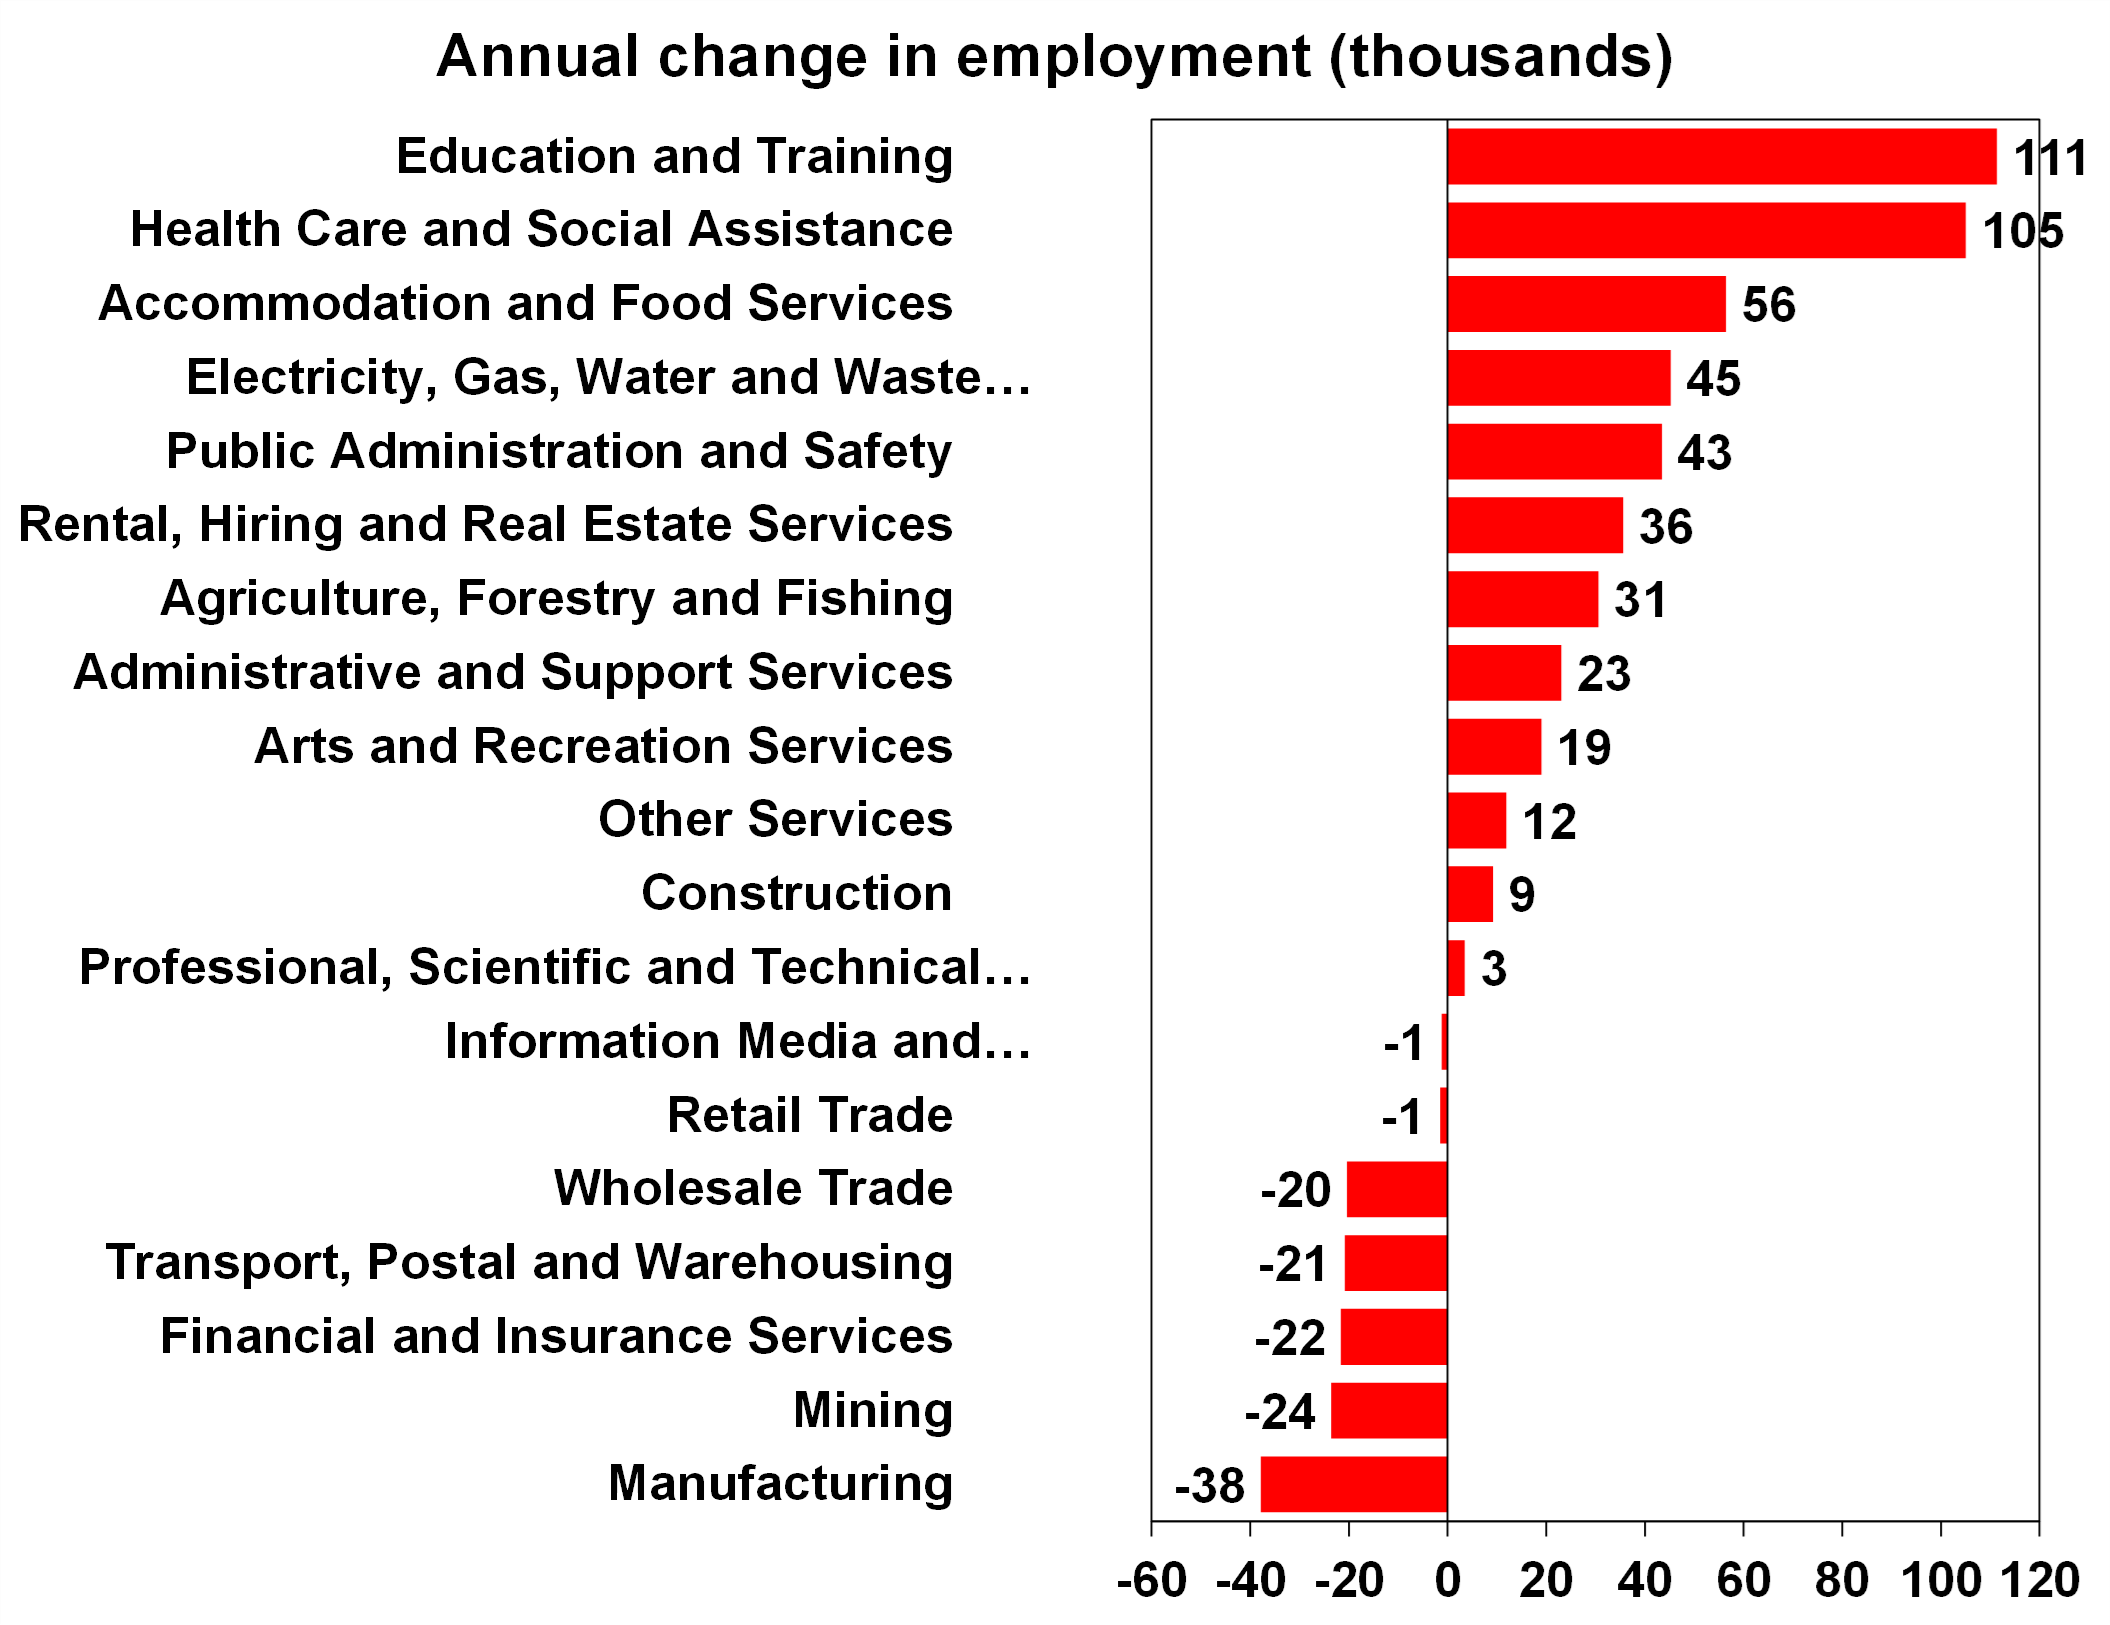
In Australia, jobs growth over the past year has been dominated in the education and healthcare sectors (see the next chart) accounting for nearly 60% of employment gains. This is a massive contribution from direct and indirect public sector funding. Recently, RBA Deputy Governor Andrew Hauser said that the RBA does not really differentiate between jobs – a “job is a job” as it relates to employment.
Source: ABS, AMP
However, the composition of jobs growth across sectors impact GDP growth through the impact of productivity growth.
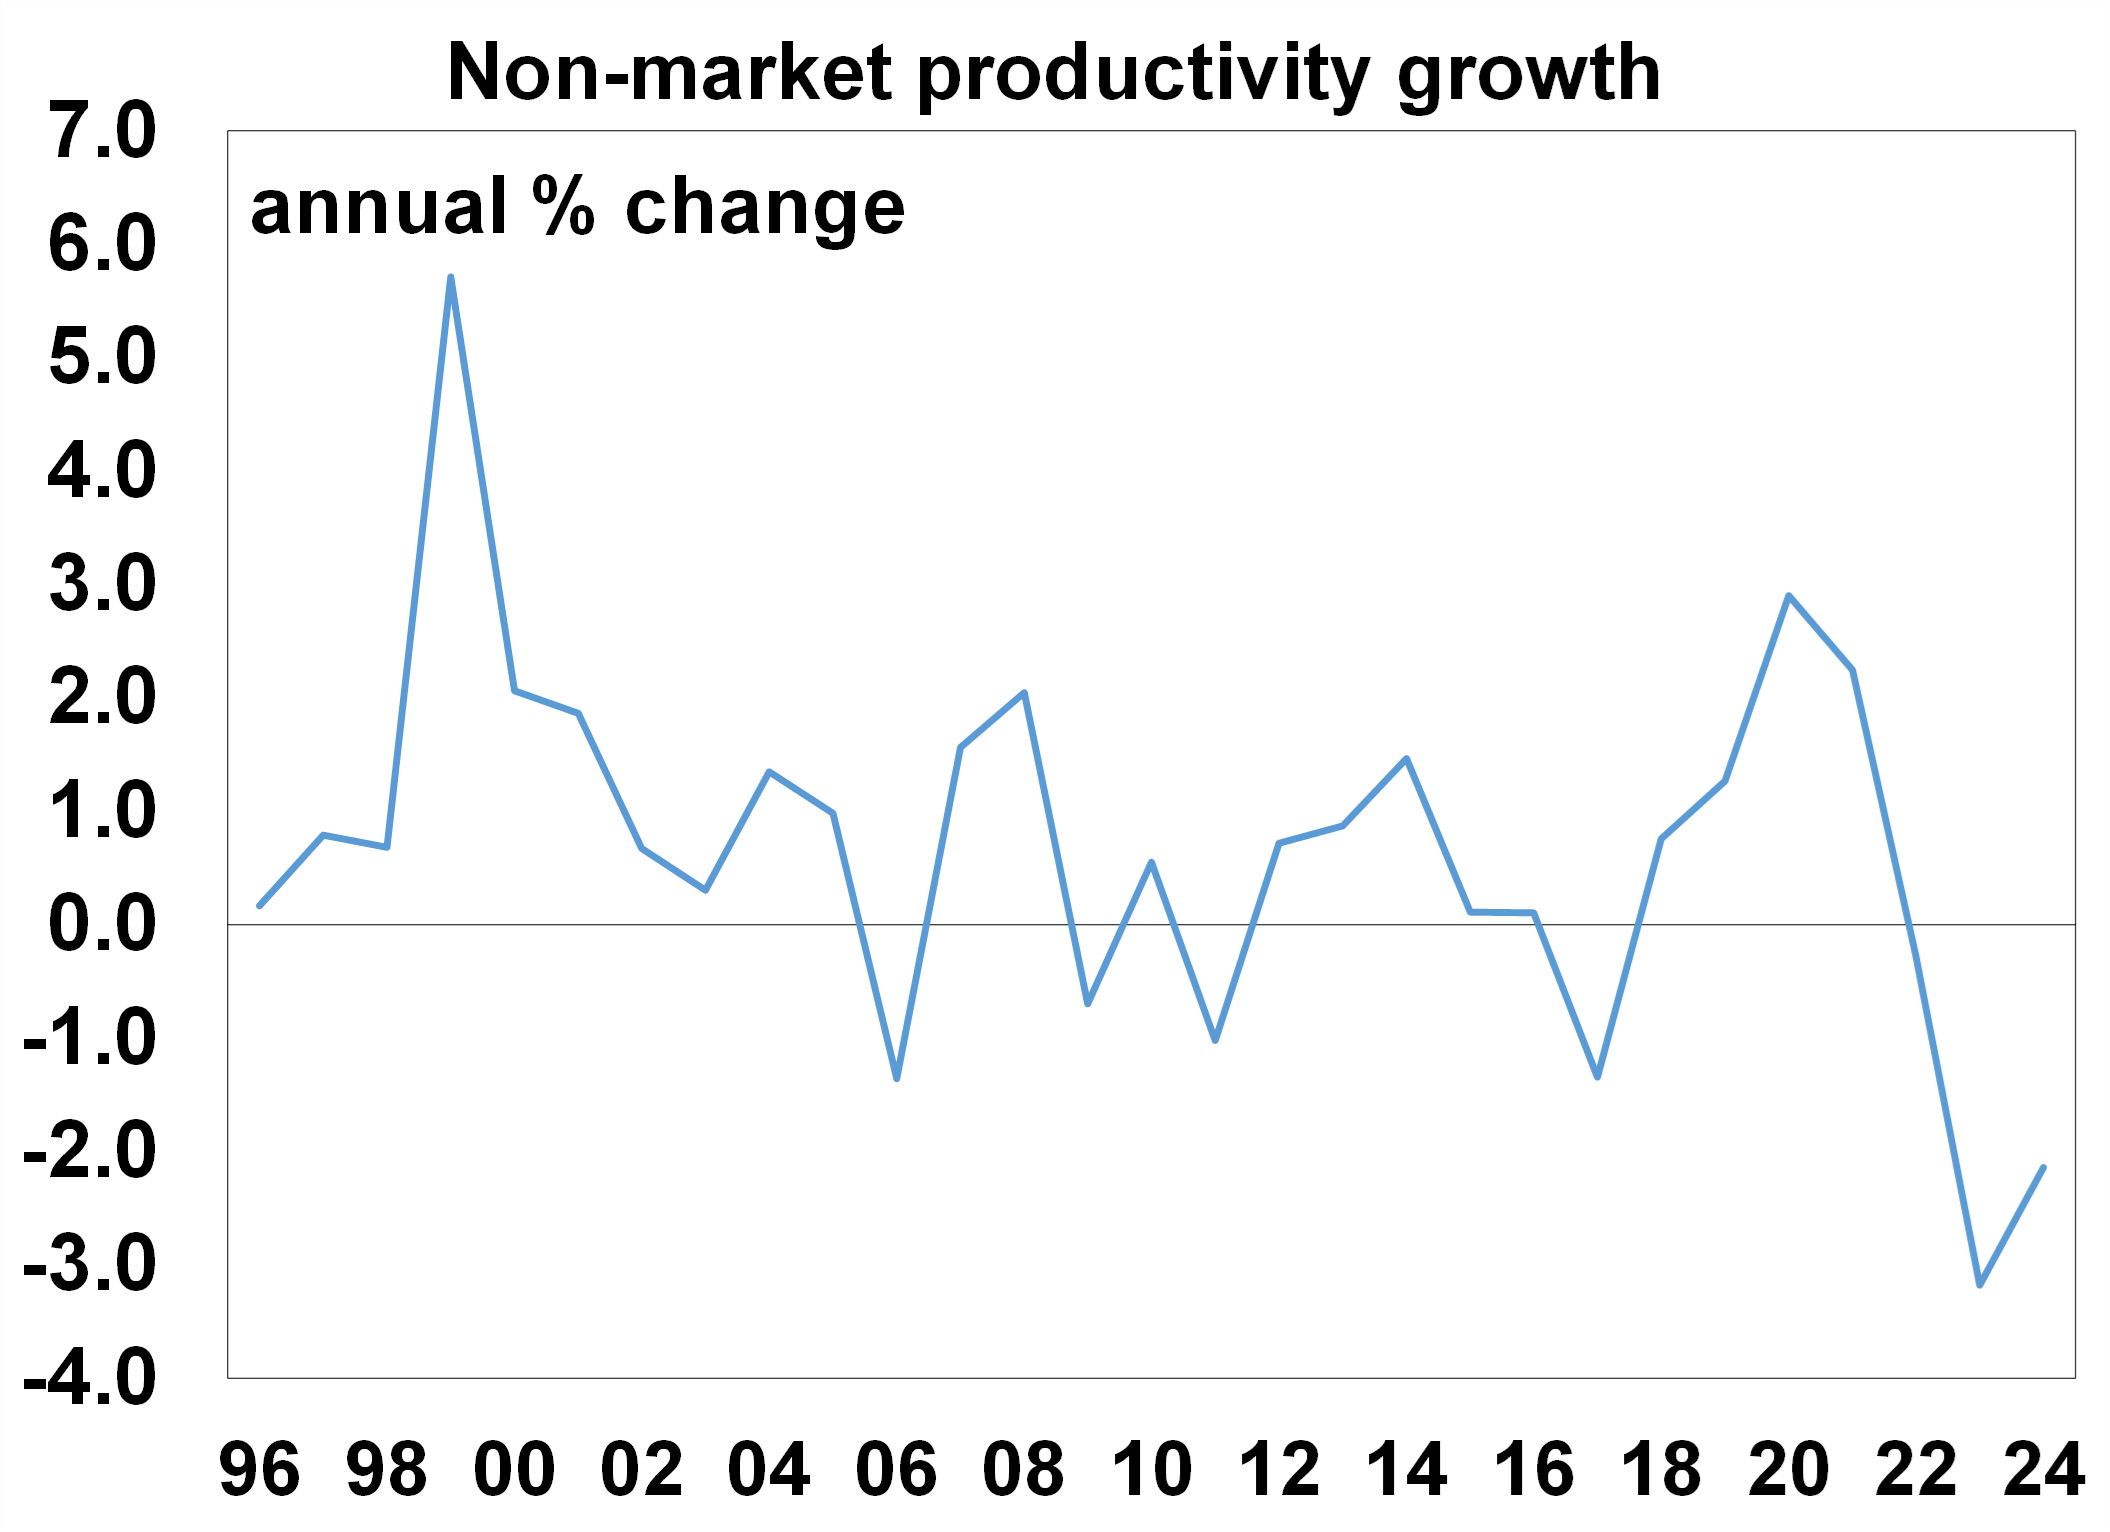
The annual national accounts data showed that productivity growth in the non-market (i.e. public) sector has tumbled in the past year, and was down by 2.1% over the year to June 204.
Source: ABS, AMP
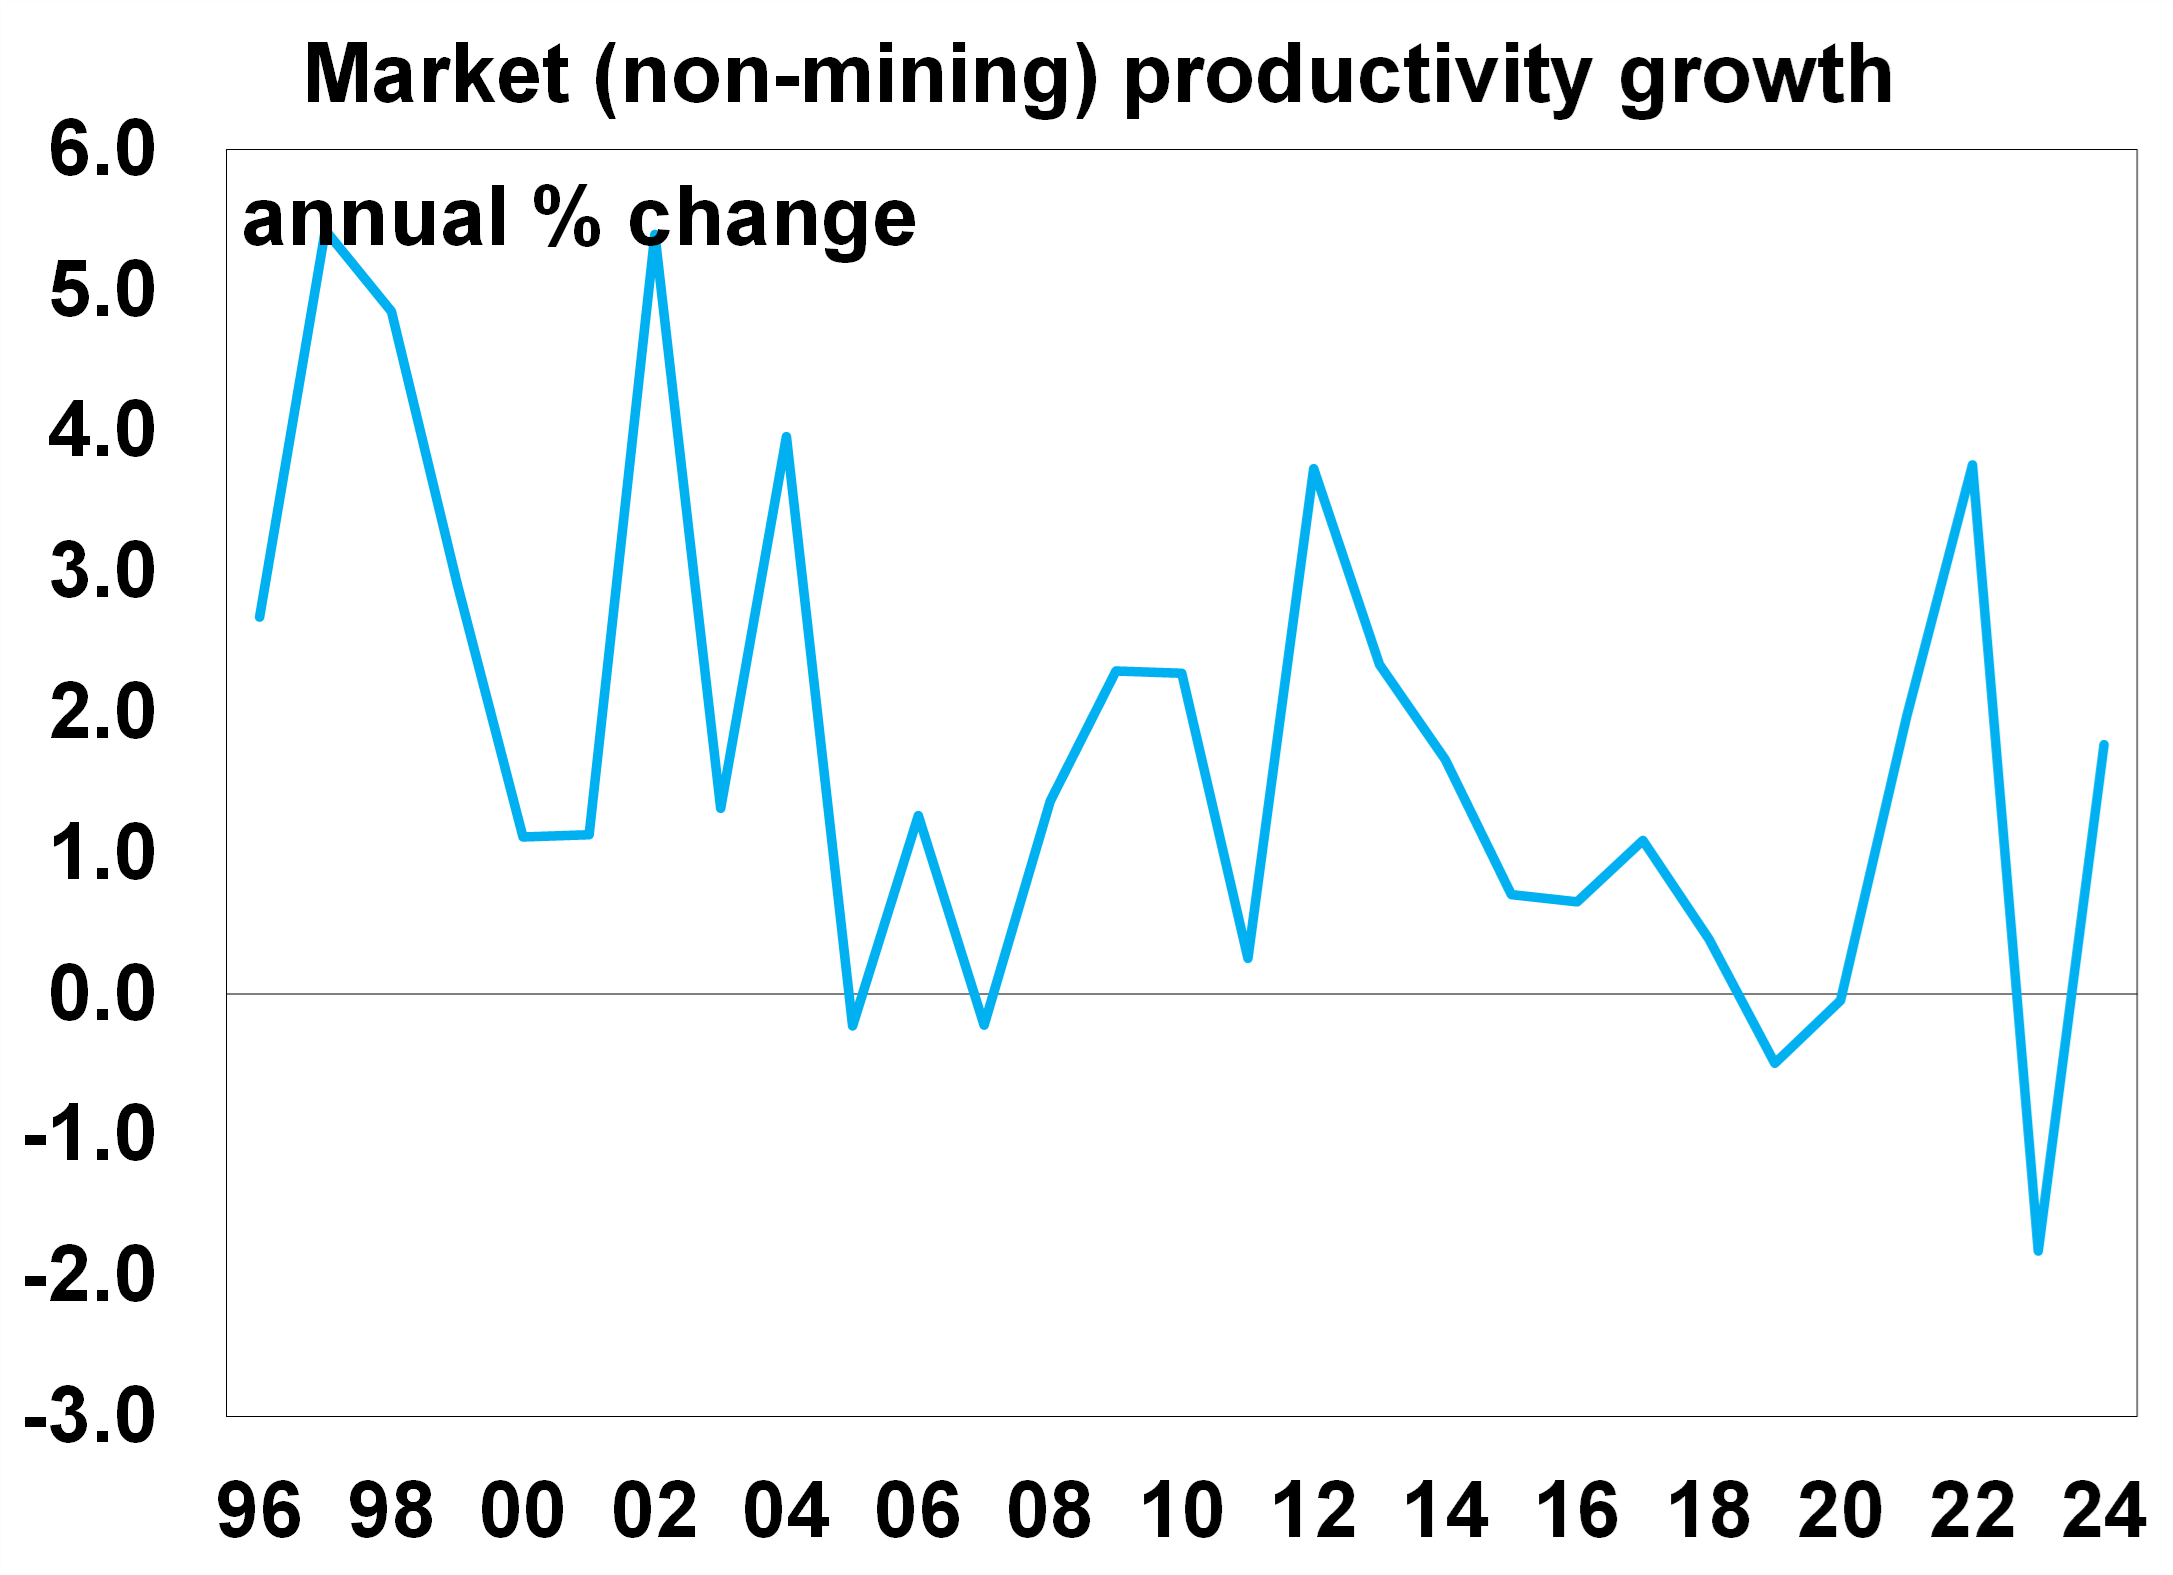
In contrast, productivity growth in the market (ex mining) sector has been much stronger, up by 1.8% over the year to June.
Source: ABS, AMP
Lower productivity growth in key employing parts of the economy can weigh on actual growth (GDP) outcomes which is also another explanation for why jobs growth has been solid but GDP growth outcomes have been softer. The growing share of the non-market or public sector is a key factor behind the slump in productivity growth in Australia.
What about the jobs leading indicators?
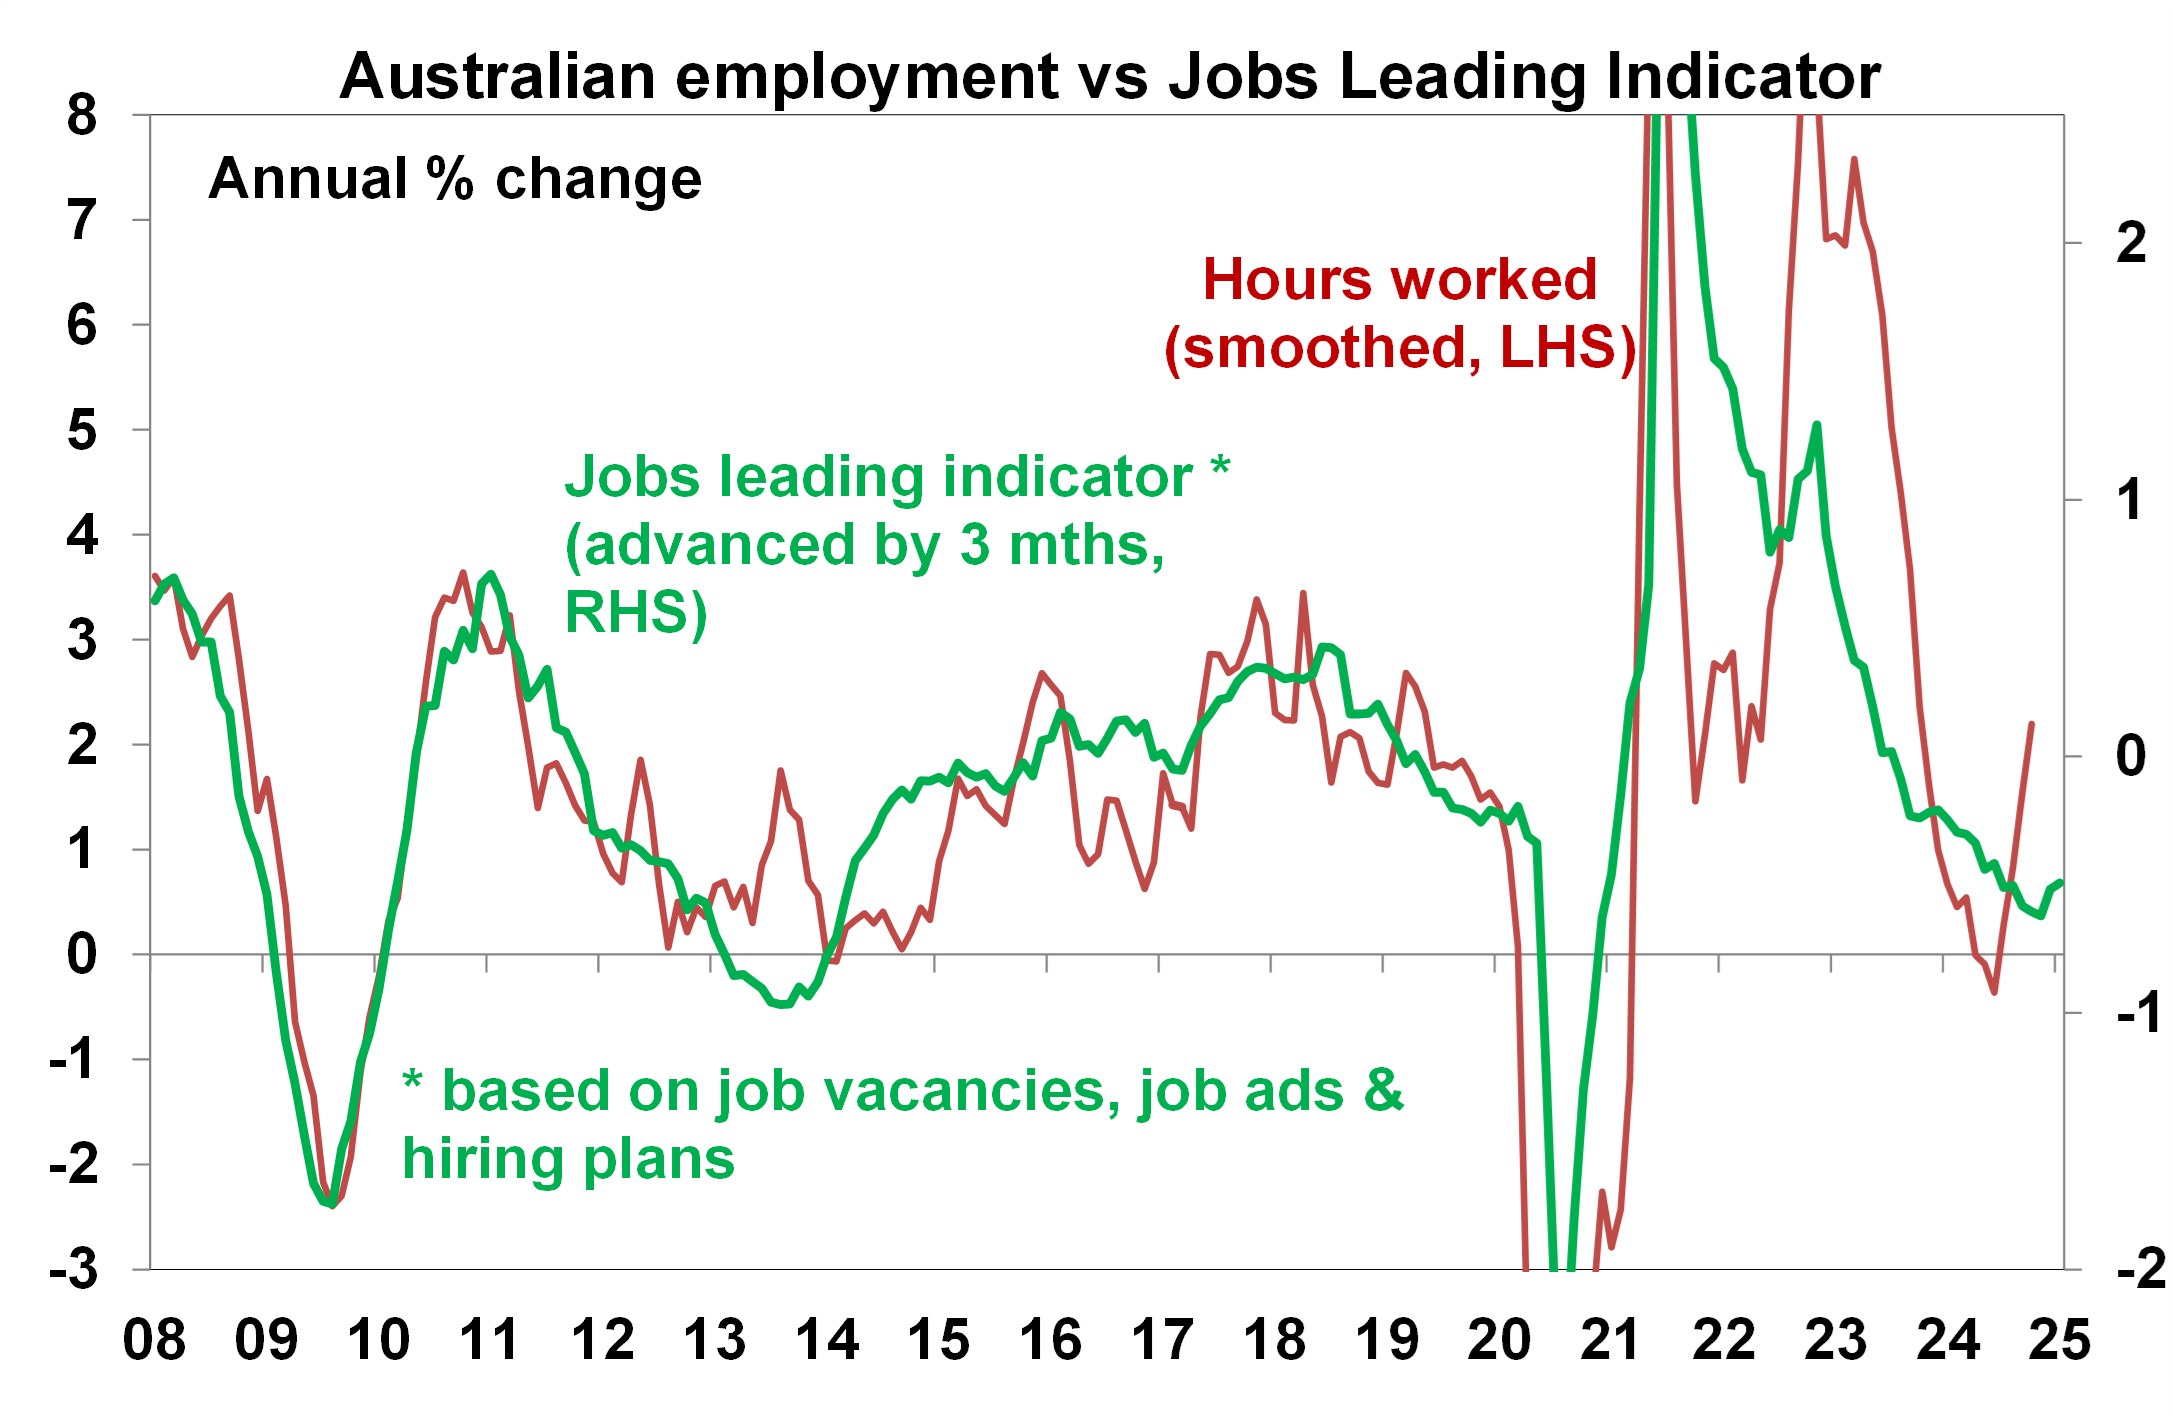
Our Jobs Leading Indicator is a combination of job vacancies, job advertisements and hiring plans and has also moved closer in line to hours worked, rather than to changes in employment (see the chart below). More recently, the leading indicator around jobs growth has starting turning up, which means that hours worked growth is likely to start stabilising.
Source: ABS, AMP
Implications for investors
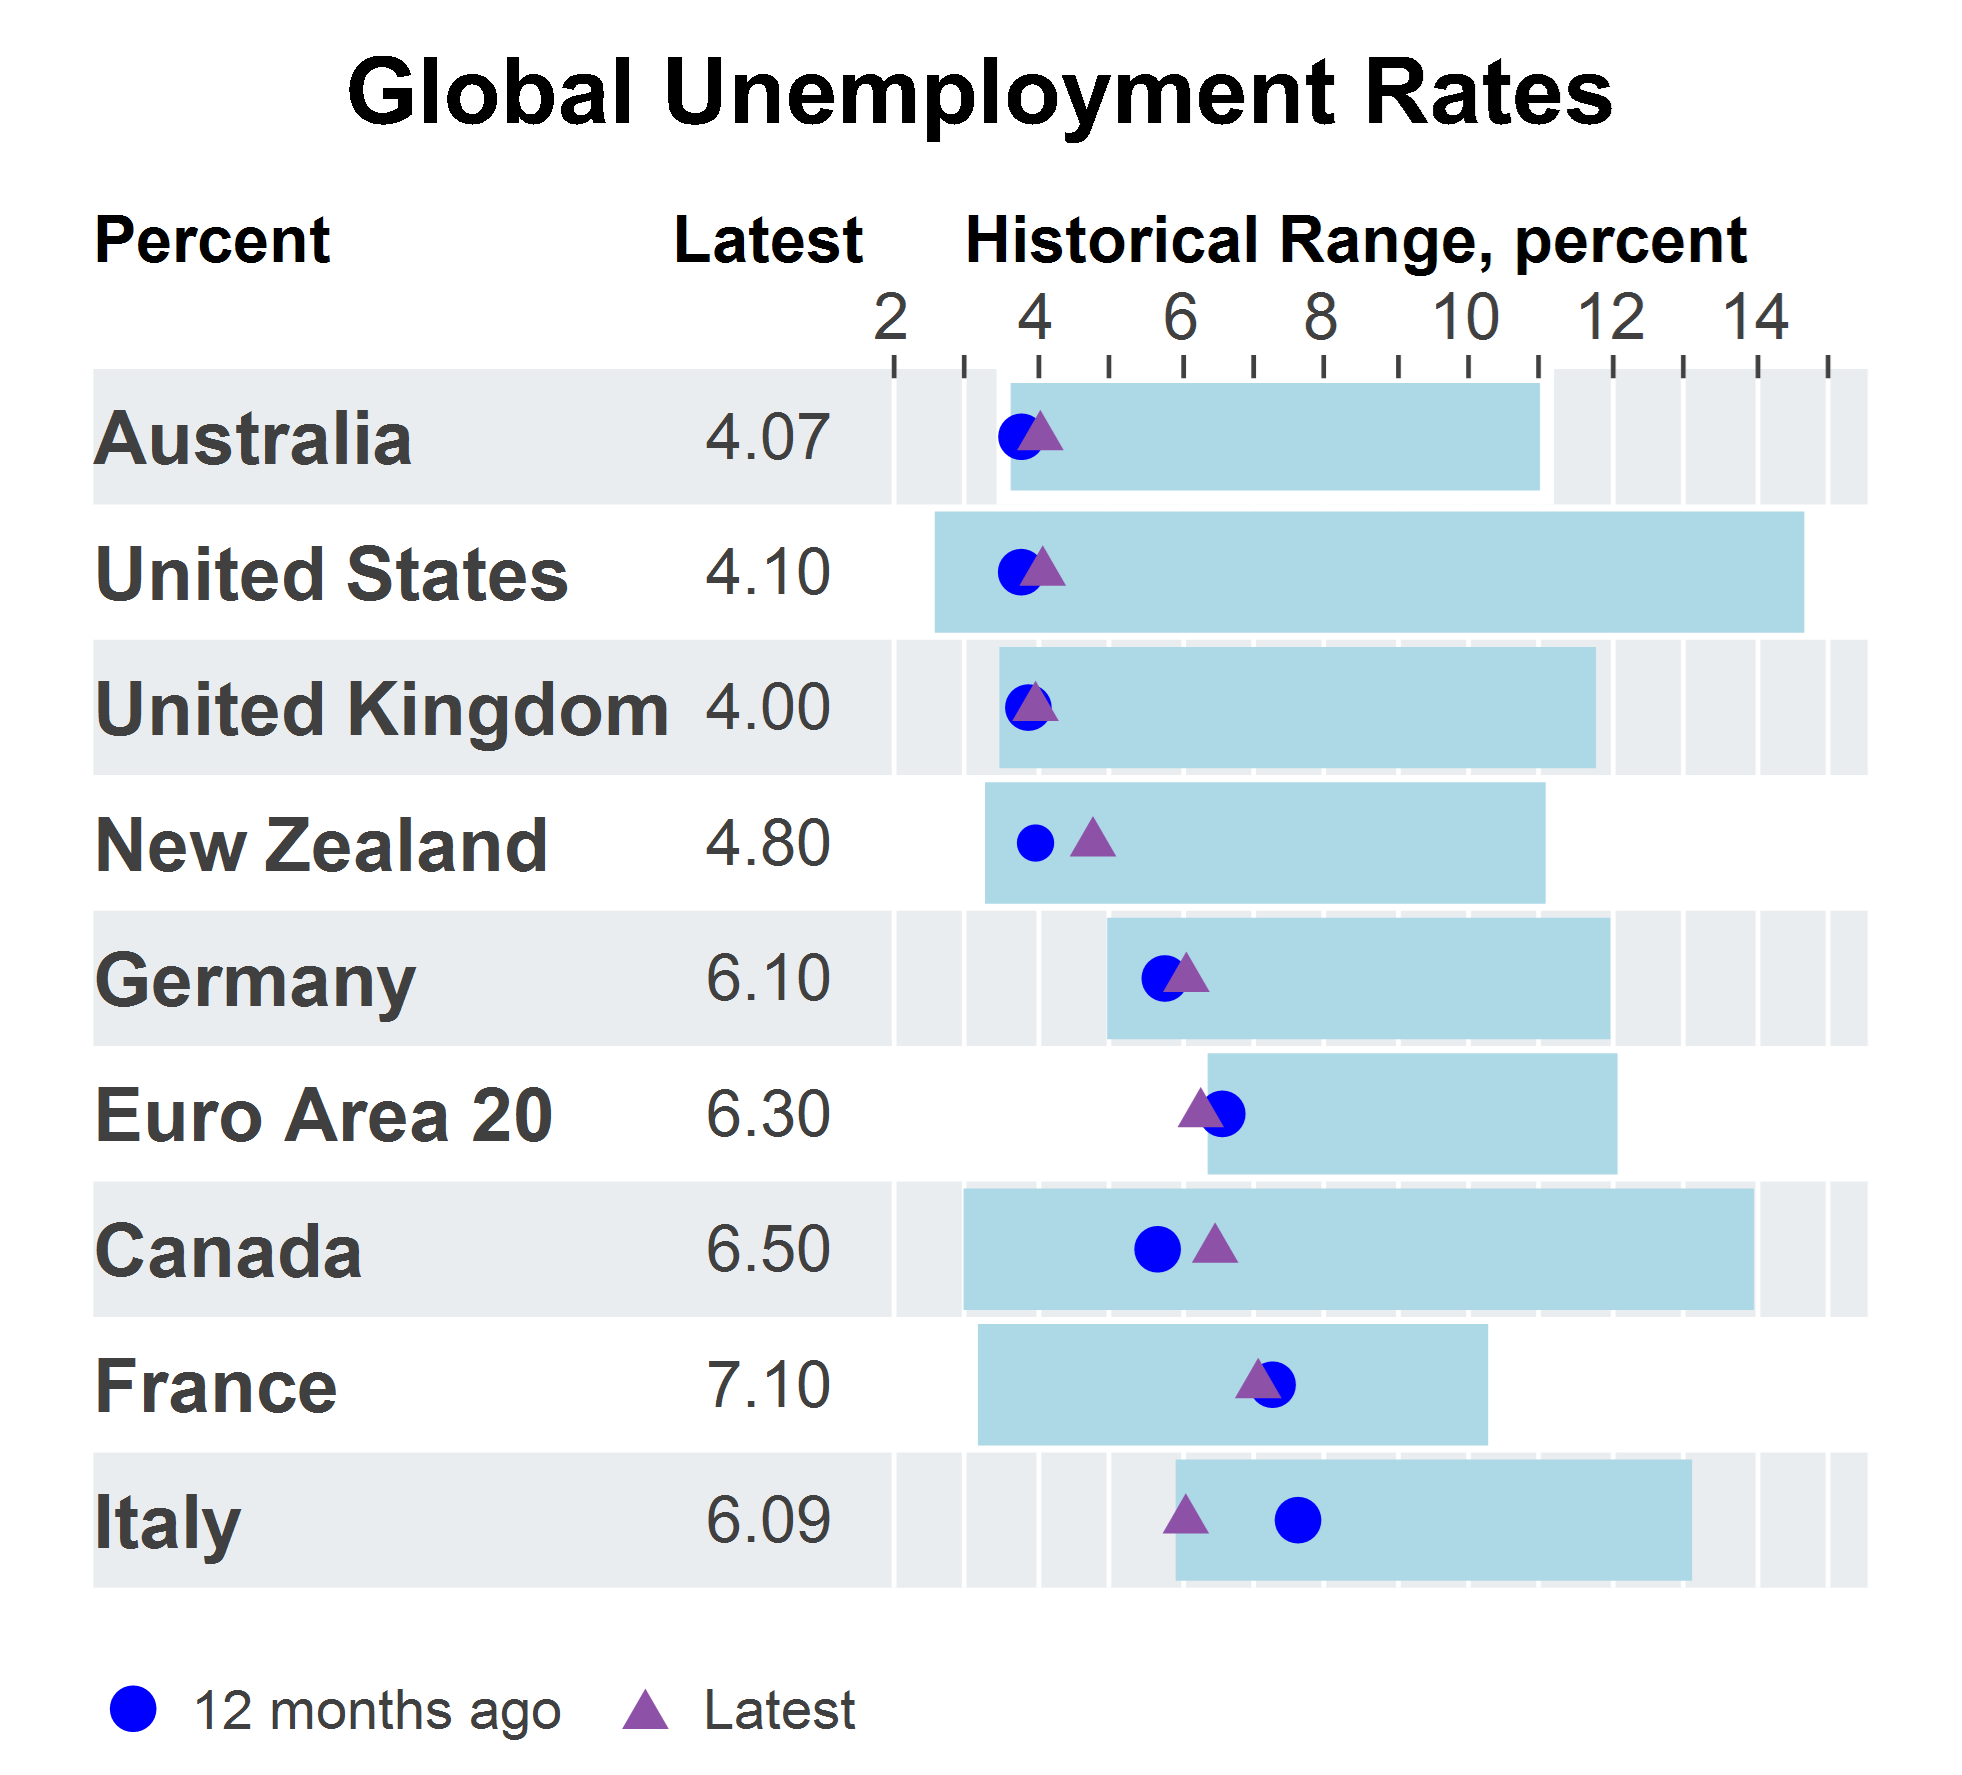
Alongside a slow decline in underling inflation domestically, the low unemployment rate has been a major factor keeping the RBA from cutting interest rates. Interestingly, Australia’s experience with the labour market holding up better than expected is not that different to outcomes across its peers like the US, UK and some regions of Europe that have also only a slight increase to the unemployment rate (see the chart below). New Zealand and Canada have seen the largest increases to the unemployment rate.
Source: Macrobond. AMP
Over the next few months we expect employment data to moderate and the unemployment rate to rise, the GDP figures to remain soft (we see GDP up by 1.1% over the year to December and 1.5% over the year to June) and a further moderation in underlying inflation (similar to our global peers). This should set the stage for the start of interest rate decreases in early 2025.

Weekly market update 15-11-2024
15 November 2024 | Blog Global share markets were messy over the last week, not helped by the ongoing rise in bond yields and a wind back in Fed rate cut expectations after some elevated US inflation data and slightly hawkish comments from Fed chair Powell. Read more
Oliver's insights - staying focused as an investor
12 November 2024 | Blog Dr Shane Oliver suggests five ways to help manage the noise and stay focussed as an investor with the changes in the macro enviroment. Read more
Weekly market update 08-11-2024
08 November 2024 | Blog It was all about the US Presidential election this week. Despite concerns that the election outcome would be extremely close, the Republican victory was stronger than the polls and betting markets were suggesting into the lead up. Read moreWhat you need to know
While every care has been taken in the preparation of this article, neither National Mutual Funds Management Ltd (ABN 32 006 787 720, AFSL 234652) (NMFM), AMP Limited ABN 49 079 354 519 nor any other member of the AMP Group (AMP) makes any representations or warranties as to the accuracy or completeness of any statement in it including, without limitation, any forecasts. Past performance is not a reliable indicator of future performance. This document has been prepared for the purpose of providing general information, without taking account of any particular investor’s objectives, financial situation or needs. An investor should, before making any investment decisions, consider the appropriateness of the information in this document, and seek professional advice, having regard to the investor’s objectives, financial situation and needs. This article is solely for the use of the party to whom it is provided and must not be provided to any other person or entity without the express written consent AMP. This article is not intended for distribution or use in any jurisdiction where it would be contrary to applicable laws, regulations or directives and does not constitute a recommendation, offer, solicitation or invitation to invest.
The information on this page was current on the date the page was published. For up-to-date information, we refer you to the relevant product disclosure statement, target market determination and product updates available at amp.com.au.

