

Key points
- Housing demand in Australia has been running above housing supply for the past two decades causing a dwelling shortage.
- High population growth in recent years and low levels of dwelling construction has made the housing shortage worse.
- However, there are variations across the states and territories, with some in a housing shortage (Qld and NSW) and some likely in oversupply (Victoria) which is influencing dwelling prices in capital cities, rental vacancy rates and rental growth.
Introduction
Most of the usual analysis on the Australian housing market focusses on the national problem of housing undersupply. However, this disguises the mixed outcomes across the states and territories which influence housing values and rents across capital and regional cities.
Government housing policies
In 2023, the Federal Government signed a “National Housing Accord” which is purely an aspirational target to build 1.2 million new “well-located” homes over 5 years from mid-2024. The states, territories and local governments will receive $3.5bn in payments towards this target as an incentive to build more homes. Australia went through a building boom from 2013 until 2019, with an average of 193K dwellings built per year over this time (see the chart below).
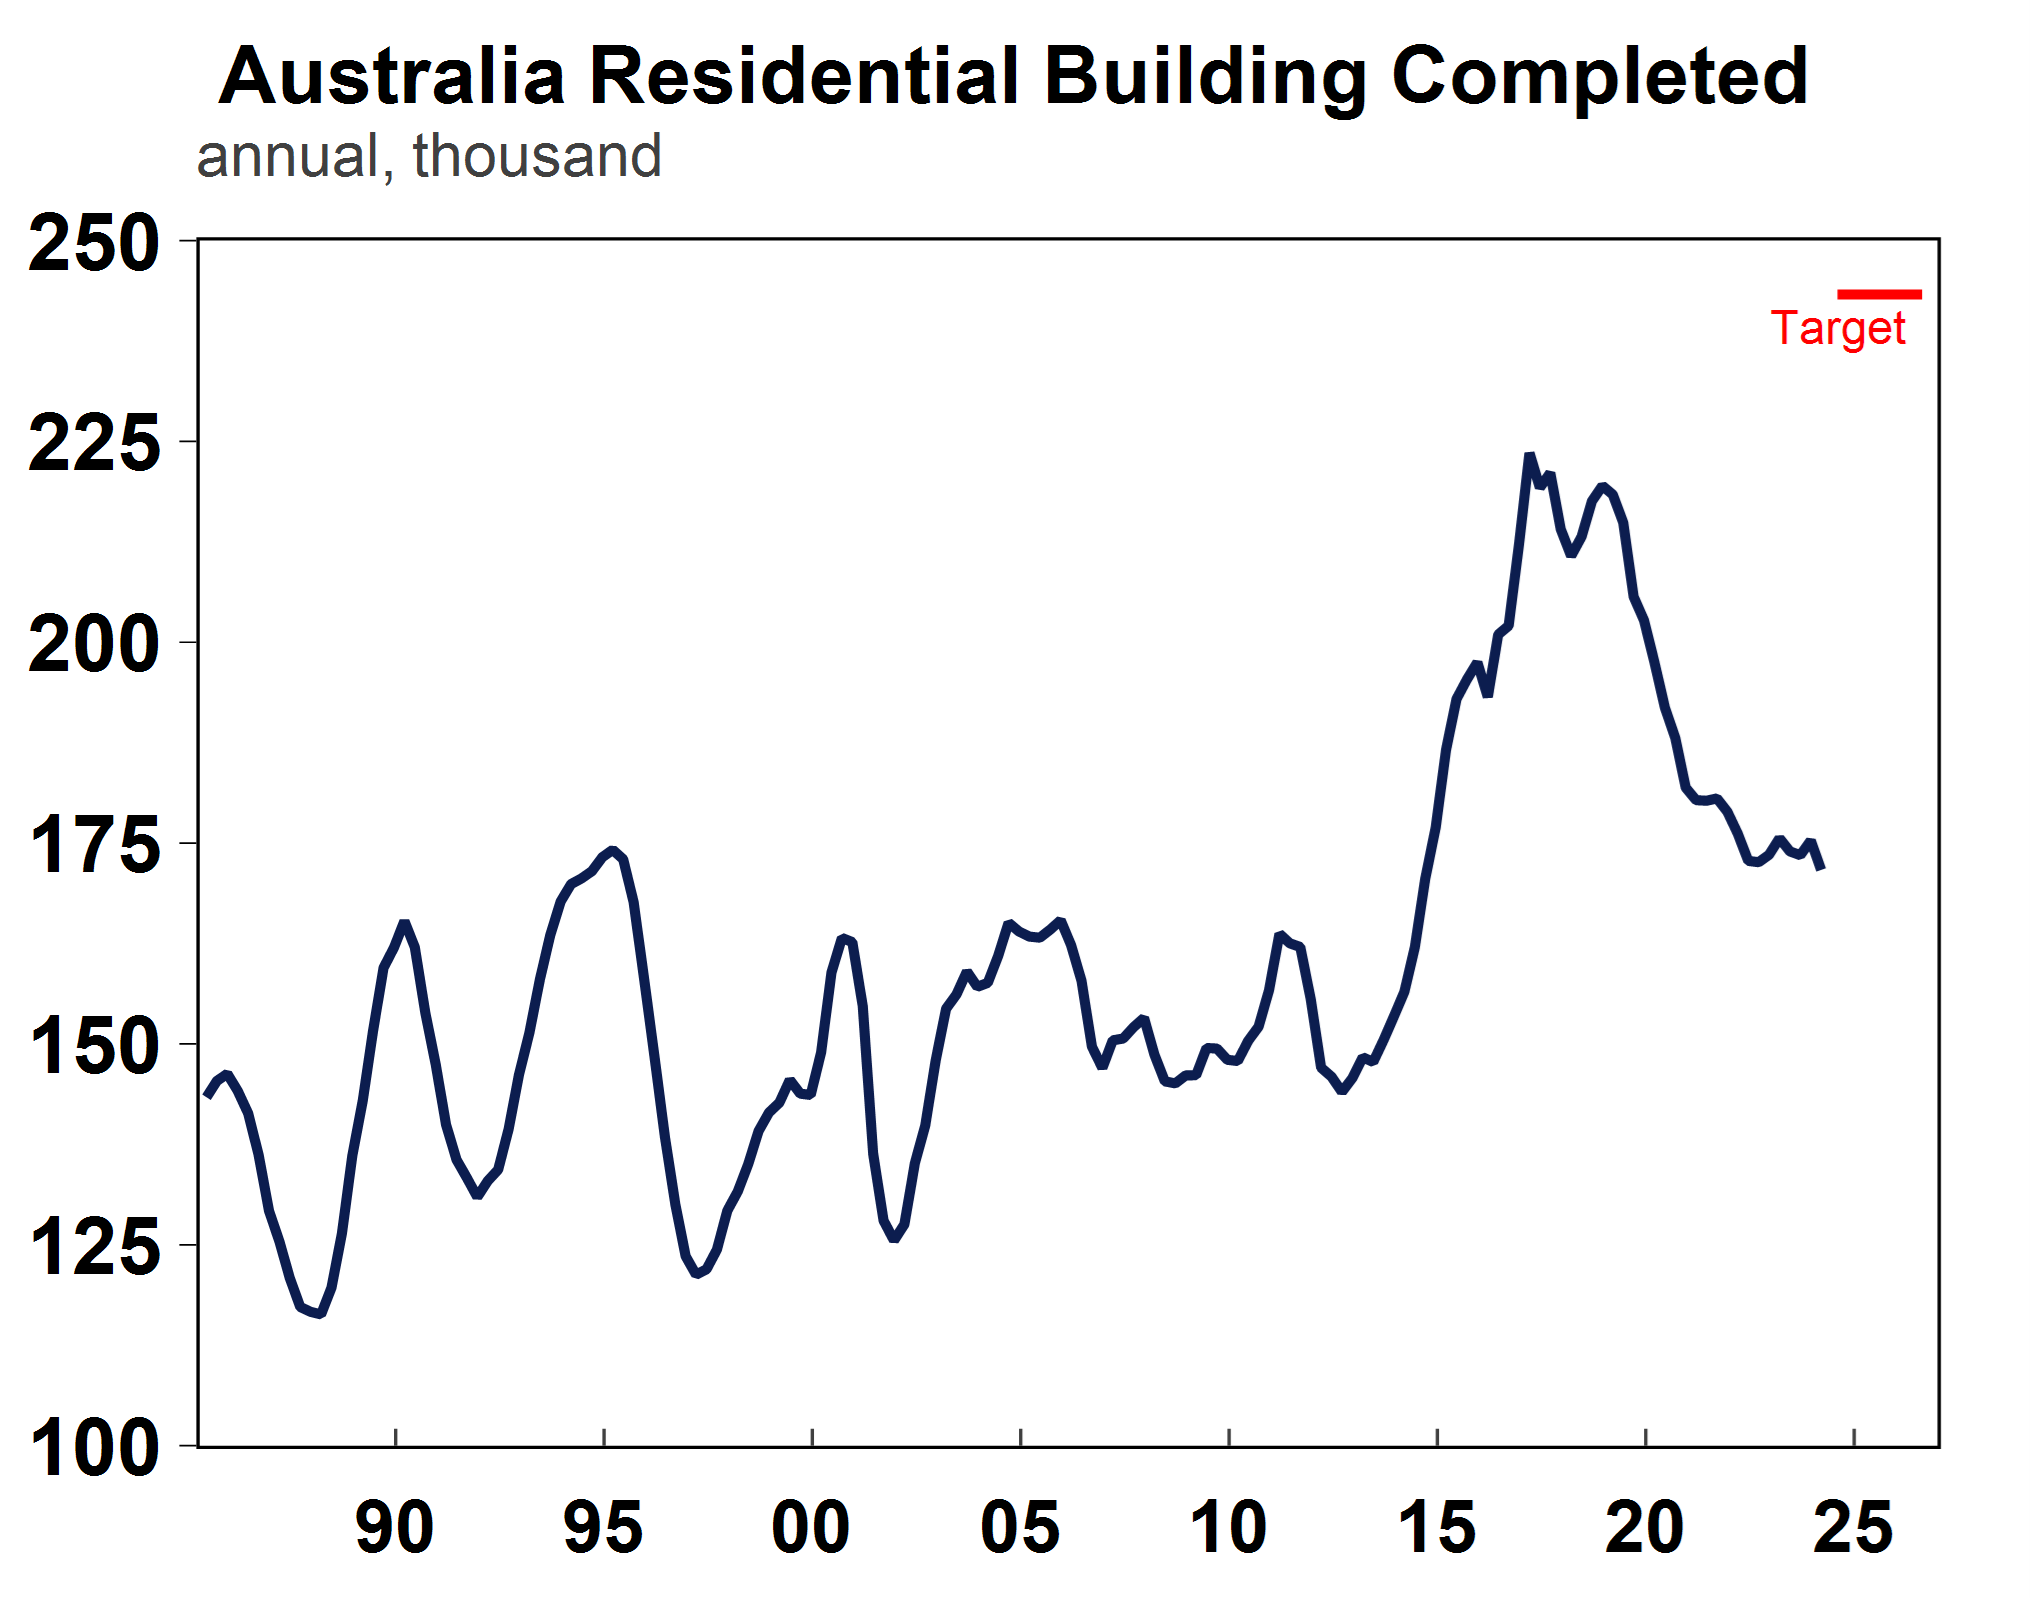
Source: Macrobond, AMP
Since 2019, building construction has trended down, from the impact of high interest rates, elevated inflation for construction costs, high wages growth and issues with finding suitable labour (due to border closures and numerous infrastructure projects crowding out labour in residential construction). Over the year to March, approximately 172K dwellings were completed but dwelling starts and building approvals (a good forward guide to actual construction) suggest that over the next 12 months dwelling completions will drop to approximately160K, well short of the government’s 240K target.
Despite the governments goals to build more dwellings, 95% of residential construction is done by the private sector in Australia. The states and territory governments and local councils have responsibility around the development and supply of new land. They control the release of land and the growth of greenfield areas, how the land is used, how it is developed as well as ensuring that these areas have essential services. Support for social and affordable housing comes from both the state and federal governments. And the Federal government can also provide incentives for the states to build, as they have done with the National Housing Accord.
Housing demand and supply
Housing demand is determined by population growth (mostly driven by net overseas migration) and changes to household size. In Australia, the average number of people per household has declined from 2.9 persons in 1983 to a little below 2.5 persons in 2022. The number of people per household rose in the initial phase of the pandemic and then started declining in 2021 as individuals opted for more living space.
Housing supply is determined by completions of homes, after taking into account demolitions, conversions and vacant properties. Prior to 2000, housing demand and supply were fairly balanced in Australia. After this time, housing demand started running above supply, with persistent undersupply ramping up from 2005 (see the chart below).
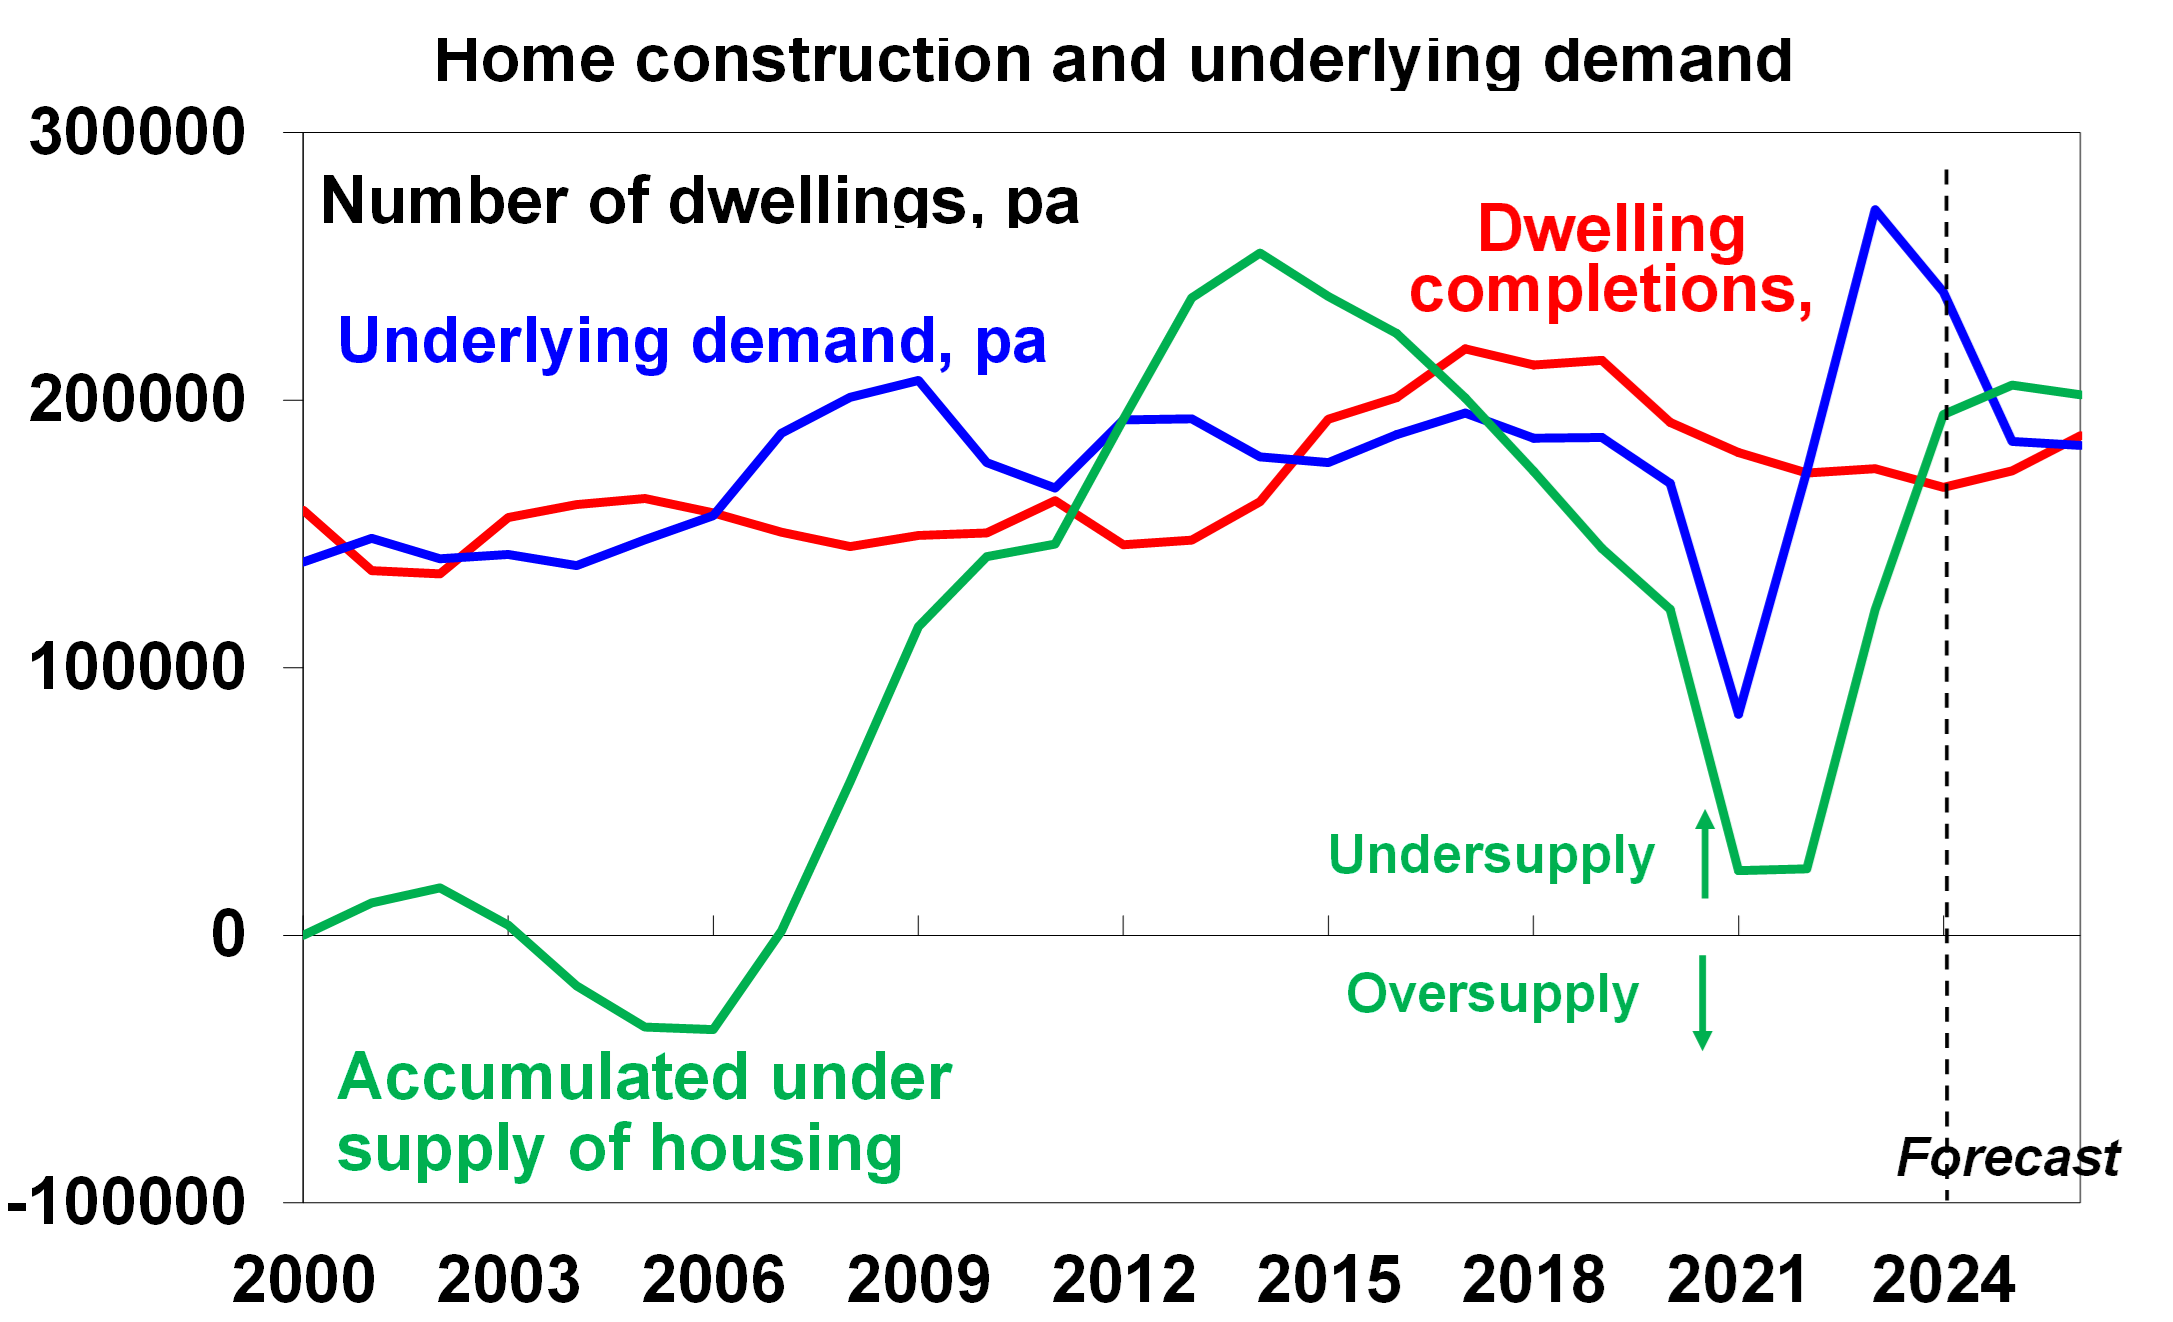
Source: ABS, AMP
Our estimate is that housing demand is currently running around 240K and will slow to 185K over the next few years as population growth subsides. Housing supply is expected to be ~167K in 2024 and average around 180K in the out-years which means that the housing supply shortage will continue. On our estimates, the total accumulated number of dwelling undersupply is around 200K dwellings nationally which is around 78K households (based on the assumption that there are 2.5 persons per dwelling). However, there are differences in supply and demand across the states and territories
Housing demand versus supply across the states
We have derived an estimate for housing demand versus supply on a state basis, with a similar process to the national data. Our findings show that the largest accumulated housing undersupply since 2000 is in Queensland and New South Wales, followed by Tasmania, the Northern Territory, Western Australia and South Australia. But Victoria looks to be seeing a large oversupply of dwellings along with some oversupply in the ACT. The chart below looks at the accumulated over and undersupply of dwellings across the states and territories.
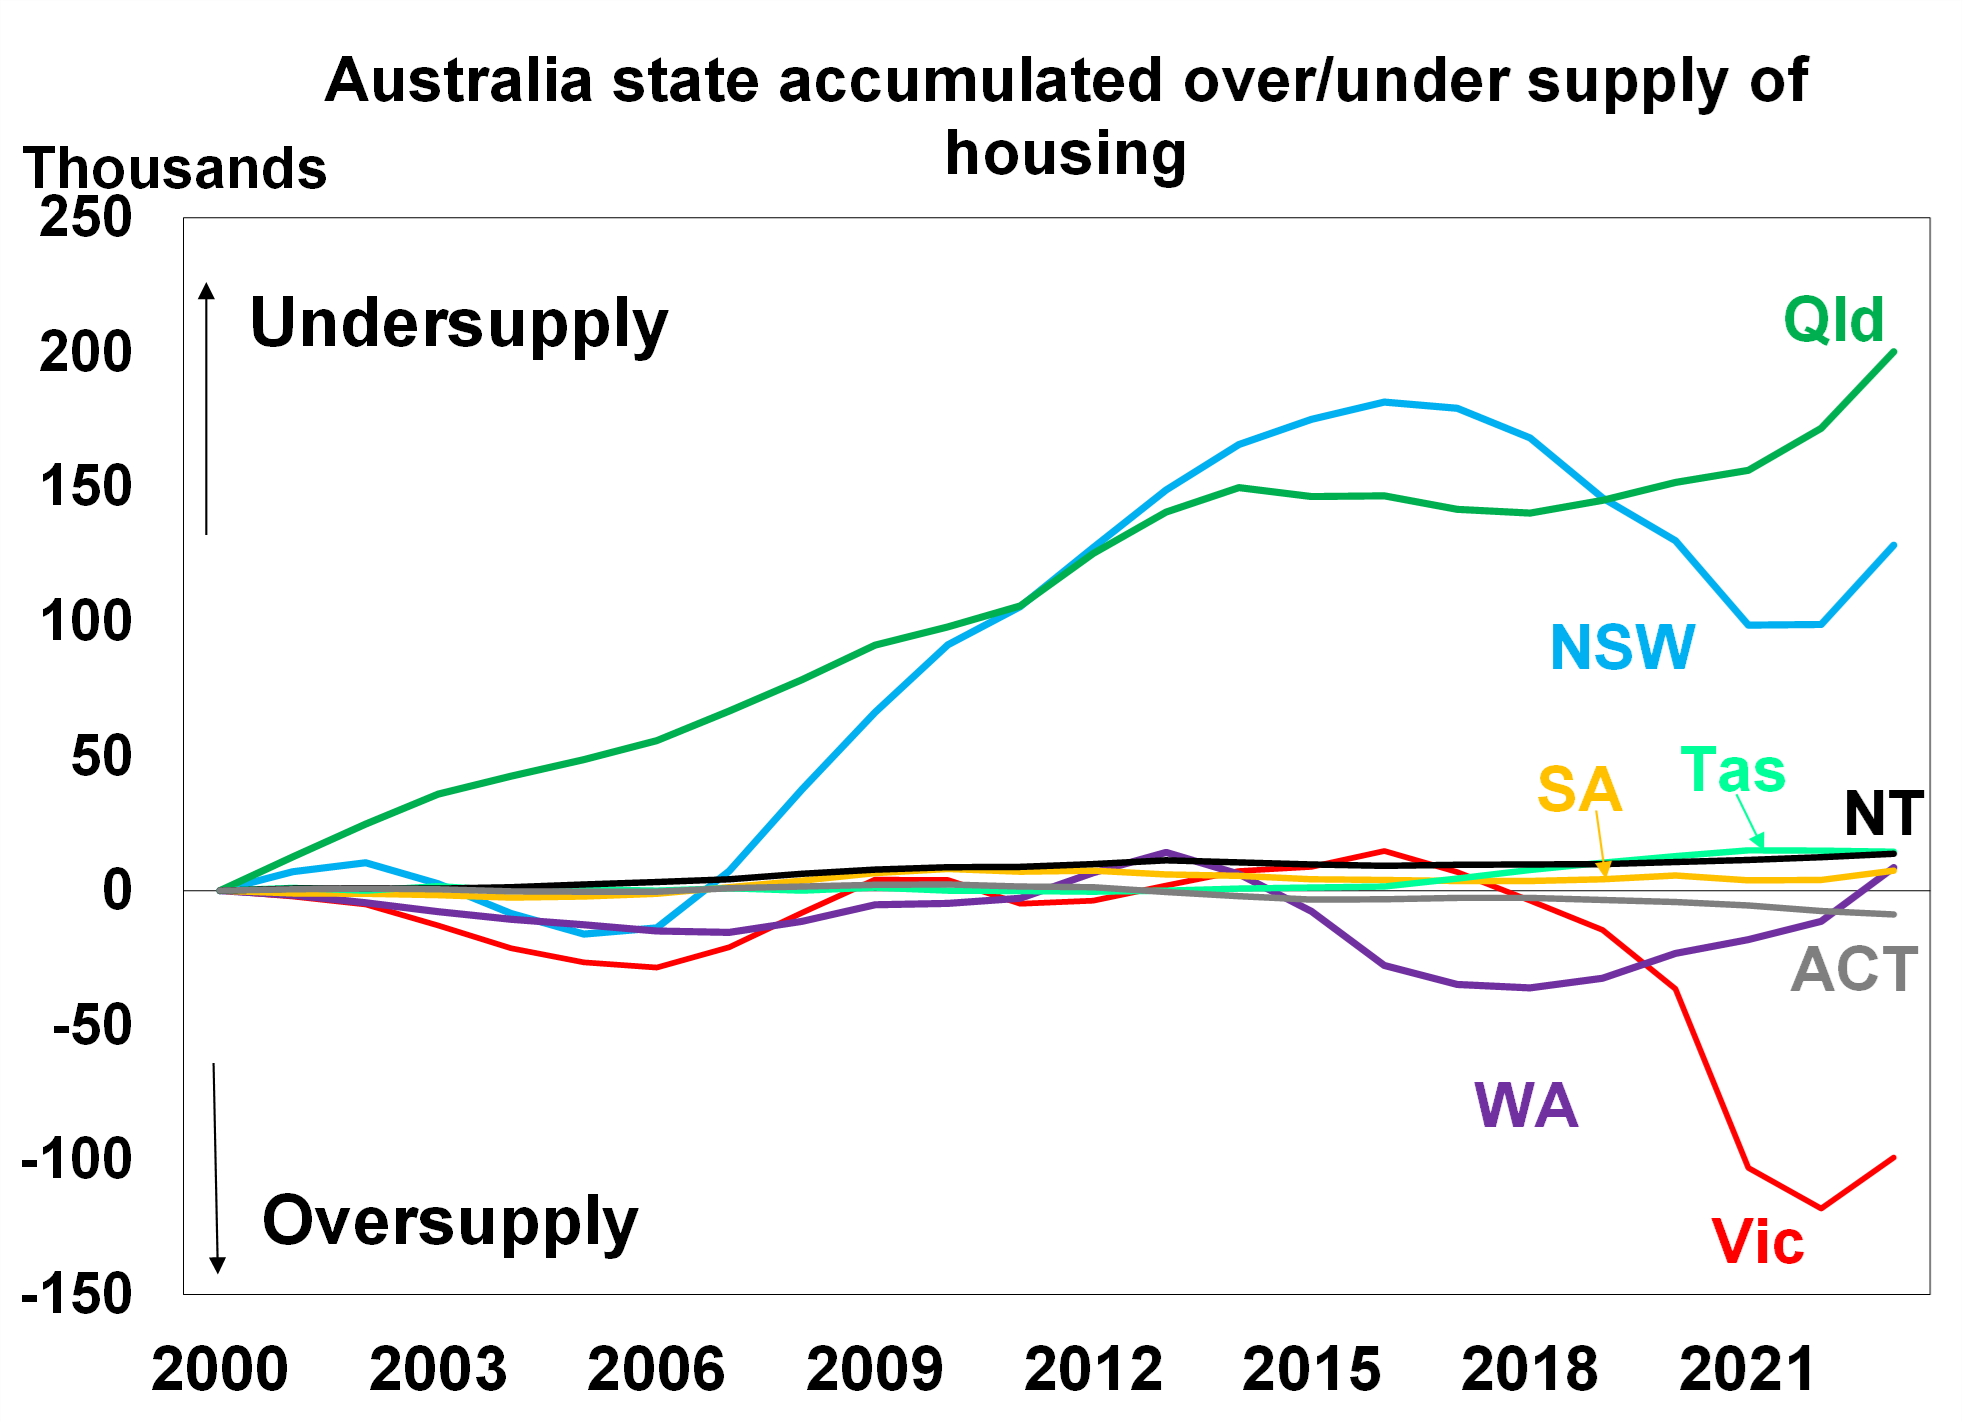
Source: ABS, AMP
Qld’s housing undersupply started accumulating during the mining boom from 2005 (until the peak in the mining boom in in 2012) when population growth was high. Low construction in recent years has made the undersupply problem worse. Qld has experienced high interstate migration since 2018 (see the chart below) due to affordability challenges in neighbouring NSW, with the pandemic further increasing interstate migration into Qld. Victorian housing completions have run at high levels relative to other states in recent years and the outflow of interstate migration during the pandemic (see the chart below) deepened the oversupply.
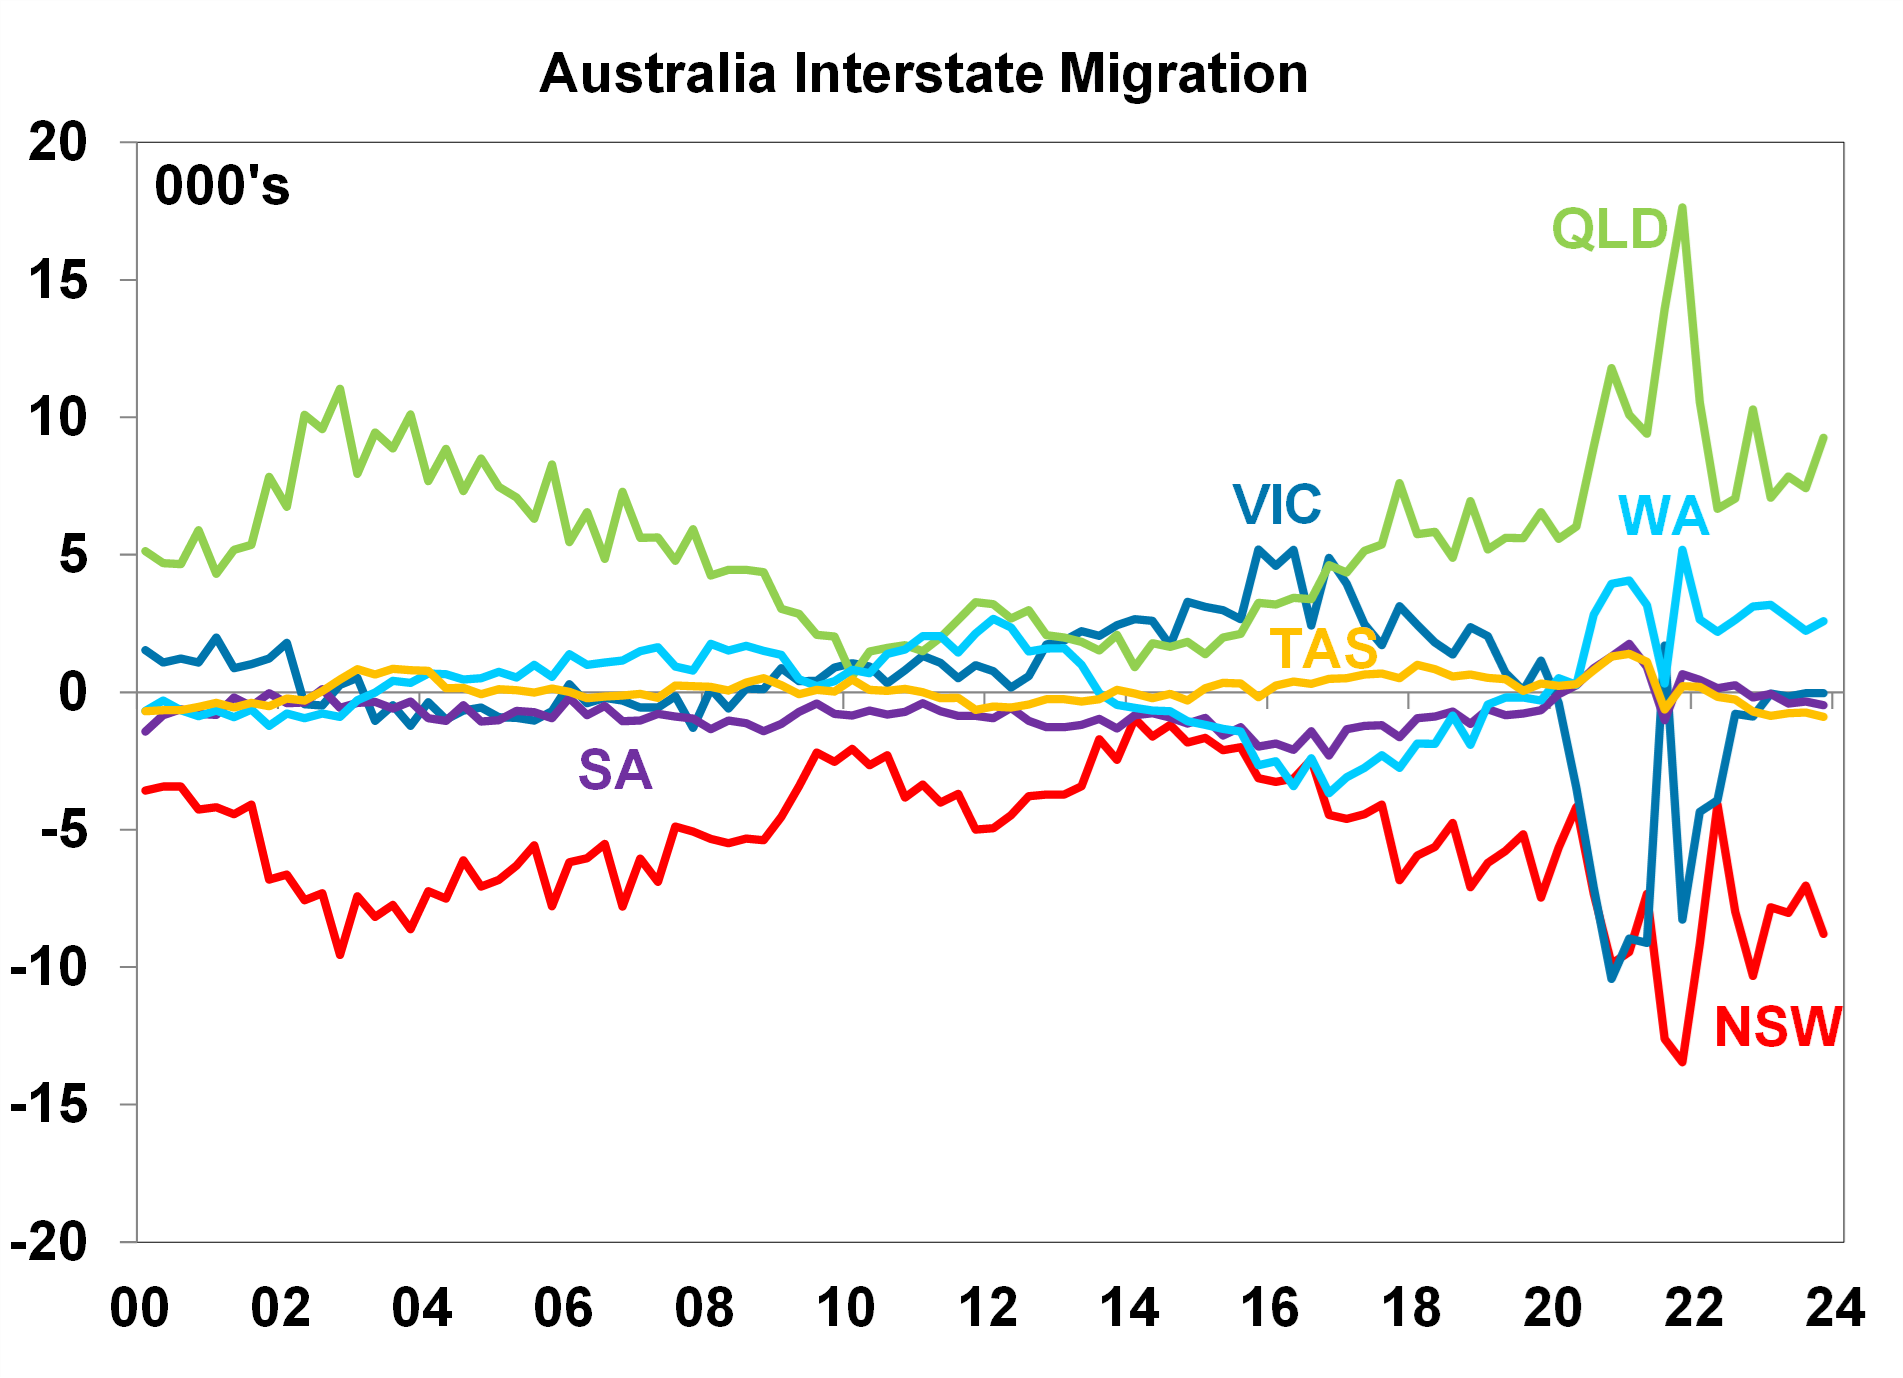
Source: ABS, AMP
Housing undersupply is supporting dwelling prices in Sydney, Brisbane and Adelaide. Perth home prices have also accelerated lately which reflects some housing undersupply but is likely more due to better affordability in WA (also evident in a recent increase in interstate migration). Melbourne home prices are underperforming the rest of Australia, reflecting oversupply and tax policy changes which have dampened investor confidence.
The supply of housing also affects the rental market. Nationally, the rental market is tight with low vacancy rates, particularly in Adelaide and Perth currently (see the chart below). Brisbane, Sydney and Melbourne vacancy rates are off their lows, but are still in the ultra-low single digits and below the long-run average level which is keeping rents elevated.
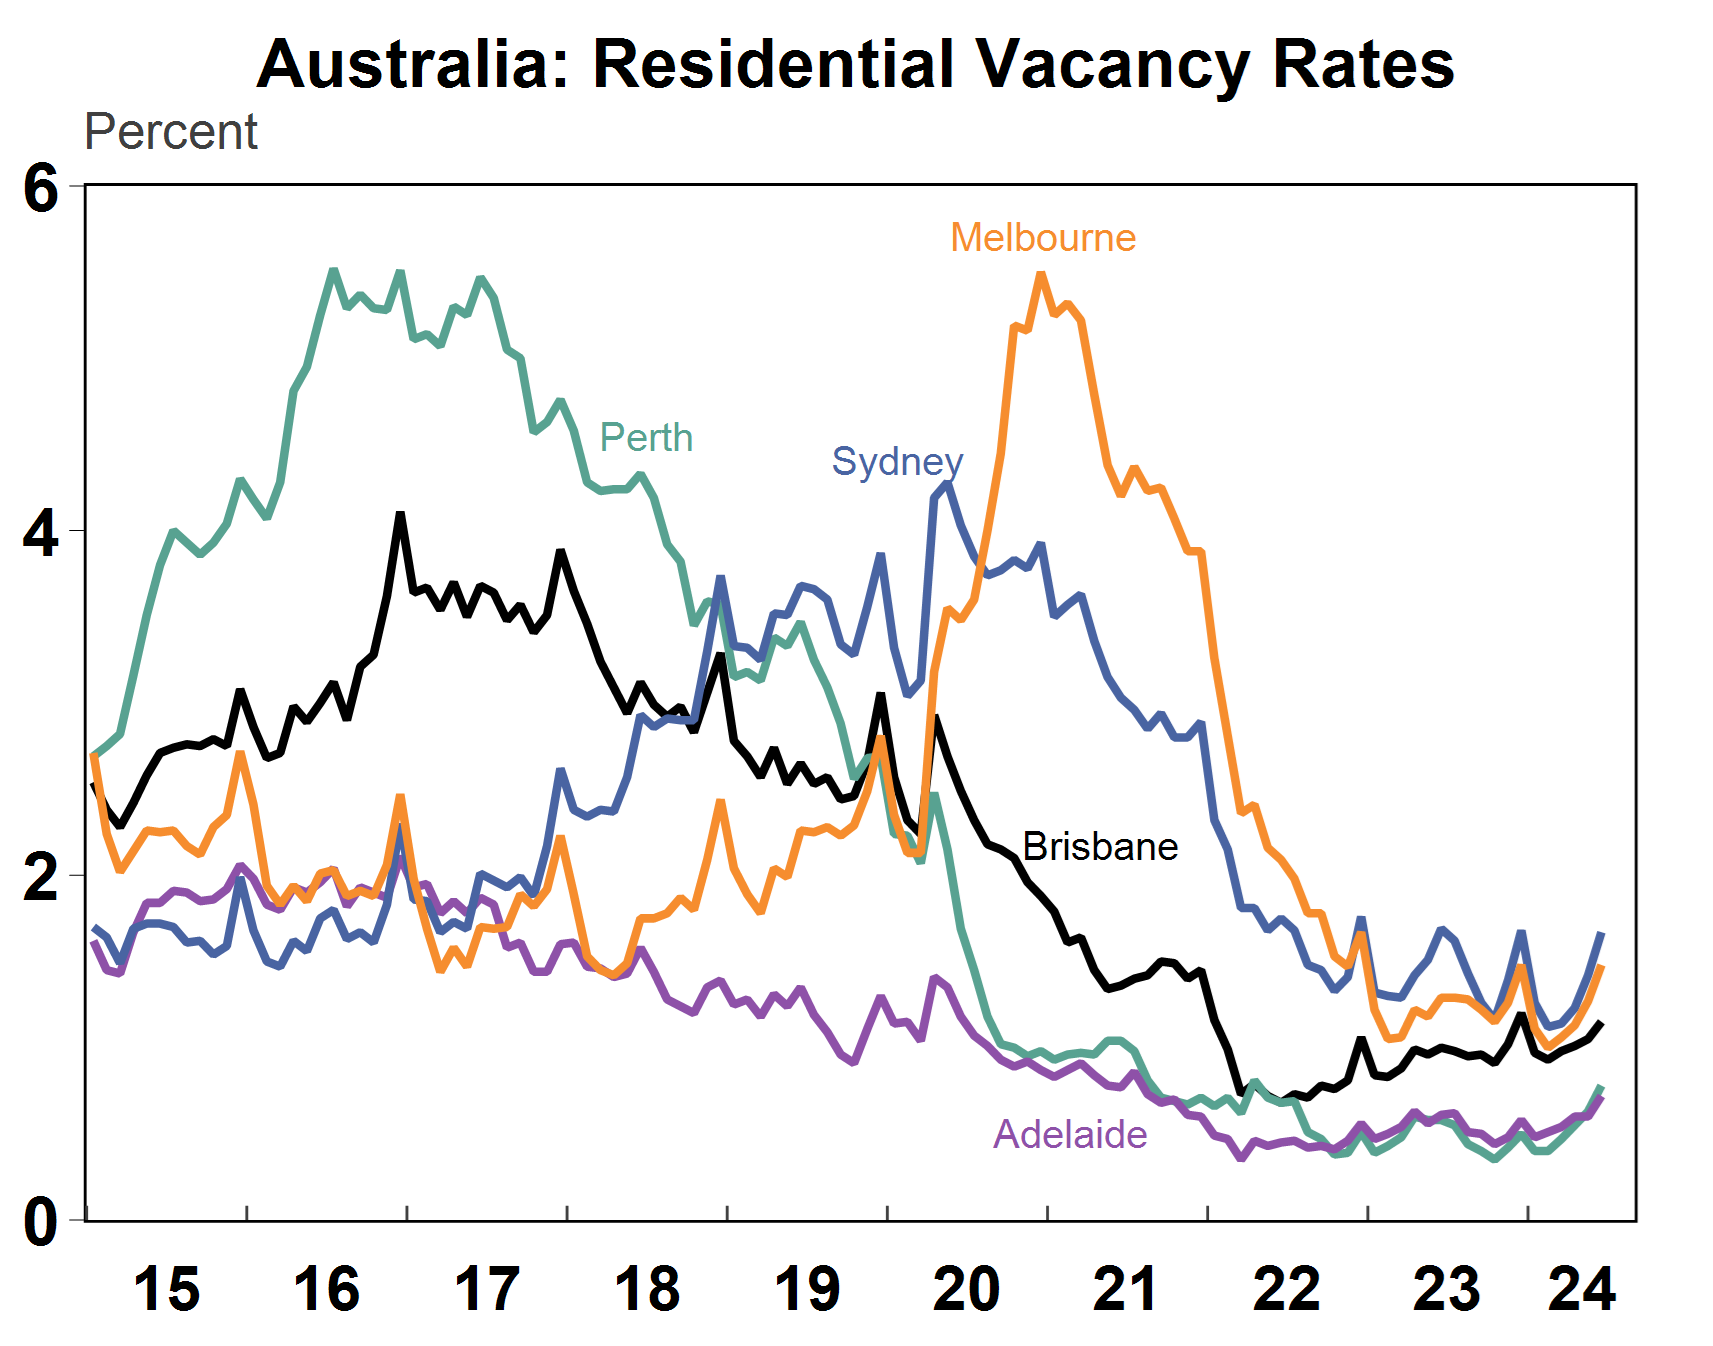
Source: Macrobond, SQM, AMP
Rental growth has been strong across Australia, up by nearly 8% over the year to March, with the strongest growth seen in Perth, Sydney, Brisbane and Melbourne (see the chart below). Rental growth has turned down in Darwin, Canberra and Hobart.
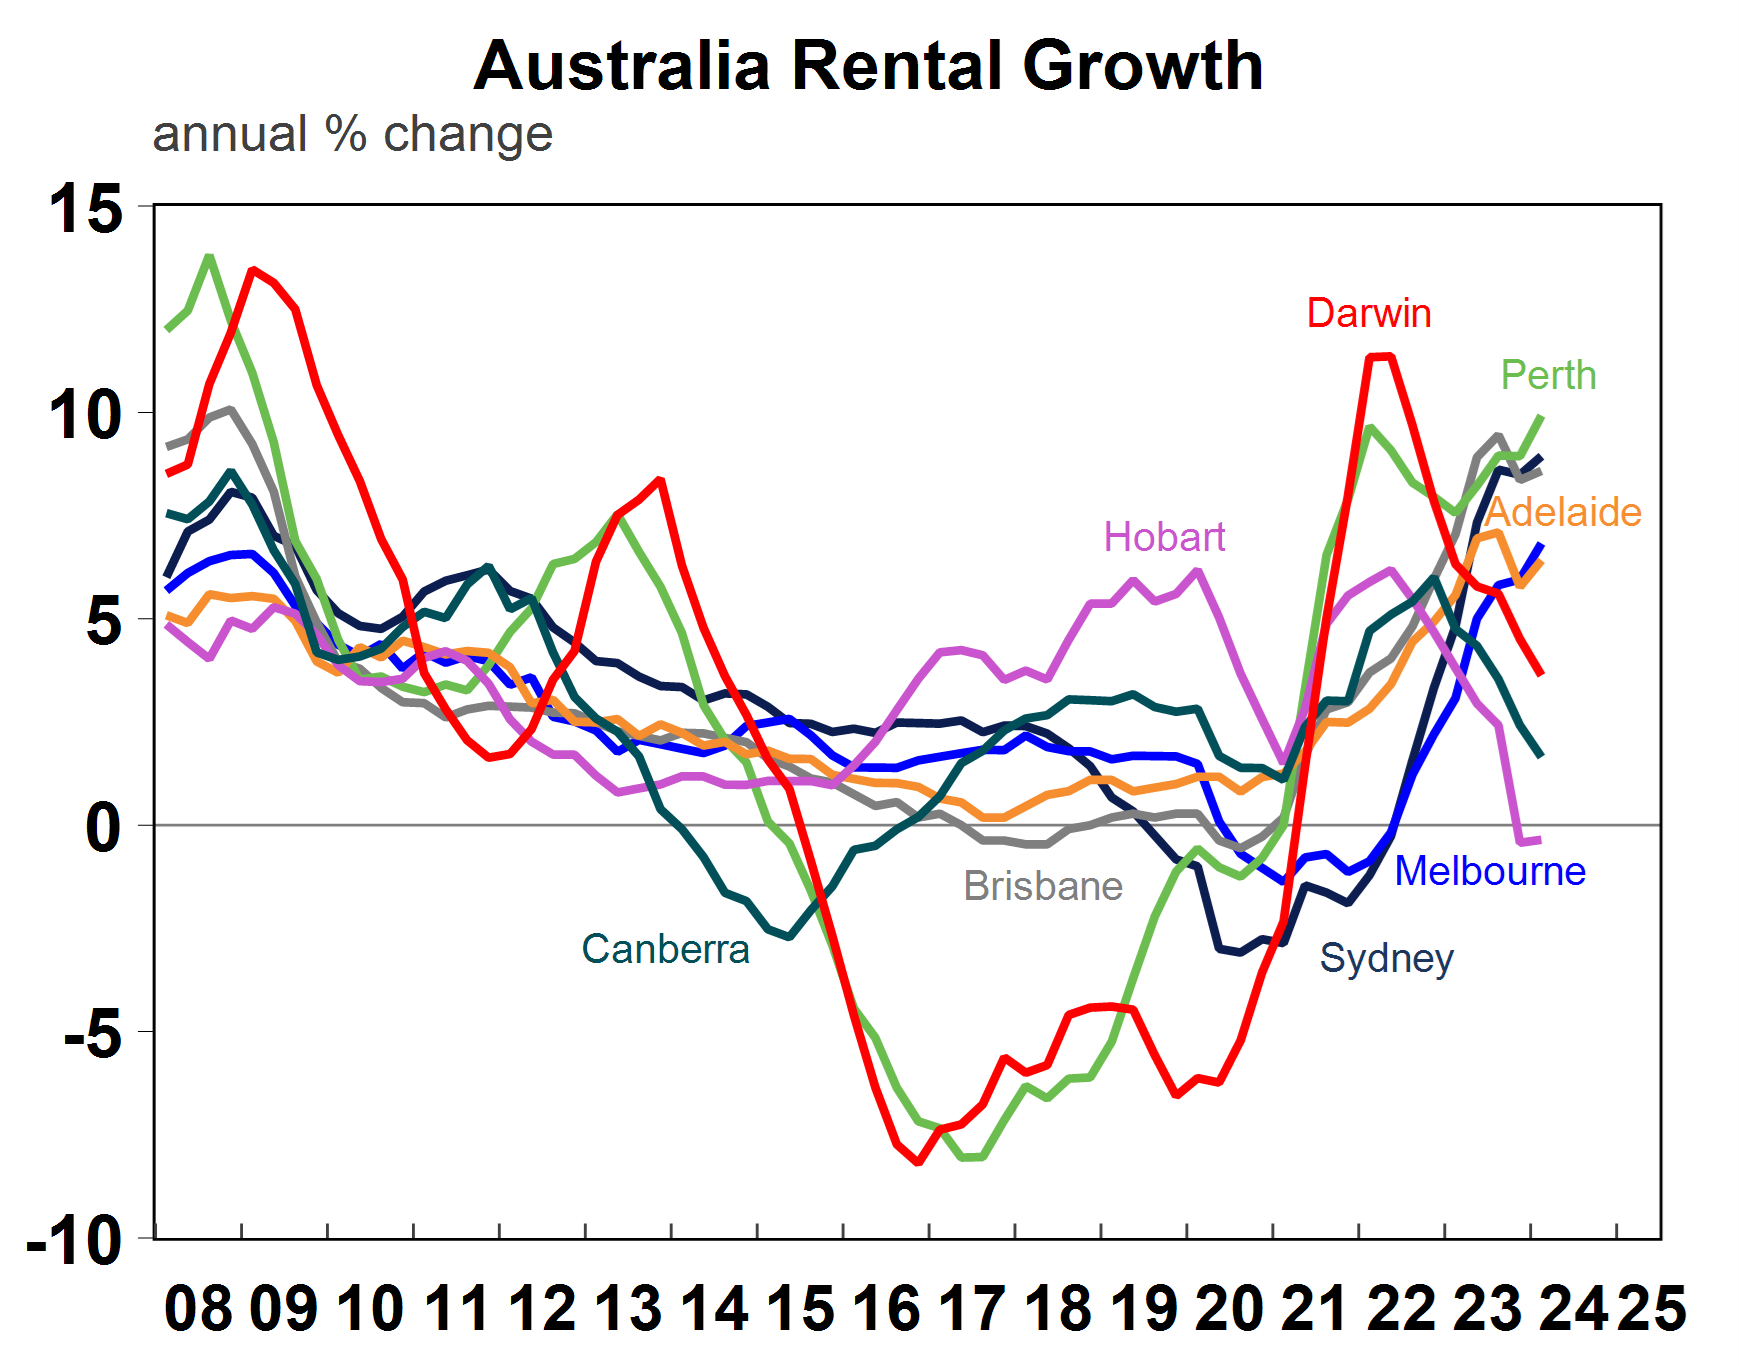
Source: Macrobond, AMP
State budgets
The state and territory budgets didn’t have any major concrete policies to target dwelling supply, besides more aspirational plans to build additional homes (for example Victoria had the most ambitious targets to build 80K homes per year for the next decade). A lot of the focus both in the state and federal budget was on increasing social and affordable housing, supporting crisis and transitional accommodation repairing public homes, greater funding allocation for homelessness services and helping build the capacity of Aboriginal and Torres Strait Islander community controlled housing organisations. Most states have first home buyer grants available for new dwellings along with stamp duty concessions. QLD has the most generous first home buyer policy now, doubling the grant in this year’s budget for some time.
Implications for investors
Fundamentally, Australia is not building enough homes to keep up with demand which is putting upward pressure on home prices and rents. States that have the highest level of undersupply like Qld and NSW need to lift construction levels significantly. However, based on current levels of building approvals, issues with labour shortages and high material costs we think that construction levels will remain below underlying demand and keep upward pressure on home prices for some time yet.

Weekly marketing update 29-11-2024
29 November 2024 | Blog Shares have been mixed over the last week with lots of noise around Trump including tariff posts, political uncertainty in France and another elevated inflation reading in the US, but mostly solid US economic data and news of a cease fire between Israel and Hezbollah. Read more
Weekly market update 22-11-2024
22 November 2024 | Blog Against a backdrop of geopolitical risk and noise, high valuations for shares and an eroding equity risk premium, there is positive momentum underpinning sharemarkets for now including the “goldilocks” economic backdrop, the global bank central cutting cycle, positive earnings growth and expectations of US fiscal spending. Read more
Oliver's insights - Trump challenges and constraints
19 November 2024 | Blog Why investors should expect a somewhat rougher ride, but it may not be as bad as feared with Donald Trump's US election victory. Read moreWhat you need to know
While every care has been taken in the preparation of this article, neither National Mutual Funds Management Ltd (ABN 32 006 787 720, AFSL 234652) (NMFM), AMP Limited ABN 49 079 354 519 nor any other member of the AMP Group (AMP) makes any representations or warranties as to the accuracy or completeness of any statement in it including, without limitation, any forecasts. Past performance is not a reliable indicator of future performance. This document has been prepared for the purpose of providing general information, without taking account of any particular investor’s objectives, financial situation or needs. An investor should, before making any investment decisions, consider the appropriateness of the information in this document, and seek professional advice, having regard to the investor’s objectives, financial situation and needs. This article is solely for the use of the party to whom it is provided and must not be provided to any other person or entity without the express written consent AMP. This article is not intended for distribution or use in any jurisdiction where it would be contrary to applicable laws, regulations or directives and does not constitute a recommendation, offer, solicitation or invitation to invest.
The information on this page was current on the date the page was published. For up-to-date information, we refer you to the relevant product disclosure statement, target market determination and product updates available at amp.com.au.