

Key points
- The angst around generational wealth inequality in Australia reflects significant asset price appreciation in older household groups (mostly Baby Boomers) while growth in wealth for younger households like Millennials has been lower.
- The increase in asset prices that has fuelled the growth in household wealth is mostly the result of good luck from the 40-year decline in interest rates that lifted equities and home prices. The chronic housing supply shortfall has also impacted, in the case of home prices.
- High wealth inequality is an issue because if it dampens living standards across generations it can cause resentment and social instability.
- Addressing the housing demand/supply imbalance is the best government policy response that can help this issue.
Introduction
Household wealth or net worth is a measure of a household’s assets less its liabilities. Household wealth always generates a lot of interest in Australia which probably comes down to the obsession with housing. Around 70% of household wealth is tied to the value of the home (made up of land and dwelling). In the short-term, changes in household wealth can have implications for household savings and spending, through the “wealth effect” as households can draw on their wealth holdings to fund consumption or other asset purchases. In the long-term, household wealth has an important bearing on retirement savings, reliance on the aged pension and living standards. In this Econosights we look at the current issues in Australia around the generational divide in household wealth.
Income and wealth across generations
Comparisons of wealth inequality across generations has been a popular topic of debate in Australia, from popularised slogans like “OK Boomer” to generalisations about the “smashed avo eating” millennial and Gen Z generations. This has also extended into the debate around the recent impact of interest rate hikes. Interest rate changes always affect households with a mortgage the most (30% of households have a mortgage in Australia). But in this current interest rate tightening cycle which started in 2022, the impact of rate hikes has arguably been felt more unequally because of large differences in the stock of housing debt which has been made worse by increasing interest rates after a long period of falling rates. Younger households are more likely to have taken out taken out large mortgages in recent years (at low interest rates), which now need to be serviced with higher interest rates which eats into disposable income. In contrast, older households’ disposable income has not been hit as much because this group tends to have small or little housing debt and can draw down on their savings to fund spending (rather than using savings to fund mortgage repayments).
The chart below from the Commonwealth Bank’s profit result earlier this year demonstrates this divide. It looks at the difference in savings and spending across the various household groups. It shows that savings for younger households (those aged under 45) have fallen relative to a year ago and spending growth has also been low. In contrast, older households (those aged over 45) have been increasing their savings and spending (which makes sense with high savings rates available thanks to interest rate hikes) indicating little impact flowing to those groups from rising interest rates. This divergence in spending and savings across the different ages reflects the fall in disposable income for younger households paying off mortgages as a result of higher interest rates.
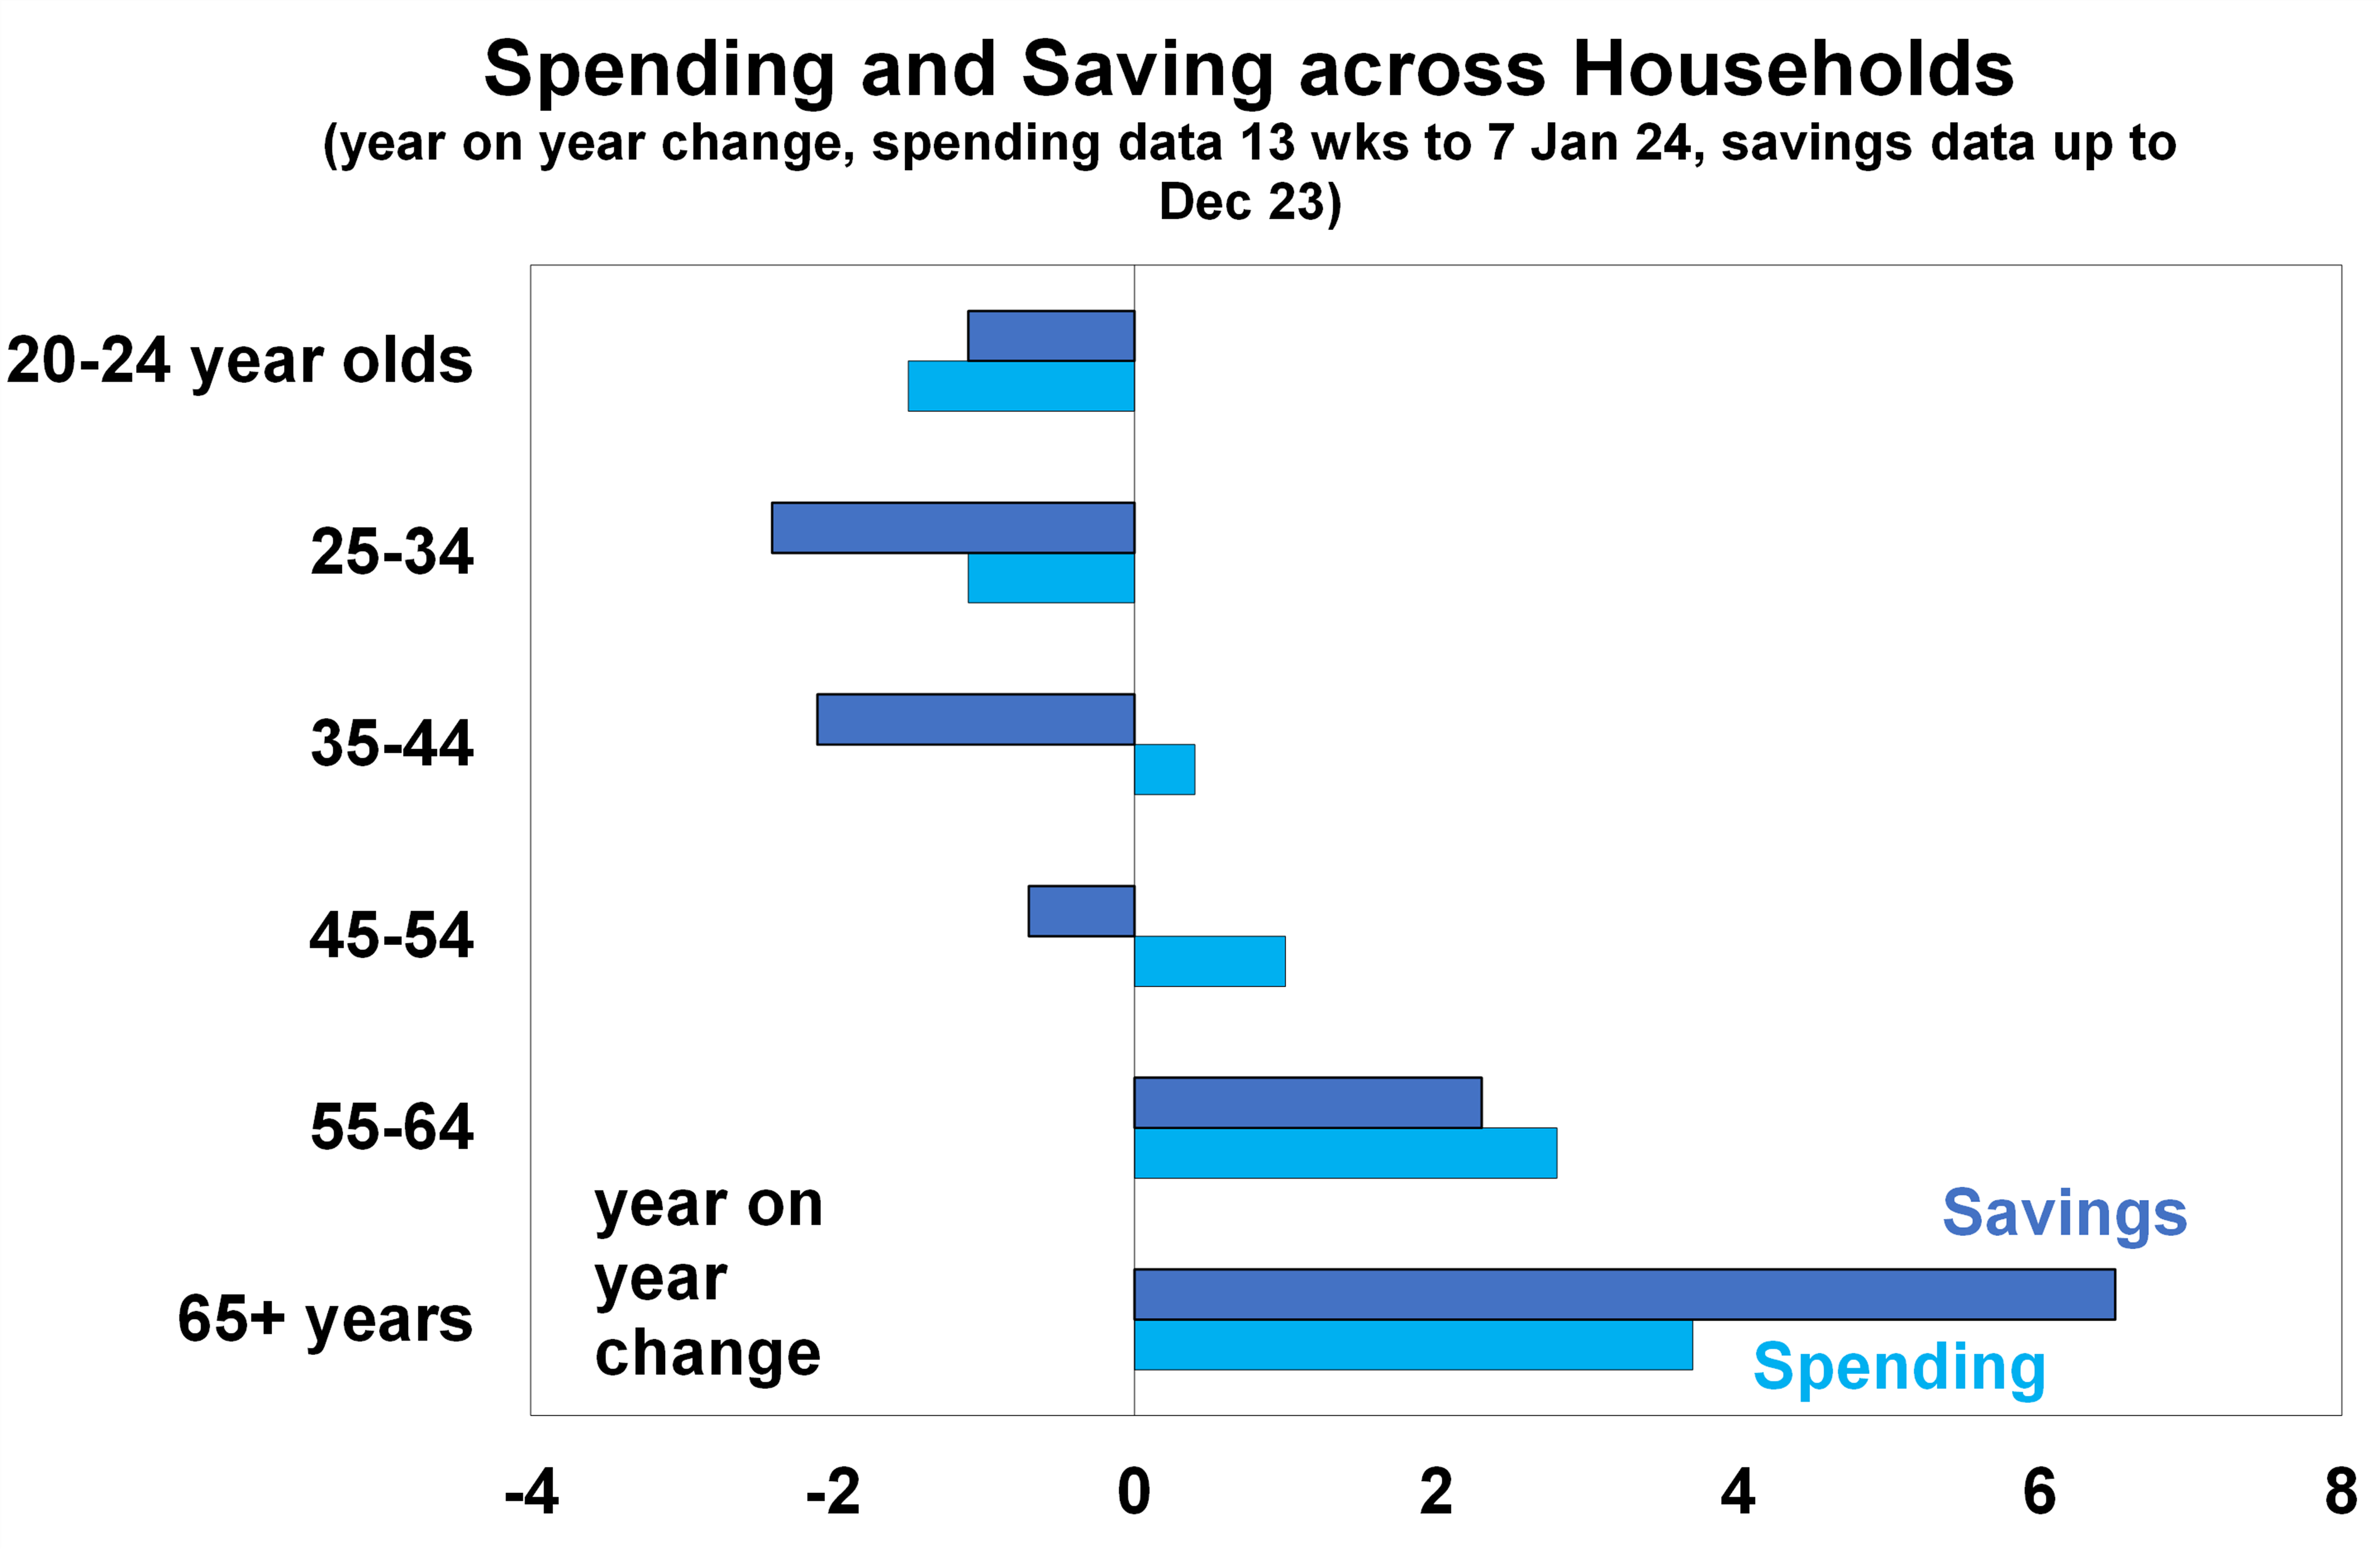
Source: CBA, AMP
The Australian Bureau of Statistics gives data on annual household income and wealth through time. Using this data, we have looked at household income and wealth by generation (based on the midpoint of their year of birth). The next chart looks at average household income by generation, through time. It is self-explanatory that incomes increase with age, with the fastest pace of income growth from when people reach their mid-30s into their early 50s in line with career progression before flattening out into older age as households retire and drawn down on the government aged pension and/or their superannuation savings to subsidise spending. Gen X incomes started exceeding the Baby Boomers from 2008, as Gen X households enter the peak point of their career and experience higher incomes. Millennial incomes now also exceed Baby Boomers and will exceed Gen X in under a decade when Millennials reach middle age.
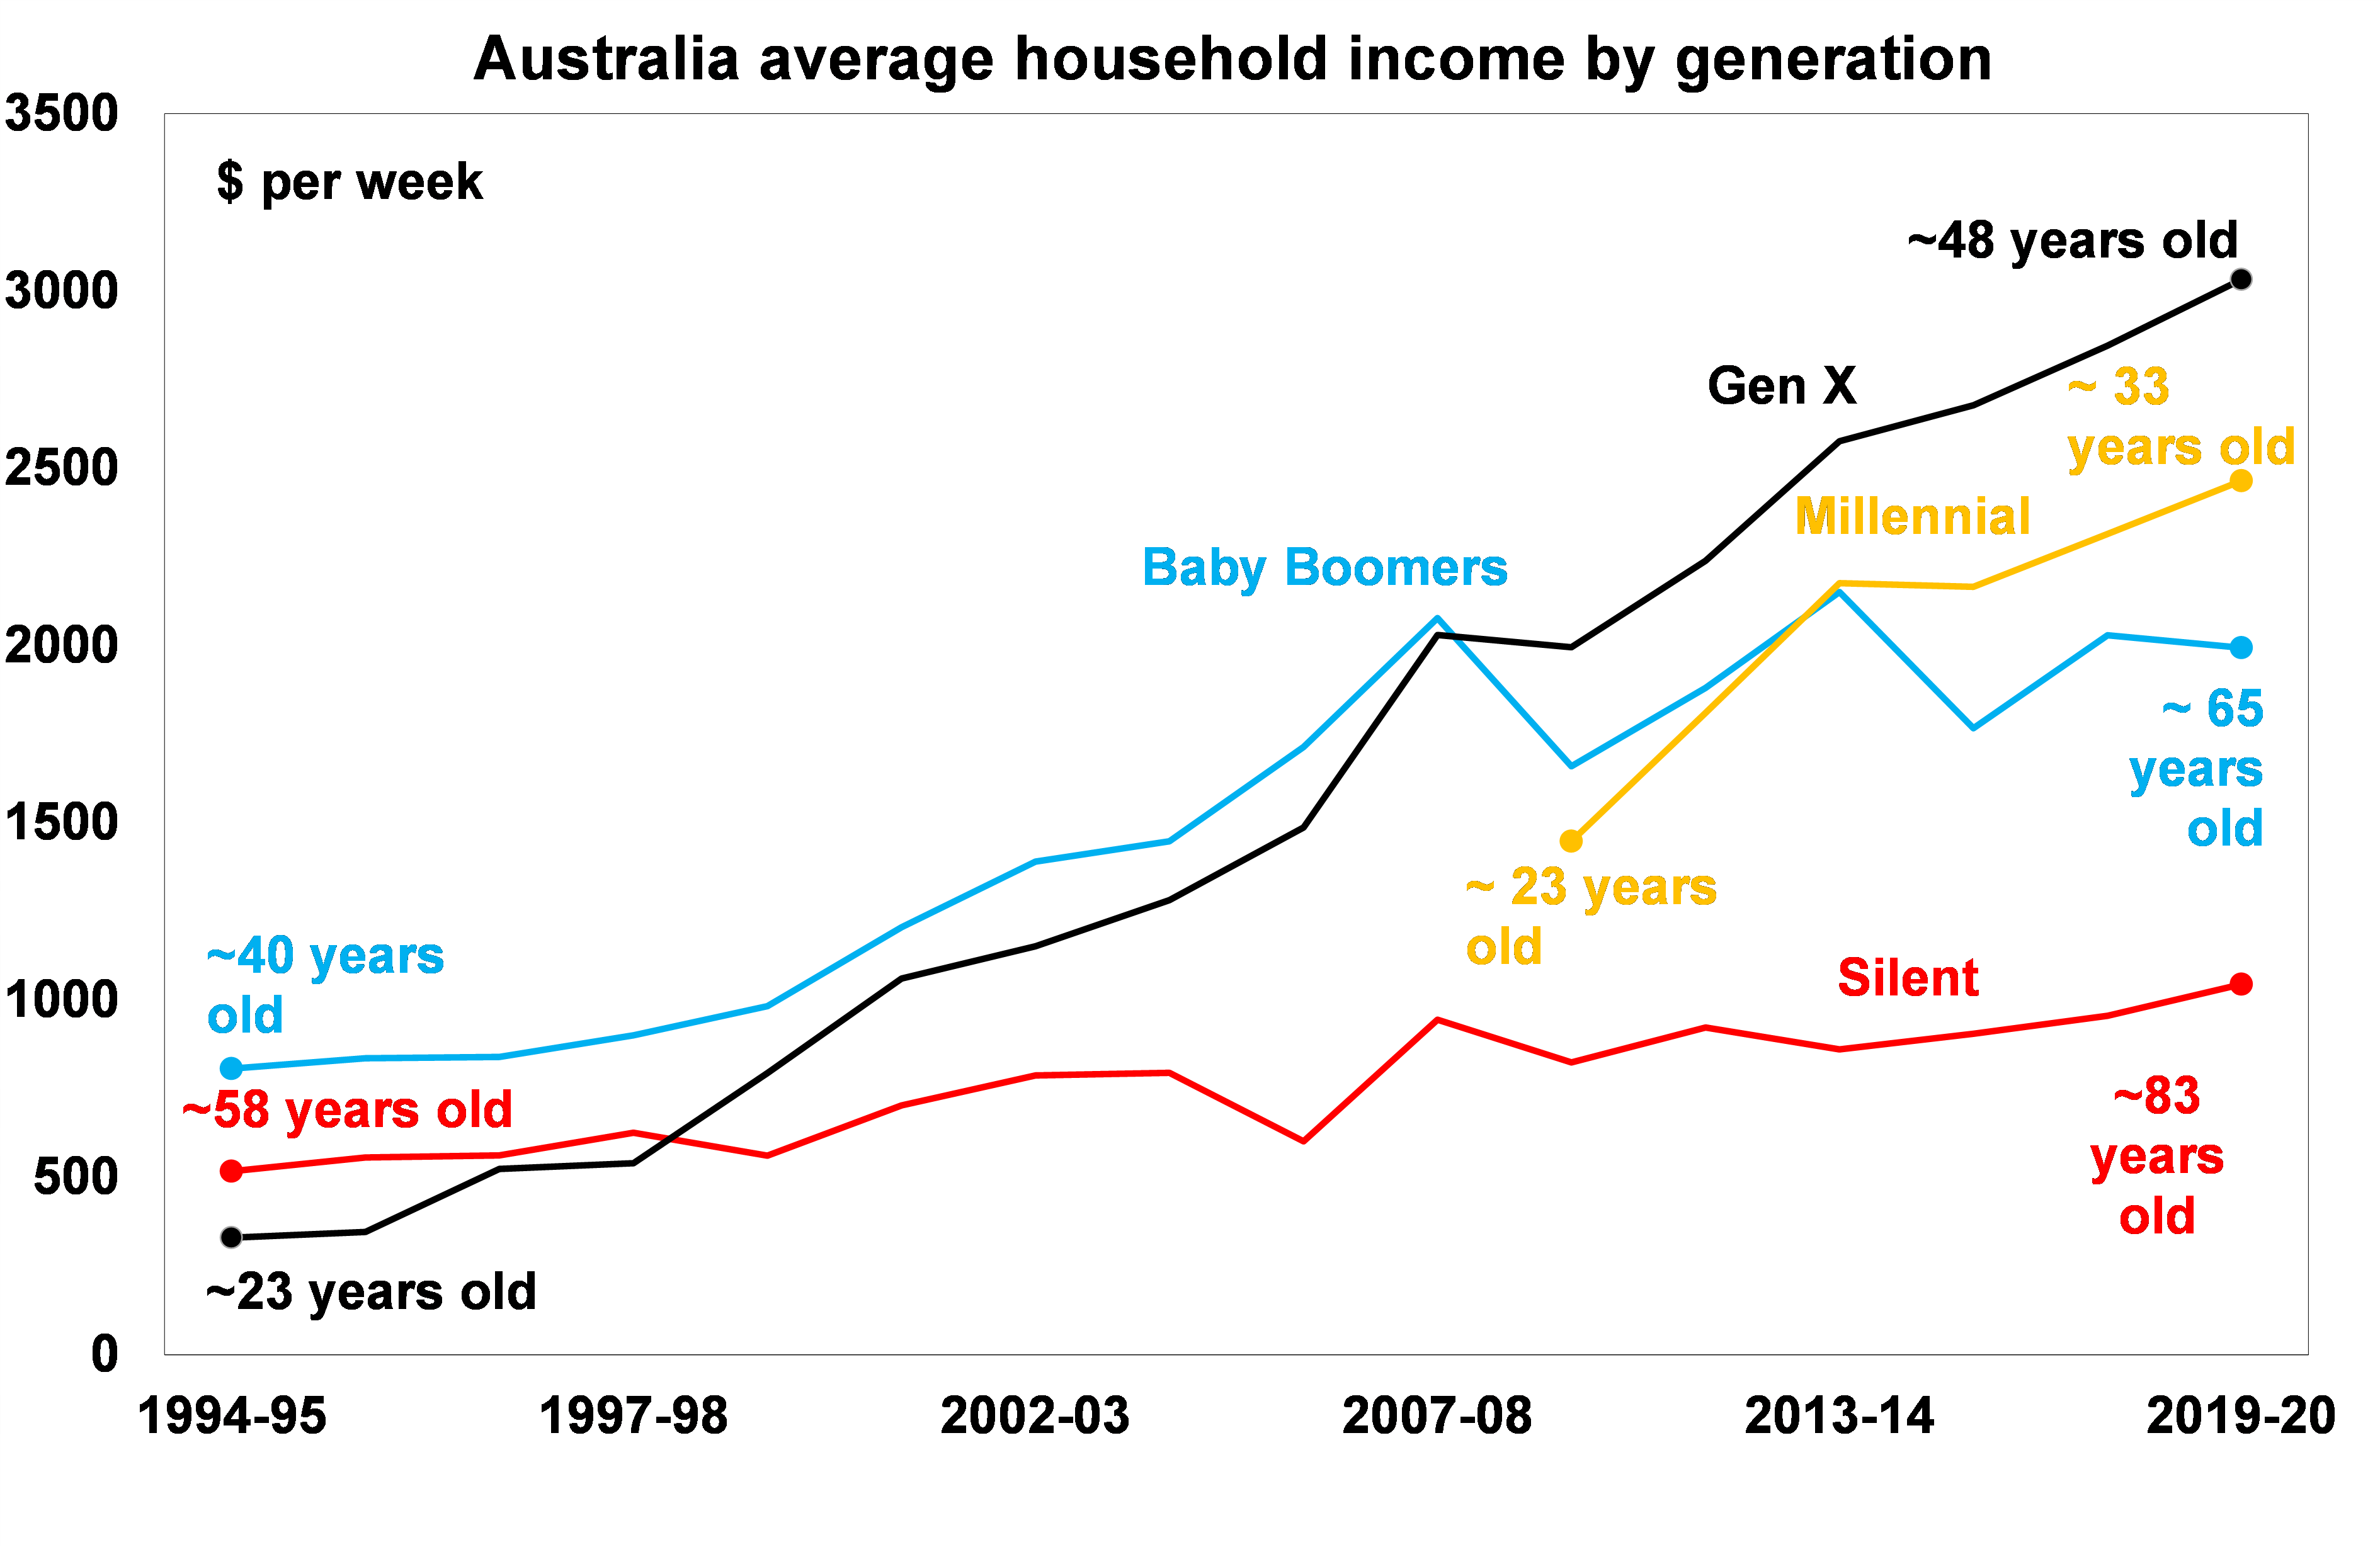
Source: ABS, AMP
Like income, household wealth also increases through time. The chart below looks at average household net worth by generation. Each generation has enjoyed an increase in wealth over time (allowing for the fact that the data only goes back to 2003 so it’s hard to see the starting point for the Silent and Boomer generations). But the growth in Boomers’ wealth has been arguably better compared to other generations, which has lifted the ratio of the wealth gap between the older and younger generations.
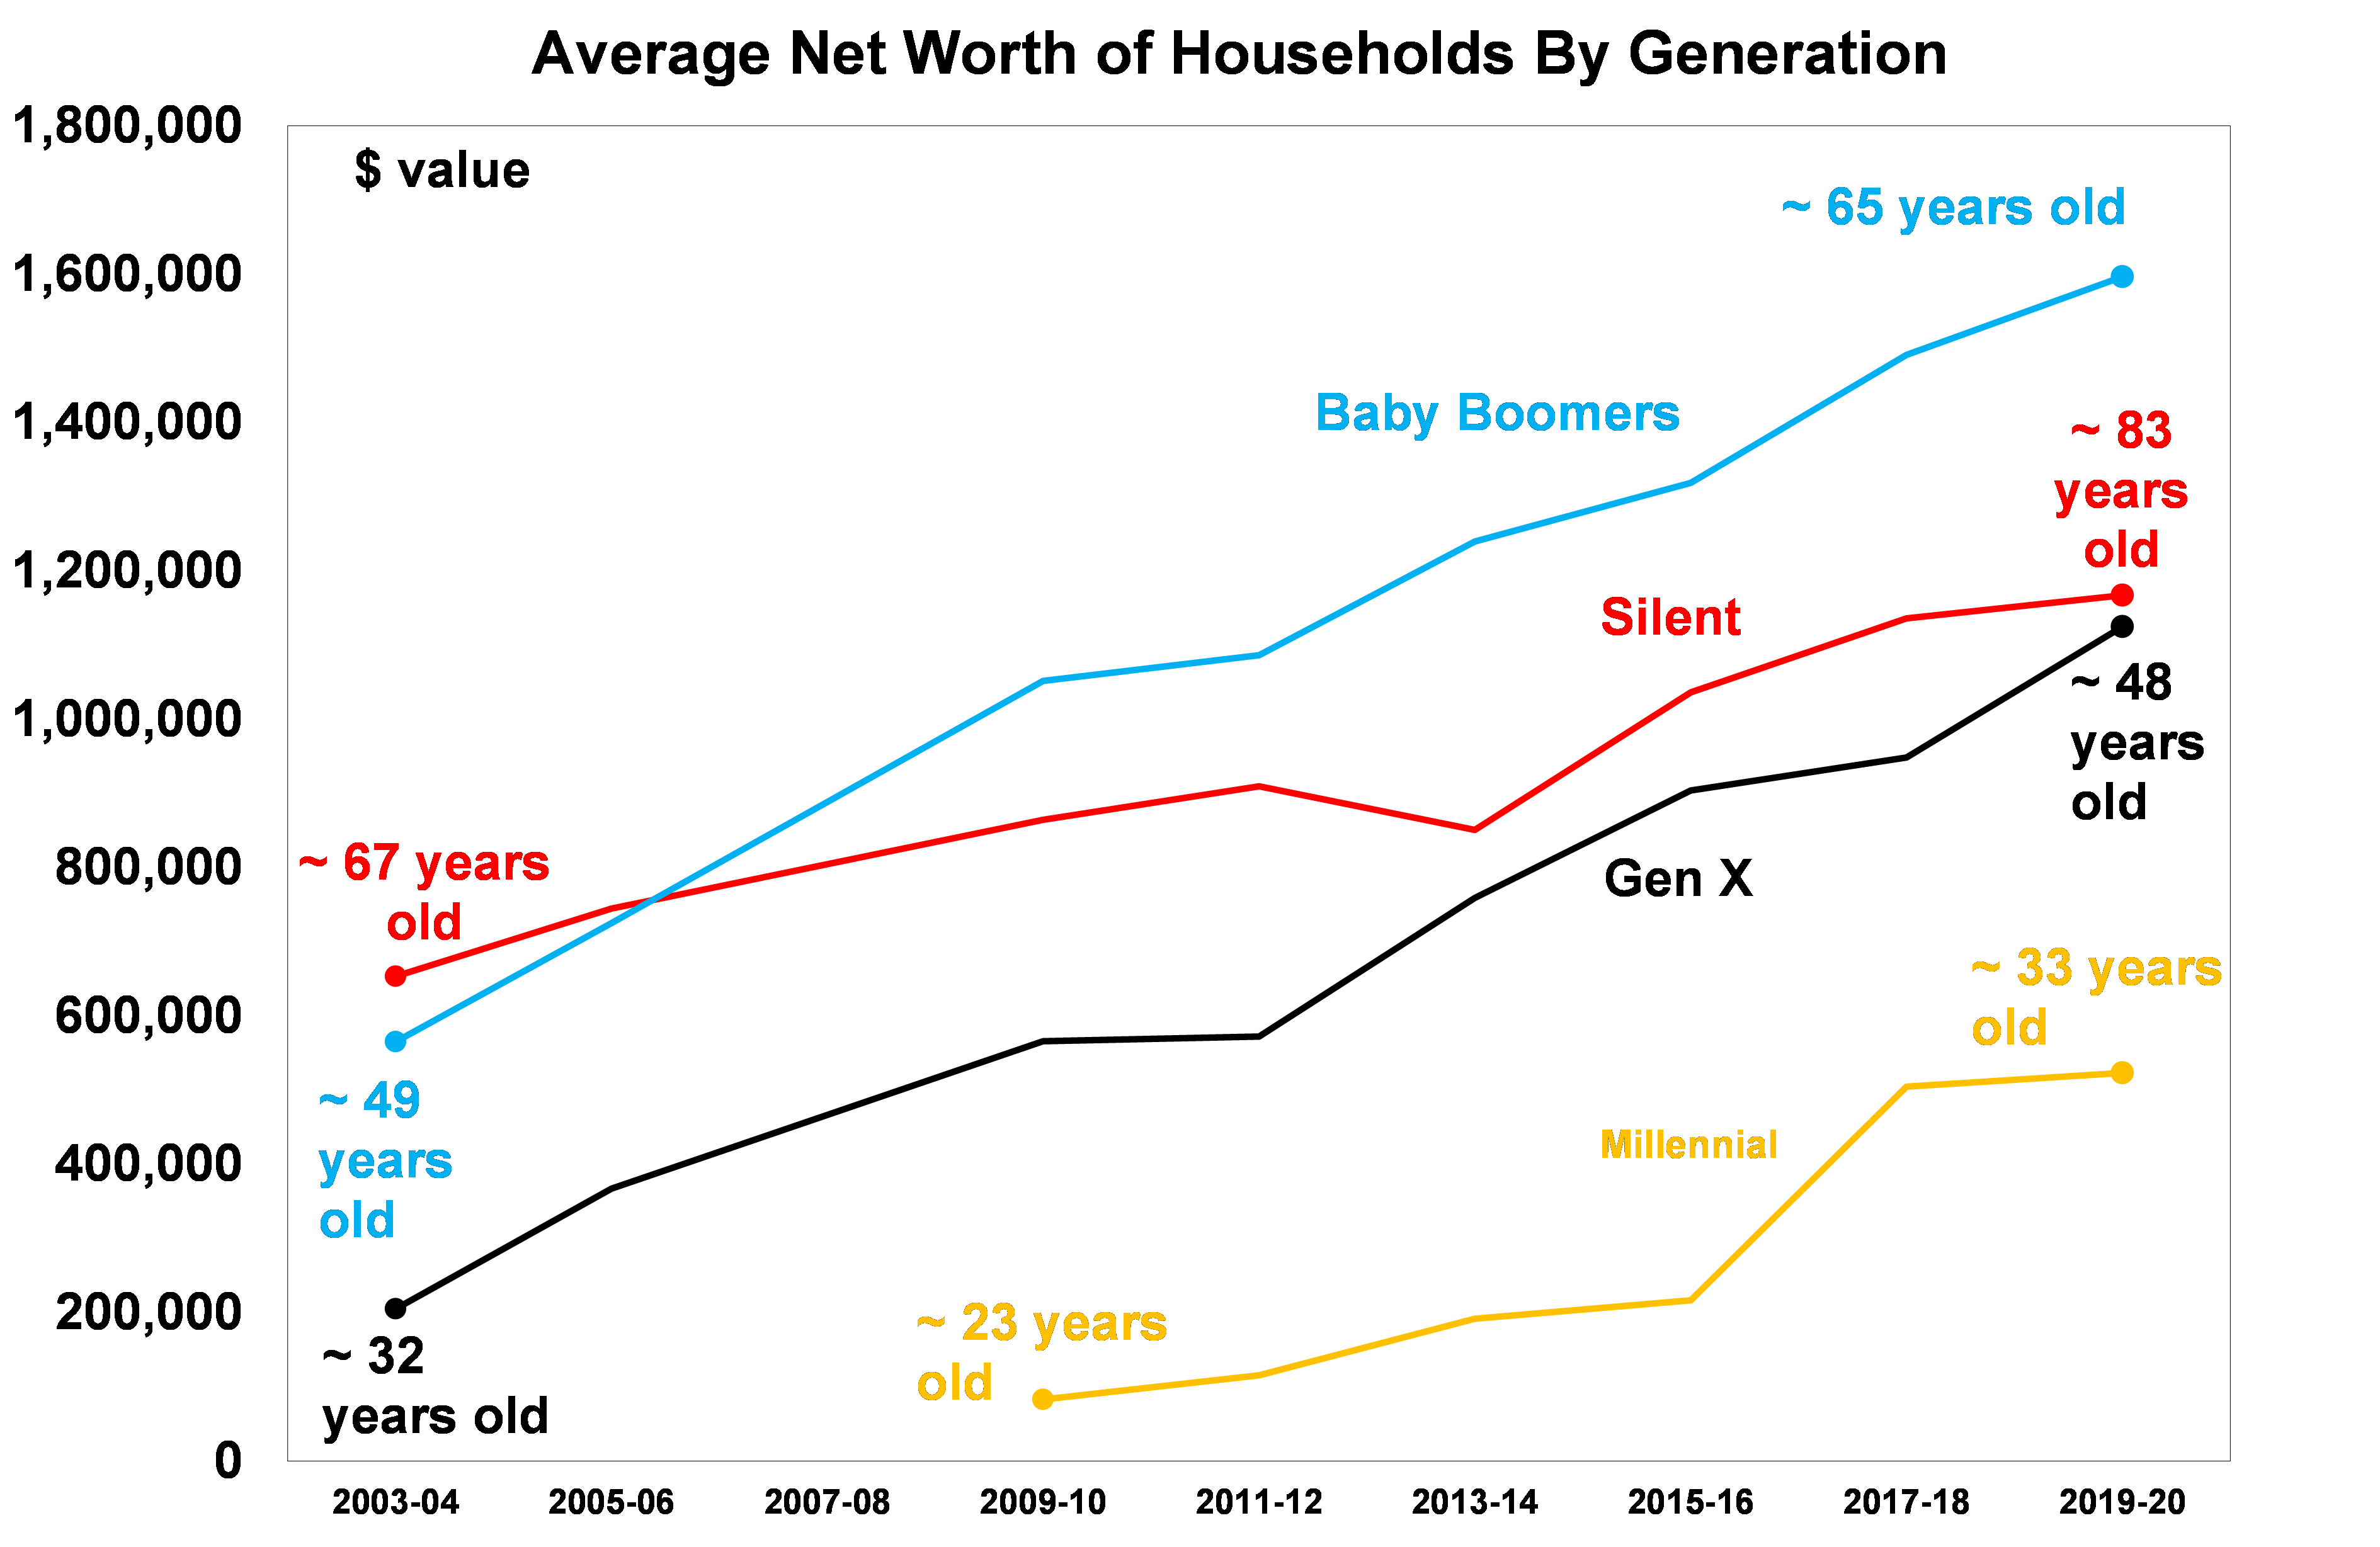
Source: ABS, AMP
The growth in wealth for the Baby Boomers has been down to good luck in asset price, with ~8% growth in home prices over the last 30 years (which has meant that it used to take 6 years to save for a 20% deposit whereas now it takes nearly 11 years), over 9% growth in Australian equities over the last 30 years and the steady rise in the superannuation contribution from 9% in the early 2000’s to 11.5% this year which is a form of forced saving. The Australian tax system has a favourable treatment of housing (through the capital gains tax discount, negative gearing and exclusion of the family home from the aged pension test), but has not been the main driver of asset price growth.
The wealth of older households does eventually get passed down to the next generation, so there will be a big transfer of wealth from Baby Boomers to Gen X. Older households do appear to be helping their family members now more than in previous times. Some findings suggest that around 60% of new first home buyers are accessing help from the bank of mum and dad (which should actually expand to be the bank of mum and dad and grandparents) and is becoming a top 10 lender in the market. But, relying on the wealth of parents or grandparents creates inequality because it is not available to everyone.
Every generation faces its own challenges. However, the economic environment can make significant differences to income, savings, retirement and therefore lifestyle. Despite the negatives on the wealth front, the young generations are entering the labour market at a time when conditions are tight (which should mean easier access to work although the youth unemployment rate has been rising in Australia) and flexible work means more job opportunities. High wages growth also means that starting incomes for young people are attractive. The younger generation also has a better ability and accessibility to invest in a broad range of assets and seems to be taking on riskier investments. The chart below shows that Gen Z are much more likely to hold riskier investments of cryptocurrencies, international shares and exchange traded funds (or ETFs) compared to older households. This allows for large potential upside but also more downside if things go wrong. The greater risk tolerance of Gen Z reflects the more secure and materially comfortable economic environment they have grown up in.
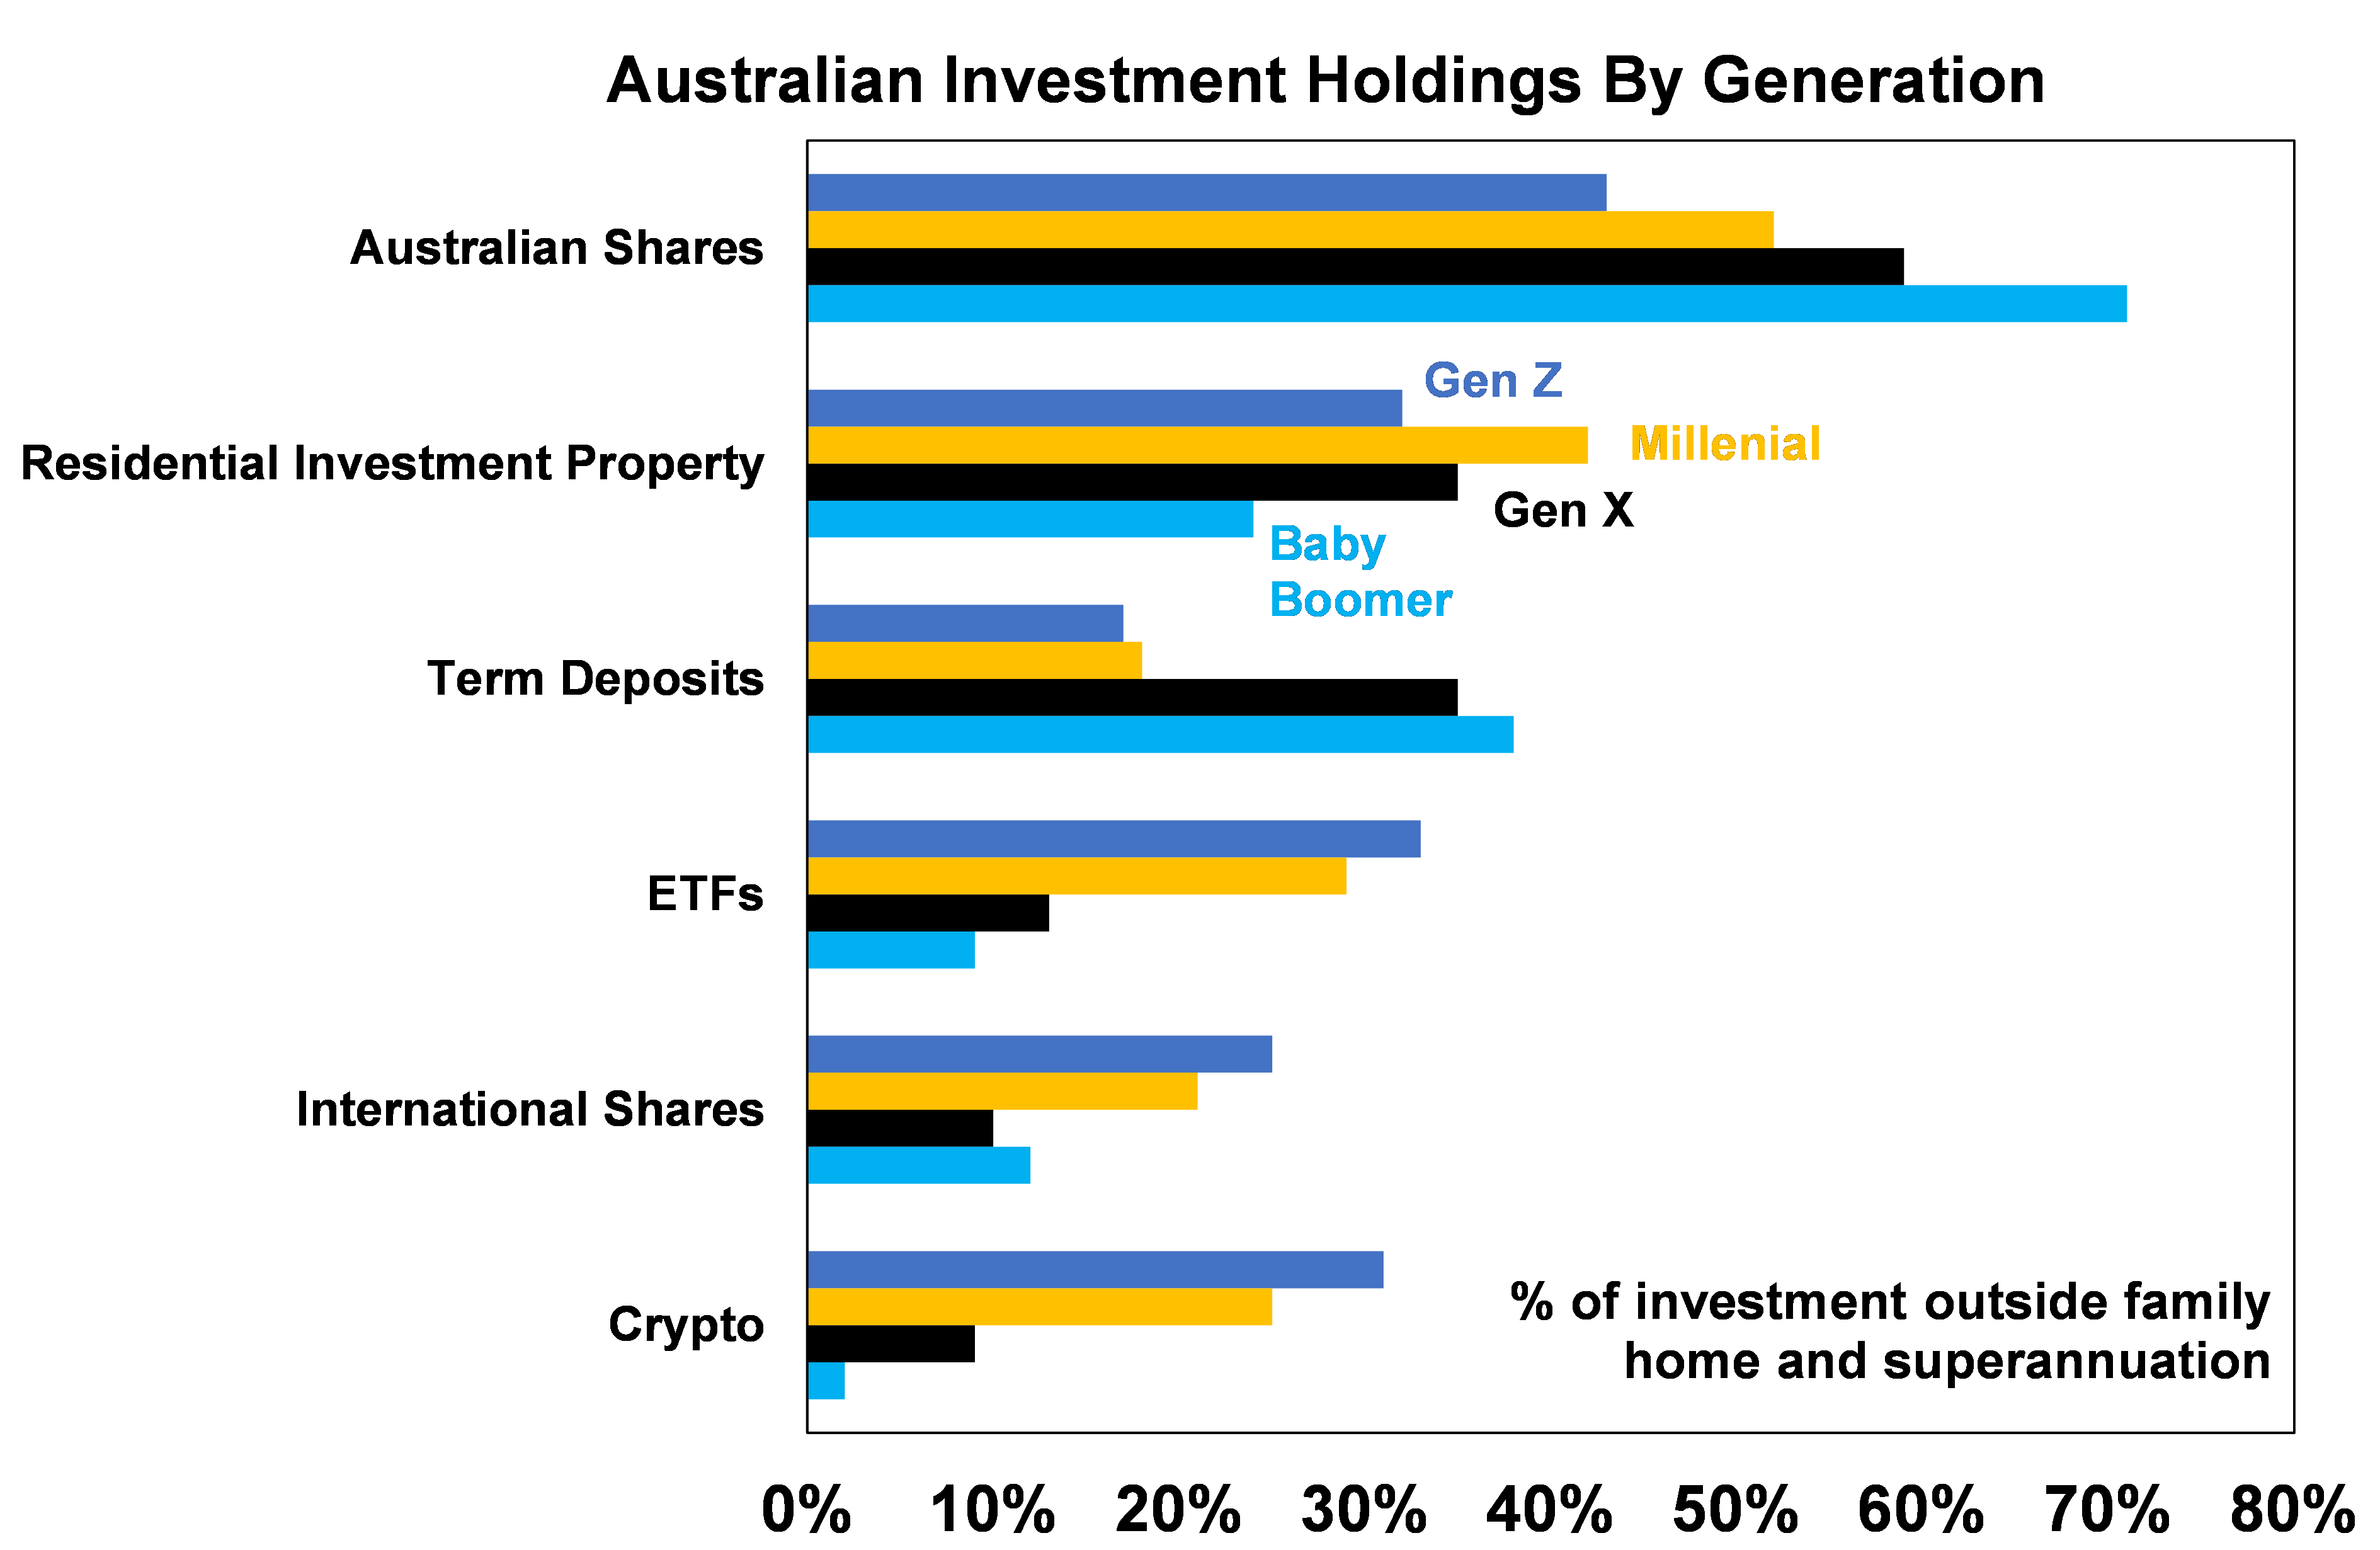
Source: ASX, AMP
Implications for policy
The increasing divide in wealth between older and younger household groups is difficult to address because it mostly involves a period of good luck for the Boomer generation which can’t be undone. What can be solved by policy is an improvement in housing affordability. Addressing housing affordability is important because households that hold large debt burdens are a financial stability risk in times of rising interest rates and poor economic growth, especially if the unemployment rate increases. It could also mean that through time more households enter retirement with mortgages which puts pressure on government aged care spending. Although, it is also tricky to “fix” affordability because to make housing cheaper for Millennials, Gen Z and future generations would require a significant drop in home prices which hurts those already invested in housing and has broader negative implications for the economy. The main policy solution to improve affordability is to increase housing supply, to avoid putting excess upward pressure on home prices and rents.
Addressing housing supply issues can be done through providing incentives for older households to downsize, releasing more land, speeding up approval processes, encouraging growth in regional centres and investing in infrastructure in those areas. A broad review on the tax system is also needed, by looking at the capital gains tax concession, negative gearing and whether it should be limited. Although, changing tax policy related to housing now also won’t actually fix the current affordability problem and risks denying growth in wealth for future generations.
Other tax issues that could be looked at also include reducing the reliance on personal income taxes by broadening the GST (otherwise there will be an increasing reliance on Millennials and Gen Z to fund the retirement of older generations), abolishing stamp duty in favour of a land tax, looking at extensive superannuation tax concessions and considering an inheritance tax, wealth tax or gift tax.

Weekly market update 15-11-2024
15 November 2024 | Blog Global share markets were messy over the last week, not helped by the ongoing rise in bond yields and a wind back in Fed rate cut expectations after some elevated US inflation data and slightly hawkish comments from Fed chair Powell. Read more
Oliver's insights - staying focused as an investor
12 November 2024 | Blog Dr Shane Oliver suggests five ways to help manage the noise and stay focussed as an investor with the changes in the macro enviroment. Read more
Weekly market update 08-11-2024
08 November 2024 | Blog It was all about the US Presidential election this week. Despite concerns that the election outcome would be extremely close, the Republican victory was stronger than the polls and betting markets were suggesting into the lead up. Read moreWhat you need to know
While every care has been taken in the preparation of this article, neither National Mutual Funds Management Ltd (ABN 32 006 787 720, AFSL 234652) (NMFM), AMP Limited ABN 49 079 354 519 nor any other member of the AMP Group (AMP) makes any representations or warranties as to the accuracy or completeness of any statement in it including, without limitation, any forecasts. Past performance is not a reliable indicator of future performance. This document has been prepared for the purpose of providing general information, without taking account of any particular investor’s objectives, financial situation or needs. An investor should, before making any investment decisions, consider the appropriateness of the information in this document, and seek professional advice, having regard to the investor’s objectives, financial situation and needs. This article is solely for the use of the party to whom it is provided and must not be provided to any other person or entity without the express written consent AMP. This article is not intended for distribution or use in any jurisdiction where it would be contrary to applicable laws, regulations or directives and does not constitute a recommendation, offer, solicitation or invitation to invest.
The information on this page was current on the date the page was published. For up-to-date information, we refer you to the relevant product disclosure statement, target market determination and product updates available at amp.com.au.