

Key points
- Around 63% of Australians own a home, either outright or with a mortgage. This is towards the lower end of the range across comparable OECD countries.
- Australia’s relatively lower homeownership rate is one sign of the housing affordability problem. Other metrics show a similar issue, with Australia’s household debt-to-income levels at a record high at 214% and above global peers. The home-price-to-income ratio is at 9.6 times, at the high end of the range relative to peers, and nearly double its level in early 2000.
- Sydney’s home-price-to-income ratio ranks amongst one of the most expensive cities in the world. While this can be “justified” as Sydney is now a major global hub, Brisbane and Melbourne are not far behind in rankings and regional price-to-income ratios are also very elevated which shows that the problem is not just in the capital cities.
- Australia’s housing affordability issues can be improved by a significant rise in new housing construction (particularly units), better align migration to new housing supply and do a broad scale tax review which may include changes to housing-specific taxes. But there is no quick “fix” to housing affordability, the goal now is to stop it from getting worse!
Introduction
Australia’s lack of affordable housing is in the spotlight (again) and is increasingly morphing into a key battleground area for the 2025 Federal election. The common belief that Australian homes have become unaffordable is understandable, as all the metrics around affordability have deteriorated. But how does the housing situation in Australia compare to our global peers? We go through this issue in this edition of Econosights.
It's not the Great Australian Dream it’s the Great Home Ownership Dream!
They call it “The Great Australian Dream” to own a home. But in reality, isn’t it the goal of everyone to aspire to own their own home? Actually “The Great Australian Dream” was coined from the “The Great American Dream” – it was never ours to begin with! Home ownership rates around the world shows us that Australia’s ~63% home ownership rate (both mortgage and outright owners) is on the low end of the spectrum, especially compared to ex-Soviet European countries (see the next chart). High global home ownership rates indicate that it’s an aspiration of most people to own their own property. In Australia, there are around 2.5 people per dwelling, which has fallen from around 2.8 in the mid 1980s. In comparable countries, household size is similar with Canada at 2.45, the US at 2.49, UK at 2.27 and New Zealand at 2.6.
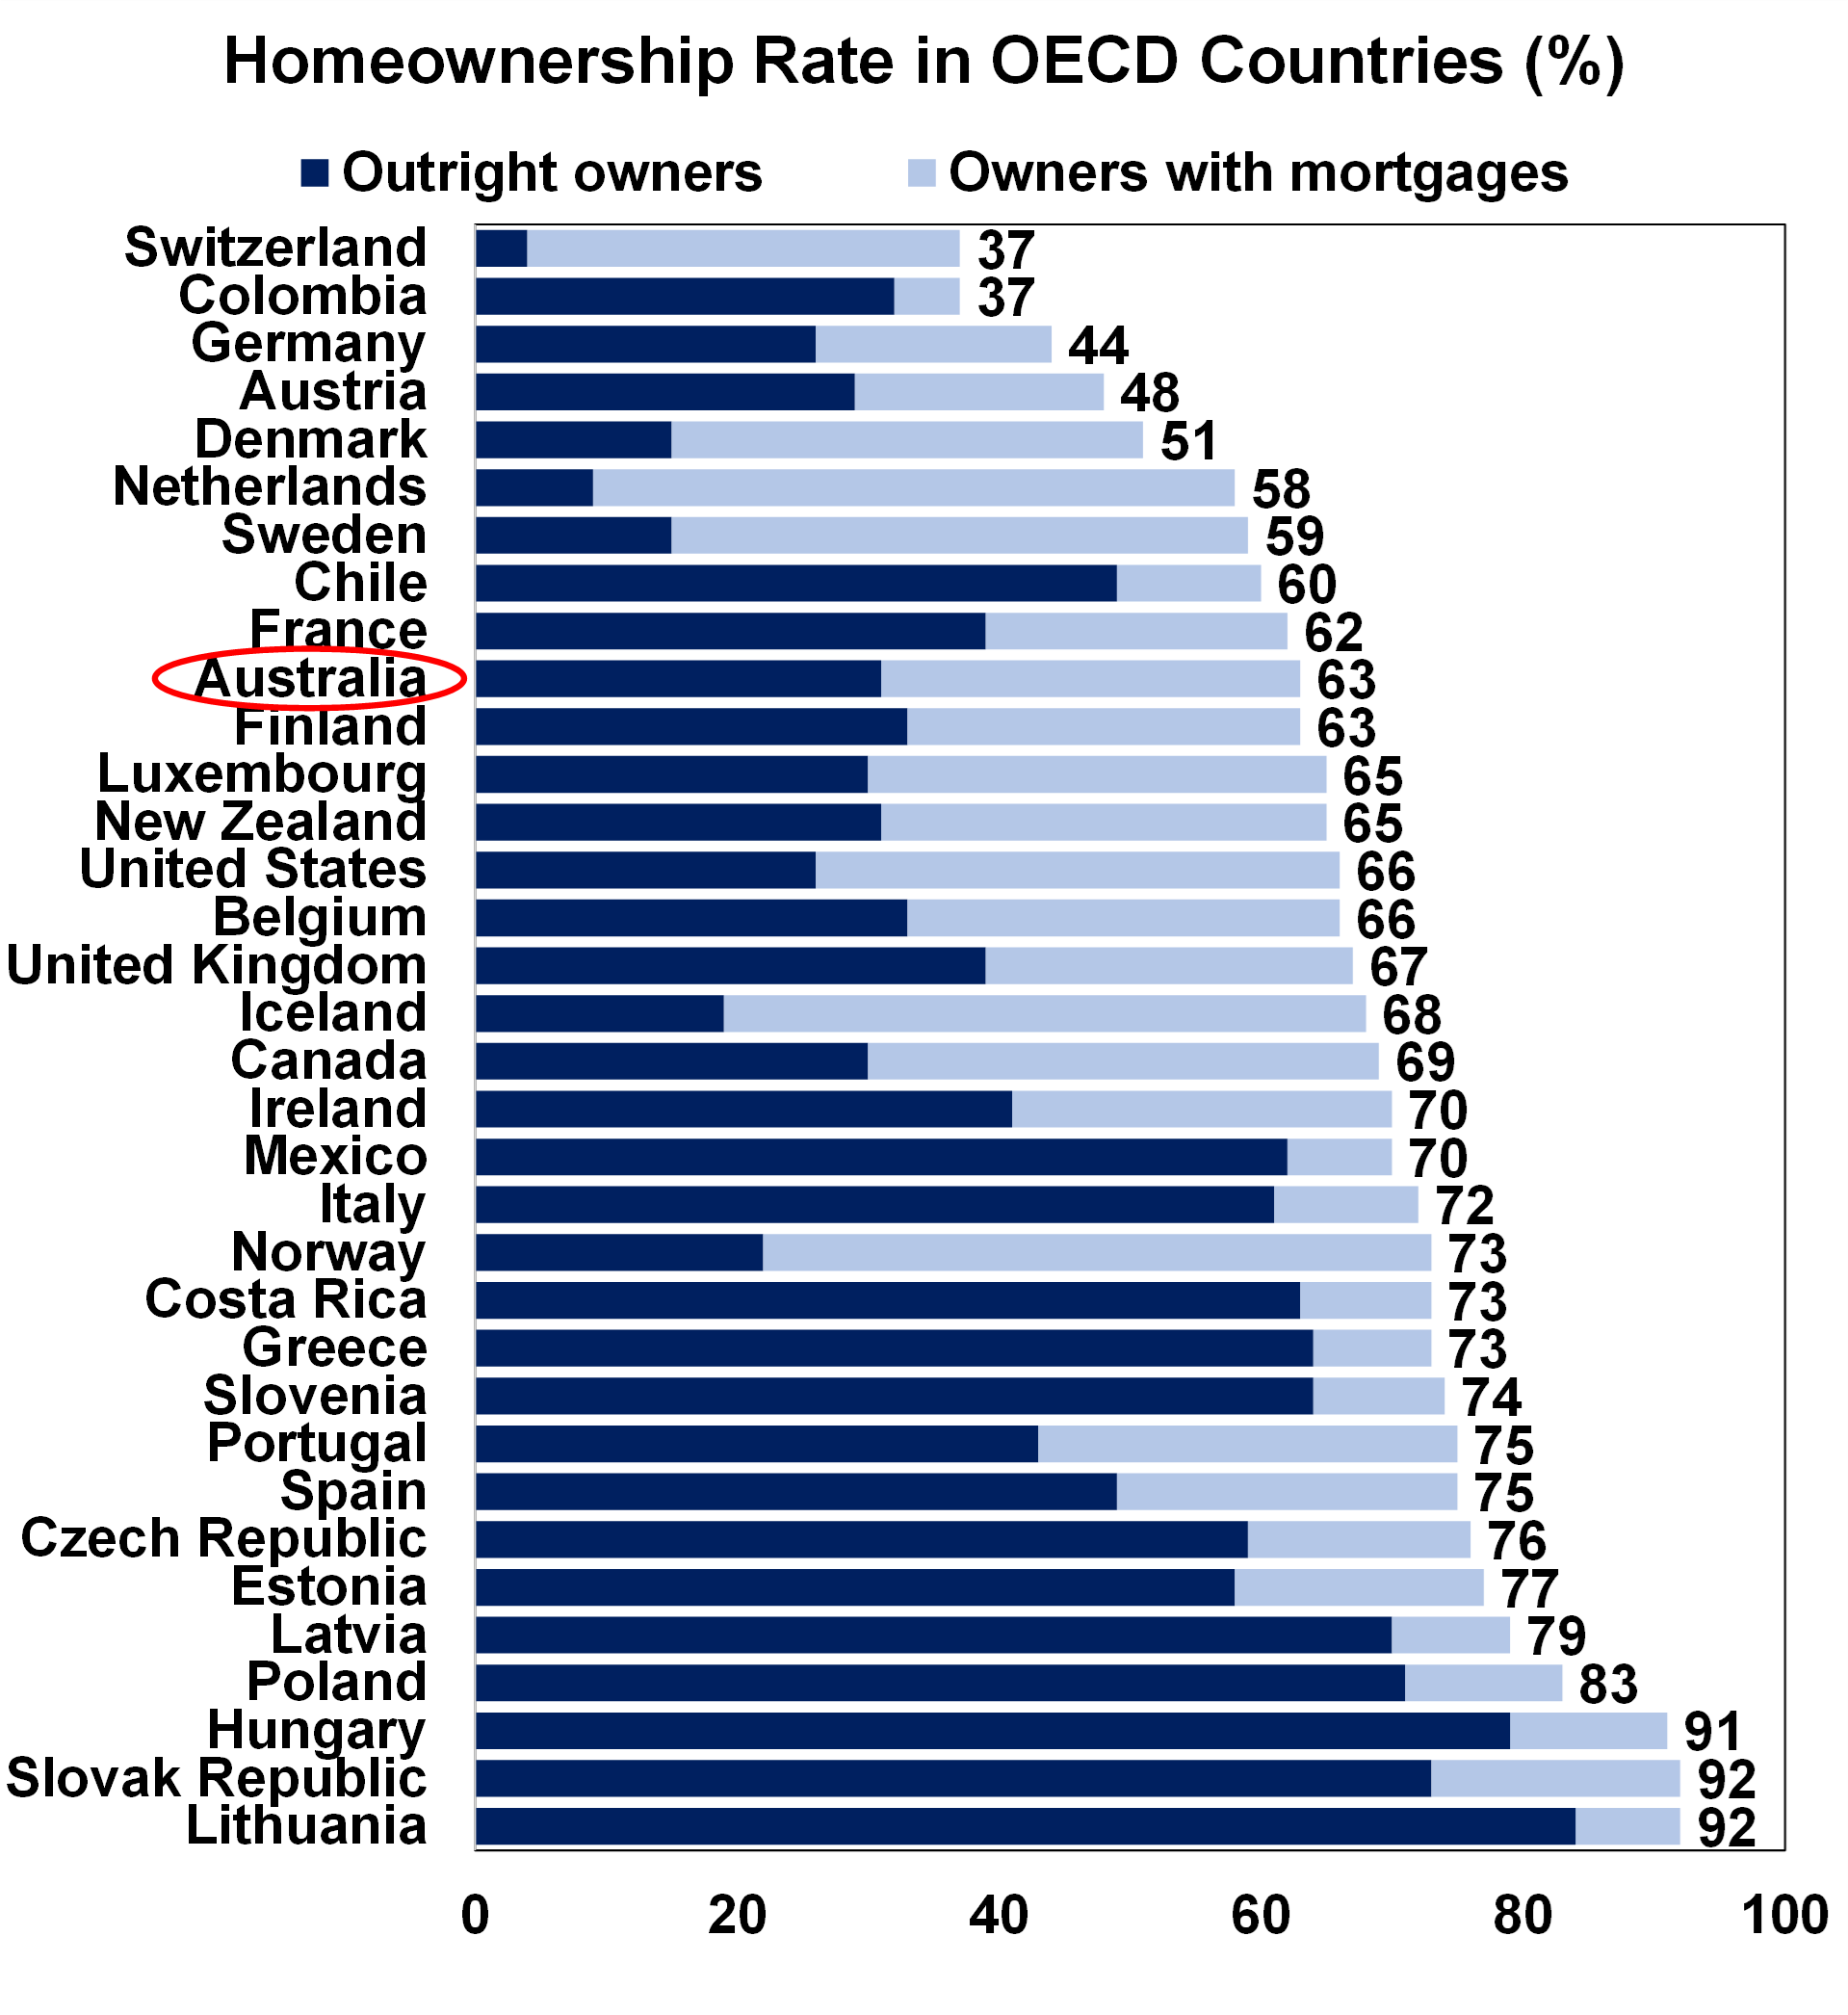
Source: OECD, AMP
Housing affordability metrics
There are numerous ways to look at housing affordability. Household debt-to-income ratios are one of them. Australia’s record high household debt statistics are well known. Household debt is more than double income, at around 214%. This is higher than our peers like the US at 110%, NZ at 137% and Canada at 184% (see the chart below). US households have been on a deleveraging cycle after the GFC and household-debt-to-income is still below its 2007 high. Australian household debt dipped briefly during the pandemic but has risen back to a record high.
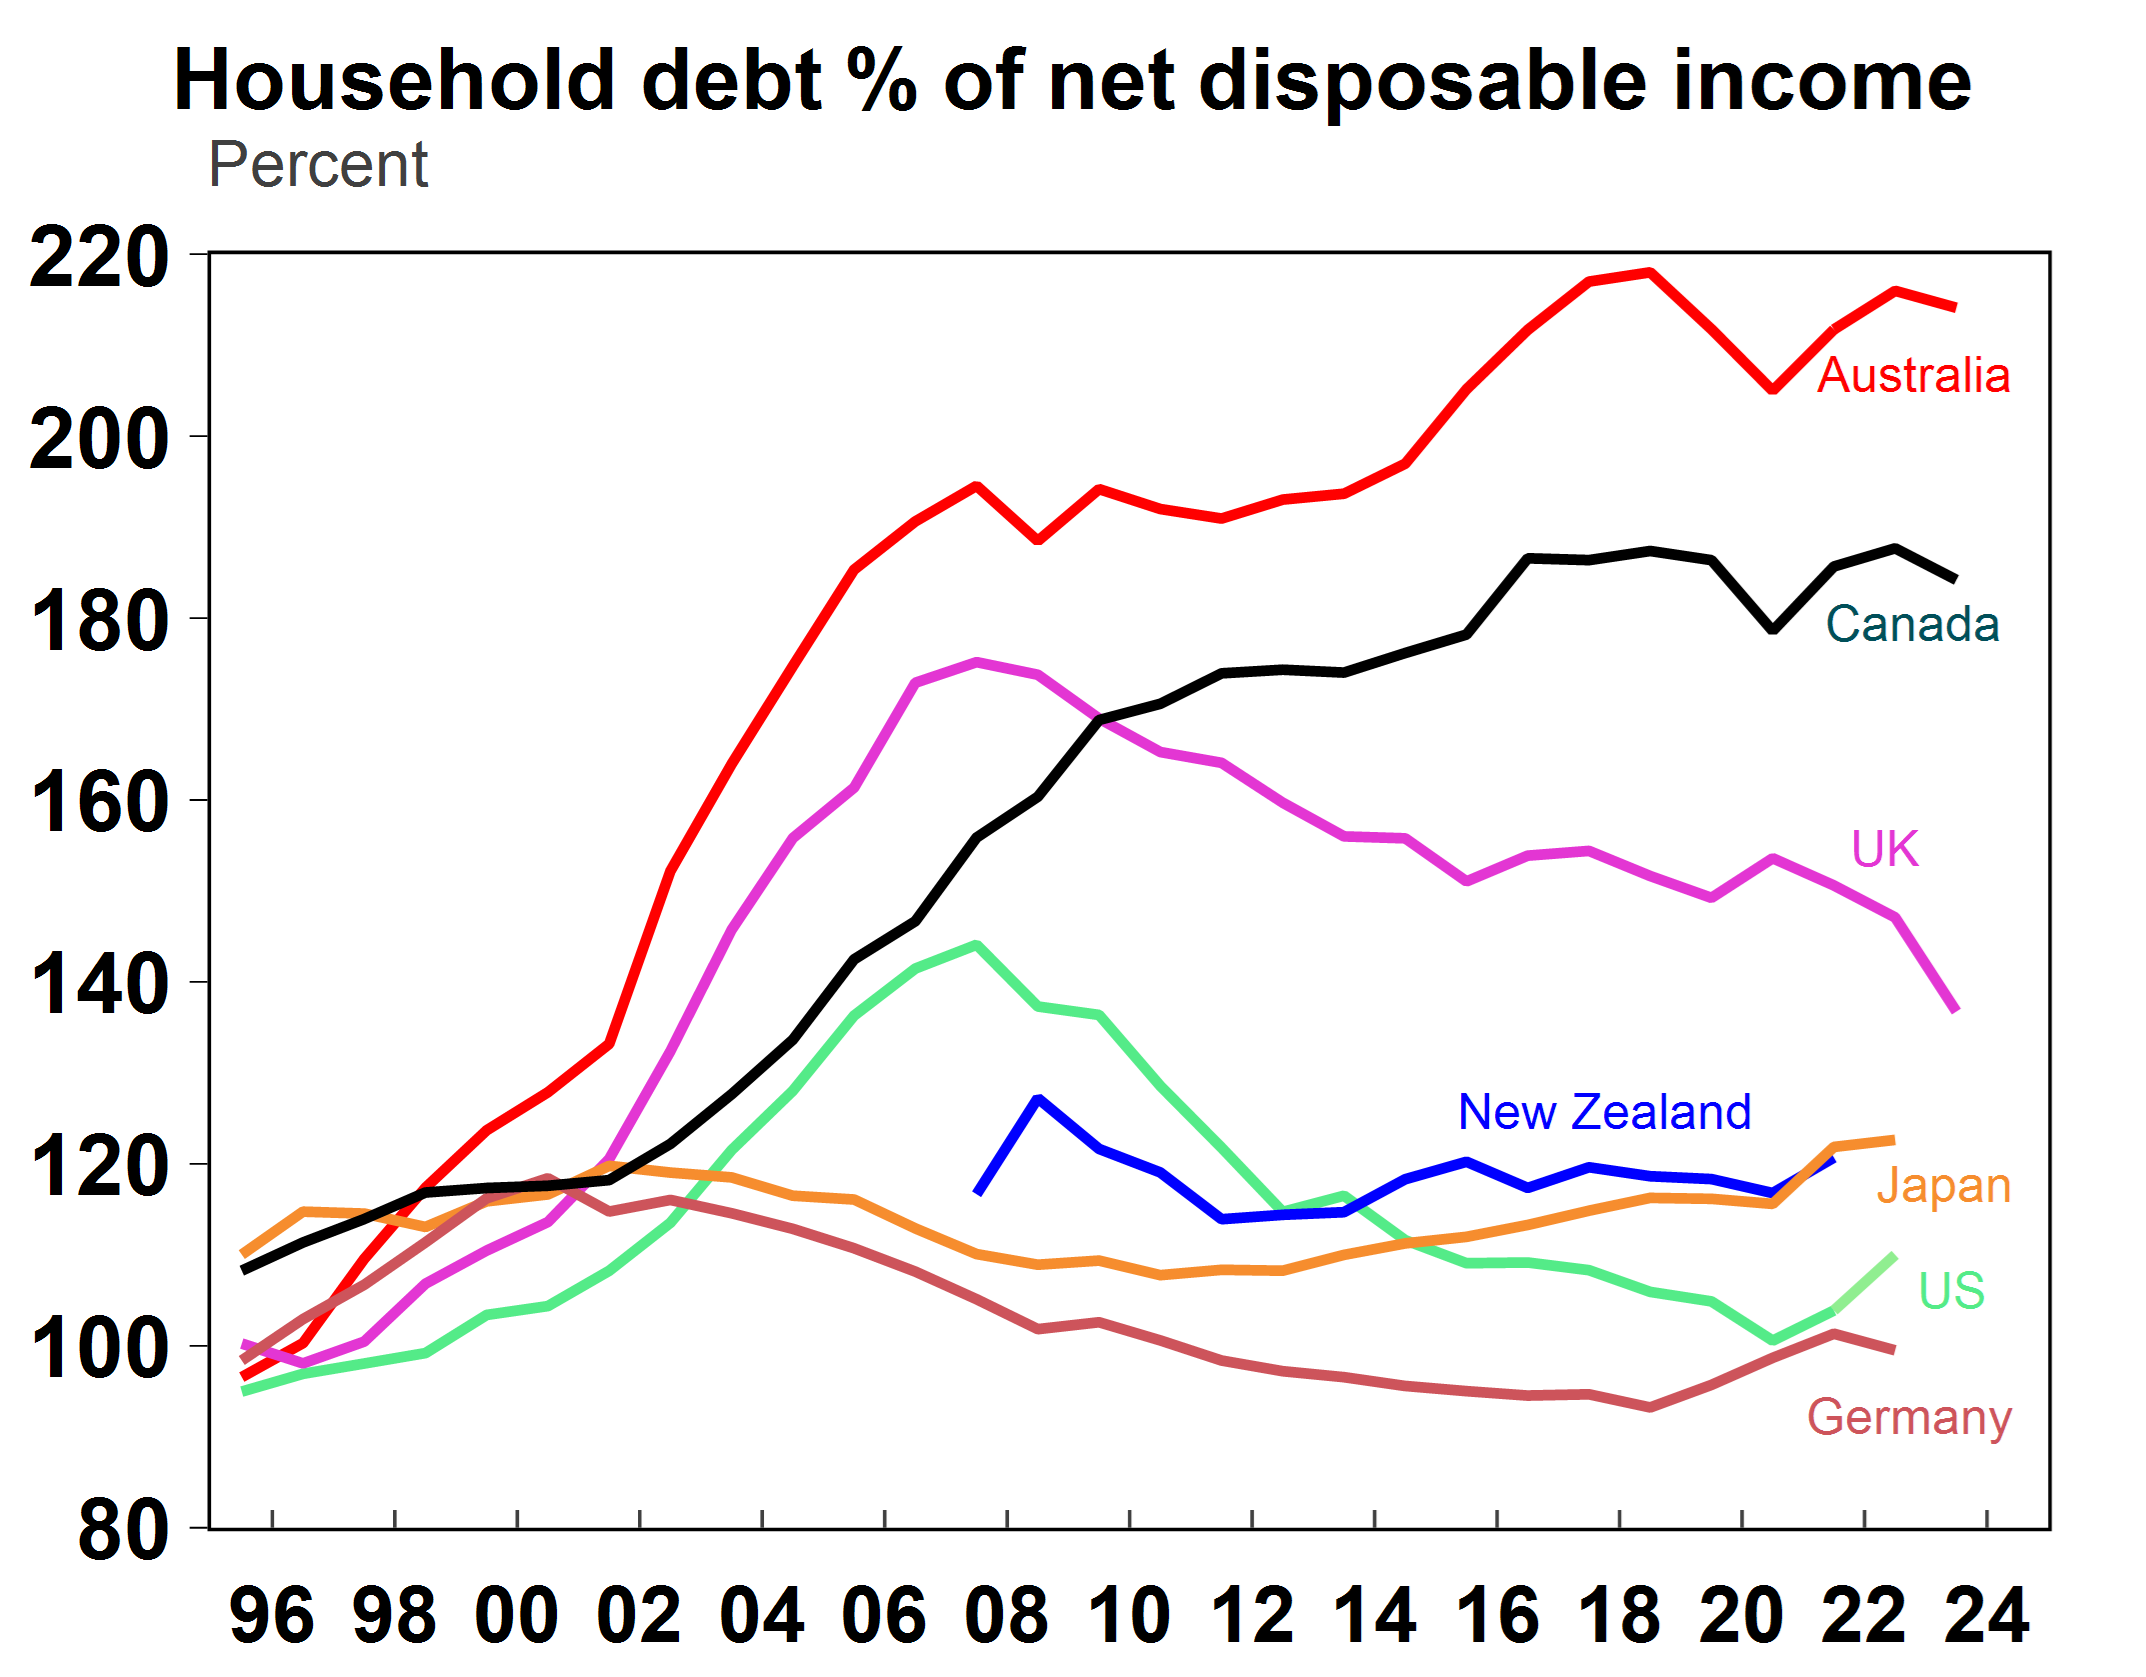
Source: Macrobond, OECD, AMP
Australian’s high relative debt levels have been a persistent concern since the early 2000s, when household debt-to-income really took off. High household debt holdings increase the vulnerability of households to rising interest rates (which increases debt repayments) and to a downside economic shock (like slowing economic activity which increases the unemployment rate) as households may have difficulty with debt repayments. Household debt data captures past and present affordability dynamics, because it looks at the stock of debt. Home price-to-income ratios are a good guide to present dynamics in the housing market, as a guide to accessibility into the market. Many global organisations construct home-price-to-income ratios but often they are annual, indexed (not outright ratios) or have a short time history. Usually, household income is also used (rather than individual income) because homes are usually purchased with another person. We constructed global home-price-income ratios using individual wages (rather than household wages) because a longer history was available across all countries and also to allow for fairer comparisons because household size varies around the world. Australia’s home-price-to-income ratio is at 9.6 on our measure, nearly doubling from 4.9 in 2000, when the home-price-to-income ratio started rising sharply. This period occurred alongside a fall in interest rates from the highs of the early 1990s, the start of Australia’s housing undersupply problem (driven by a big rise in Australia’s population from increased overseas migration which was not met by a commensurate lift in housing construction) and some changes in the Australian tax system to incentivise investment. Australia’s high home price-to-income ratio sits close to New Zealand and Canada and has outpaced the US since the GFC.
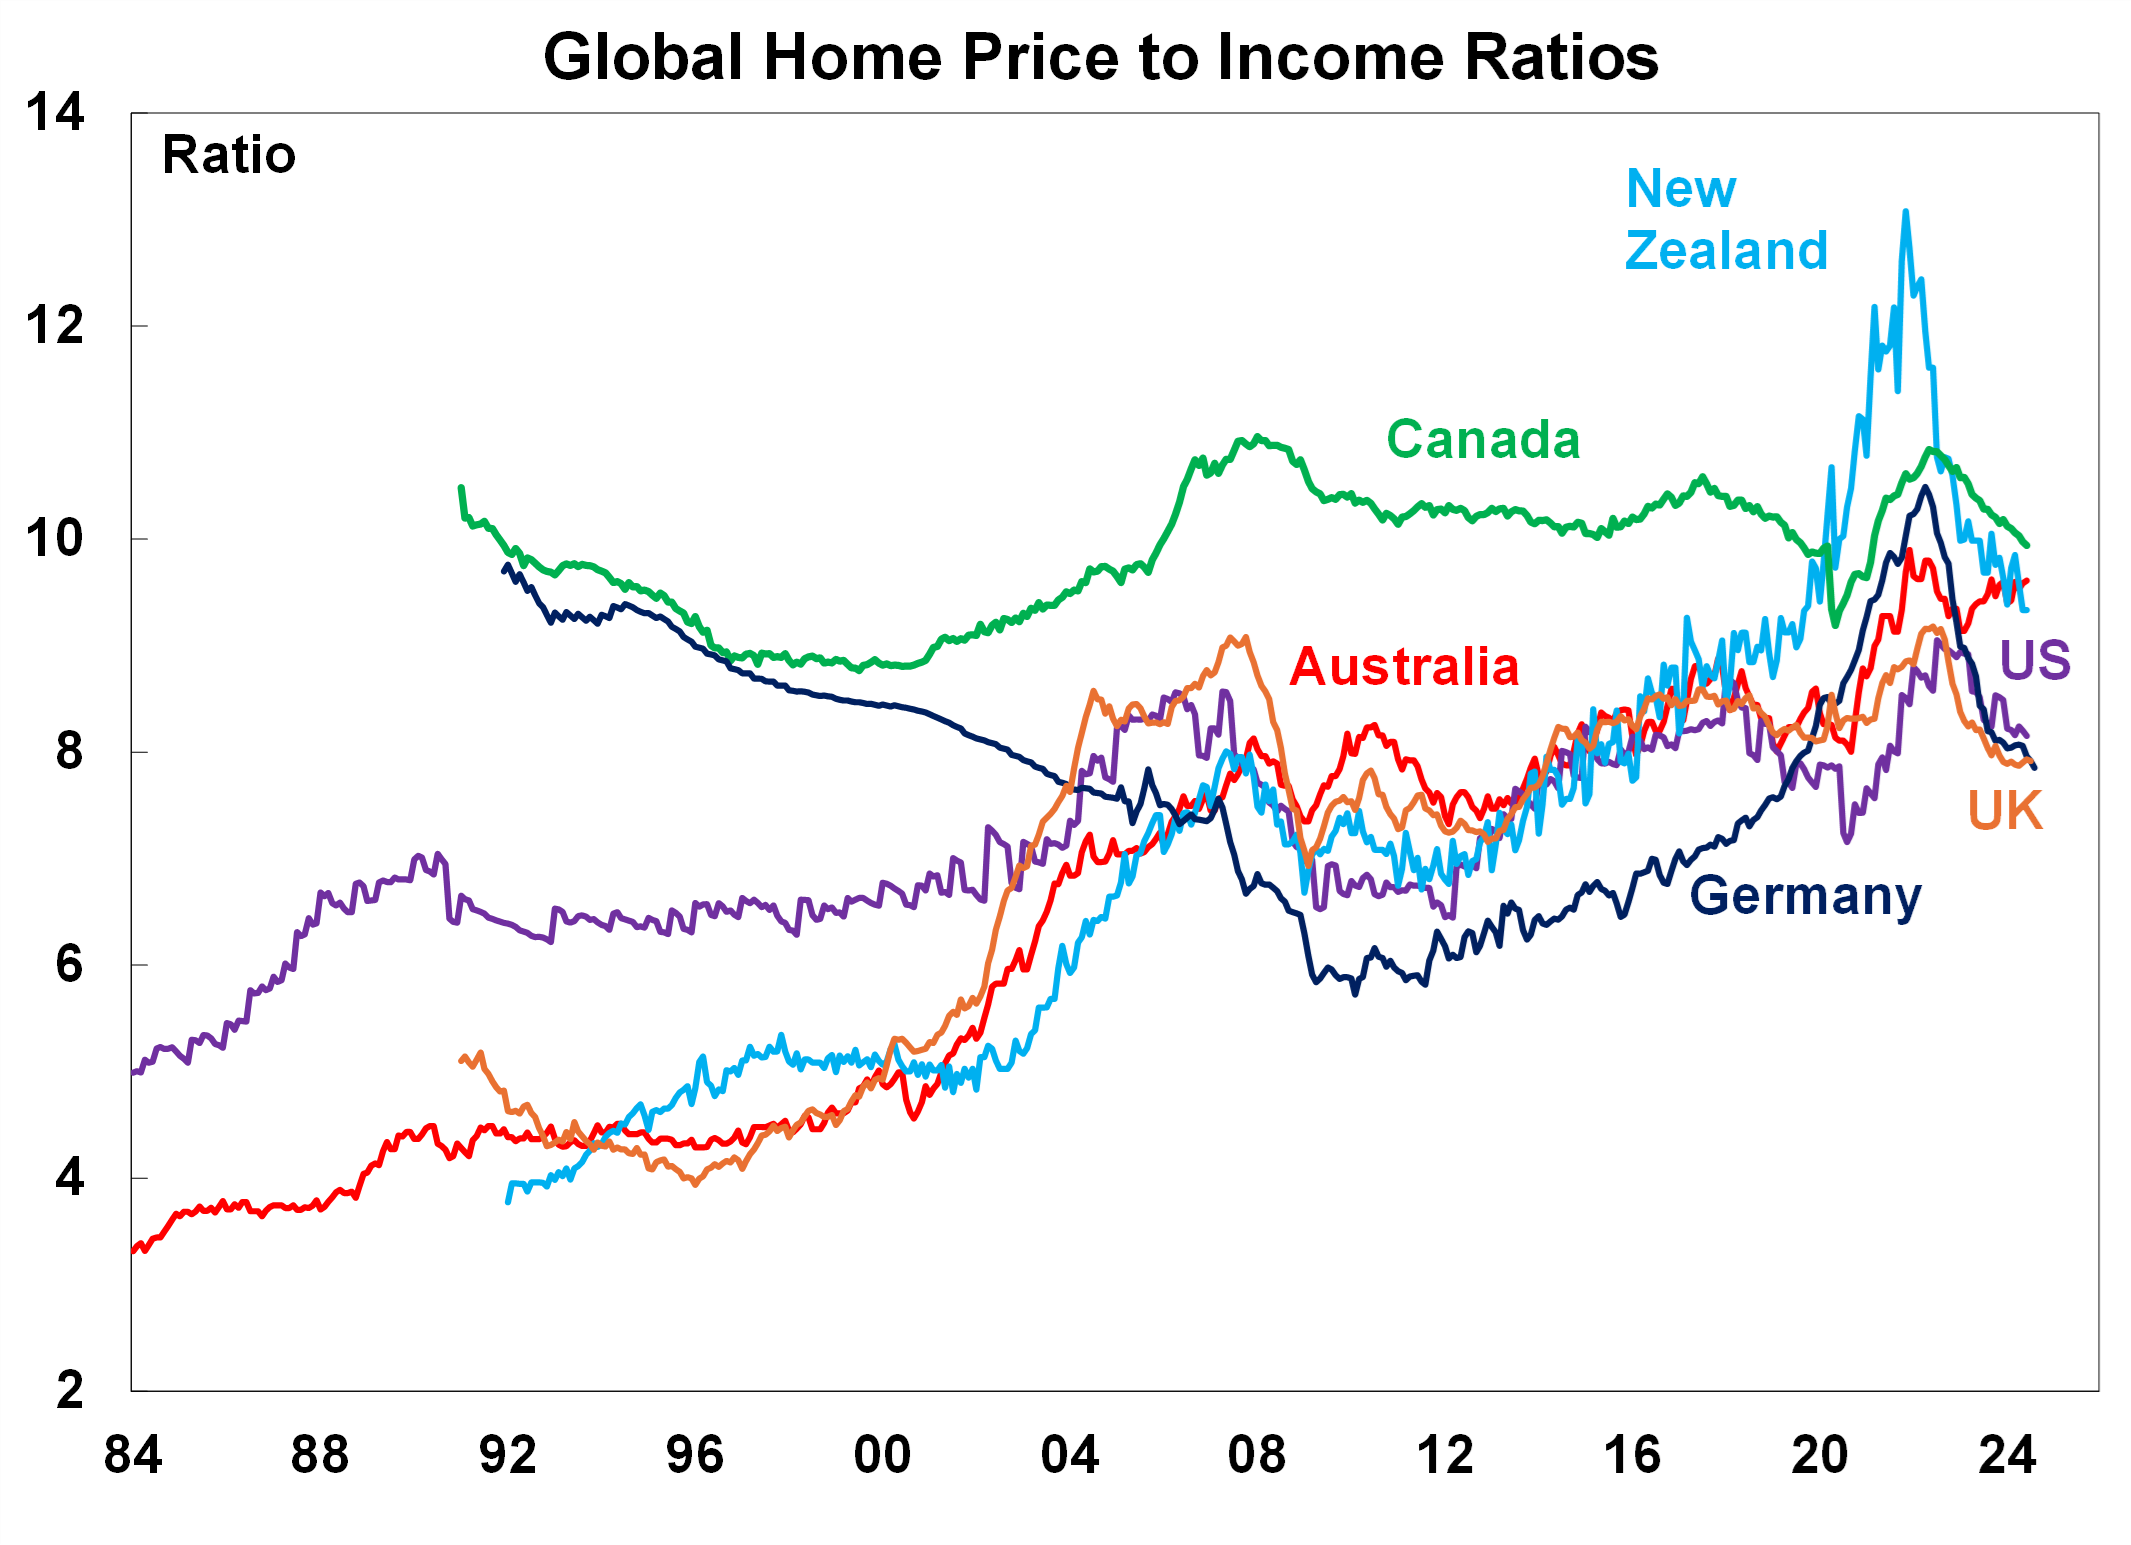
Source: ABS, AMP
We can also look at home-price-to-income ratios by capital cities (see the chart below). On a capital city basis, Sydney ranks among some of the most expensive cities in the world (with a price-to-income ratio of 12.8) and Brisbane and Melbourne are not far behind.
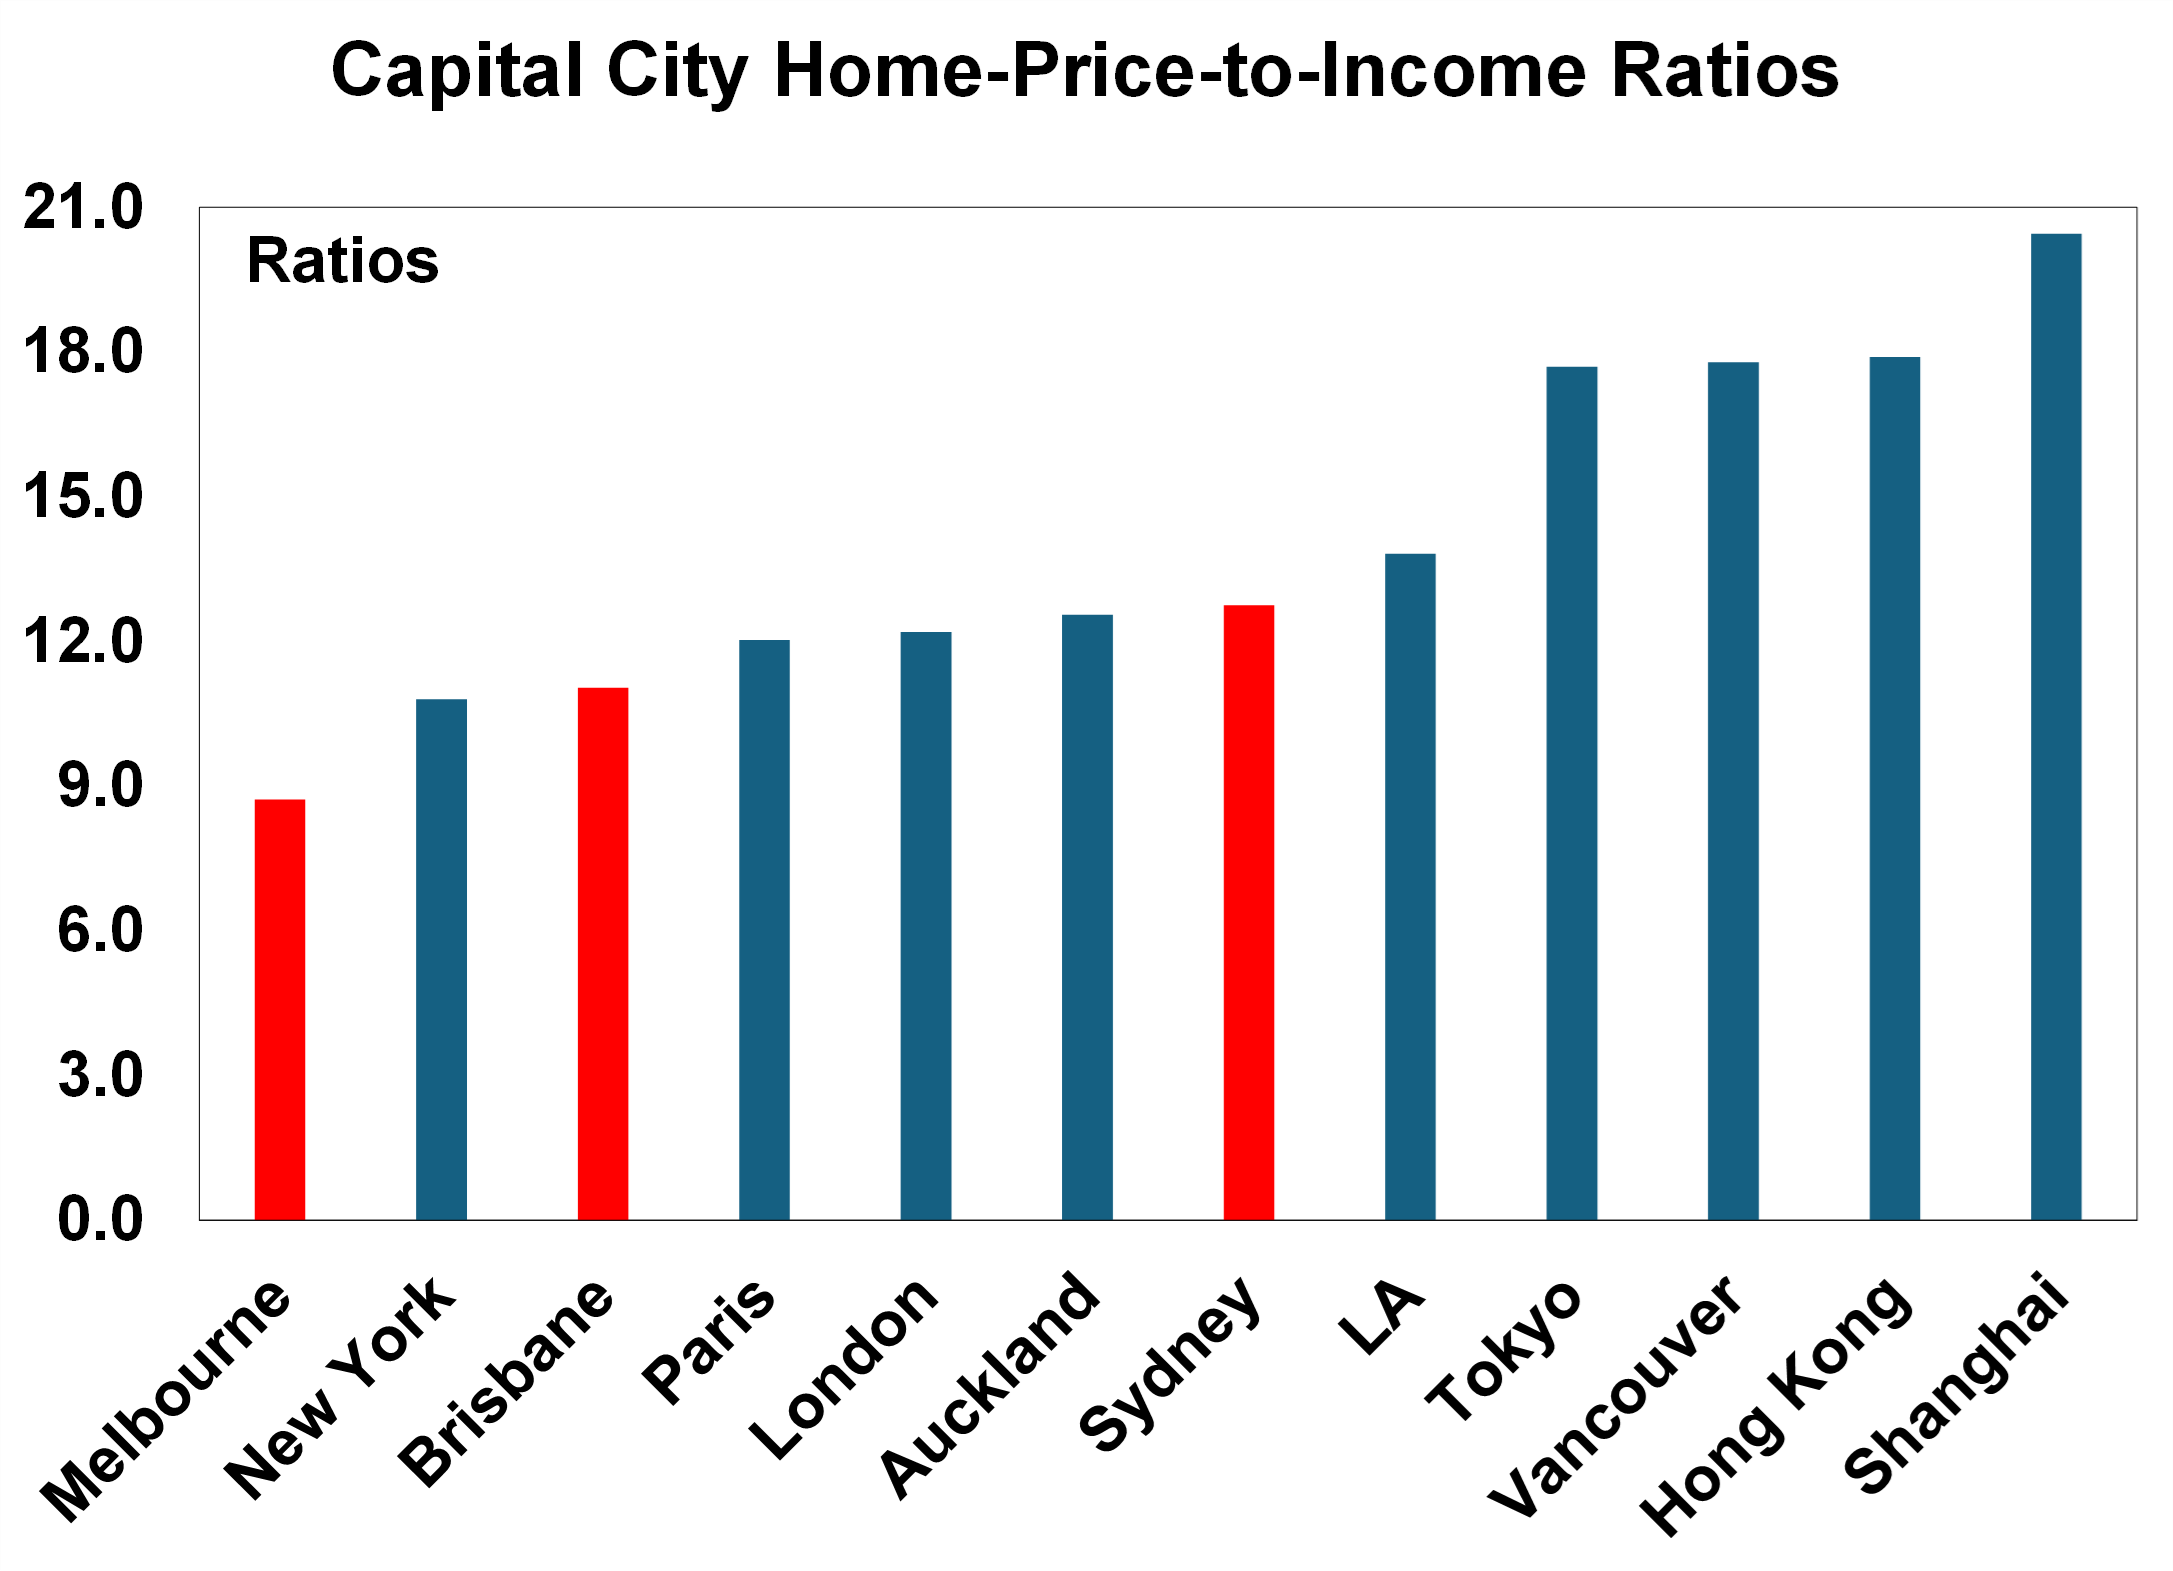
Source: Various online websites, AMP
Simply looking at capital city home-price-to-index ratios would indicate that Australia’s housing affordability problem reflects the fact that the capital cities have become major global hubs. Whilst this is true, the problem for Australia is that 48% of the population reside in just 3 capital cities (of Sydney, Melbourne and Brisbane) which arguably makes the affordability problem arguably worse in Australia, because there are less affordable markets to pick from. This is confirmed by regional home price data. CoreLogic and ANU data show that the regional home price-to-household-income-ratio was at 7.6 in mid-2024, not far from the combined capital average ratio of 7.9 which indicates that both capital city and regional areas have affordability challenges.
Social issues
There is a high risk that affordability issues with housing will lead to social unrest. Rising homelessness is an increasing problem in many parts of the western world. The OECD countries with the largest homeless population are the UK, France, Czechia and Germany which are not necessarily the most unaffordable housing markets around the world but do tend to be expensive. The US, New Zealand, Australia and Canada are in the top 10 OECD countries with the highest homeless populations per 100k persons (see the chart below). Of course, there are many other issues at play that contribute to homelessness, especially in regards to the labour force, but housing is a major contributing factor.
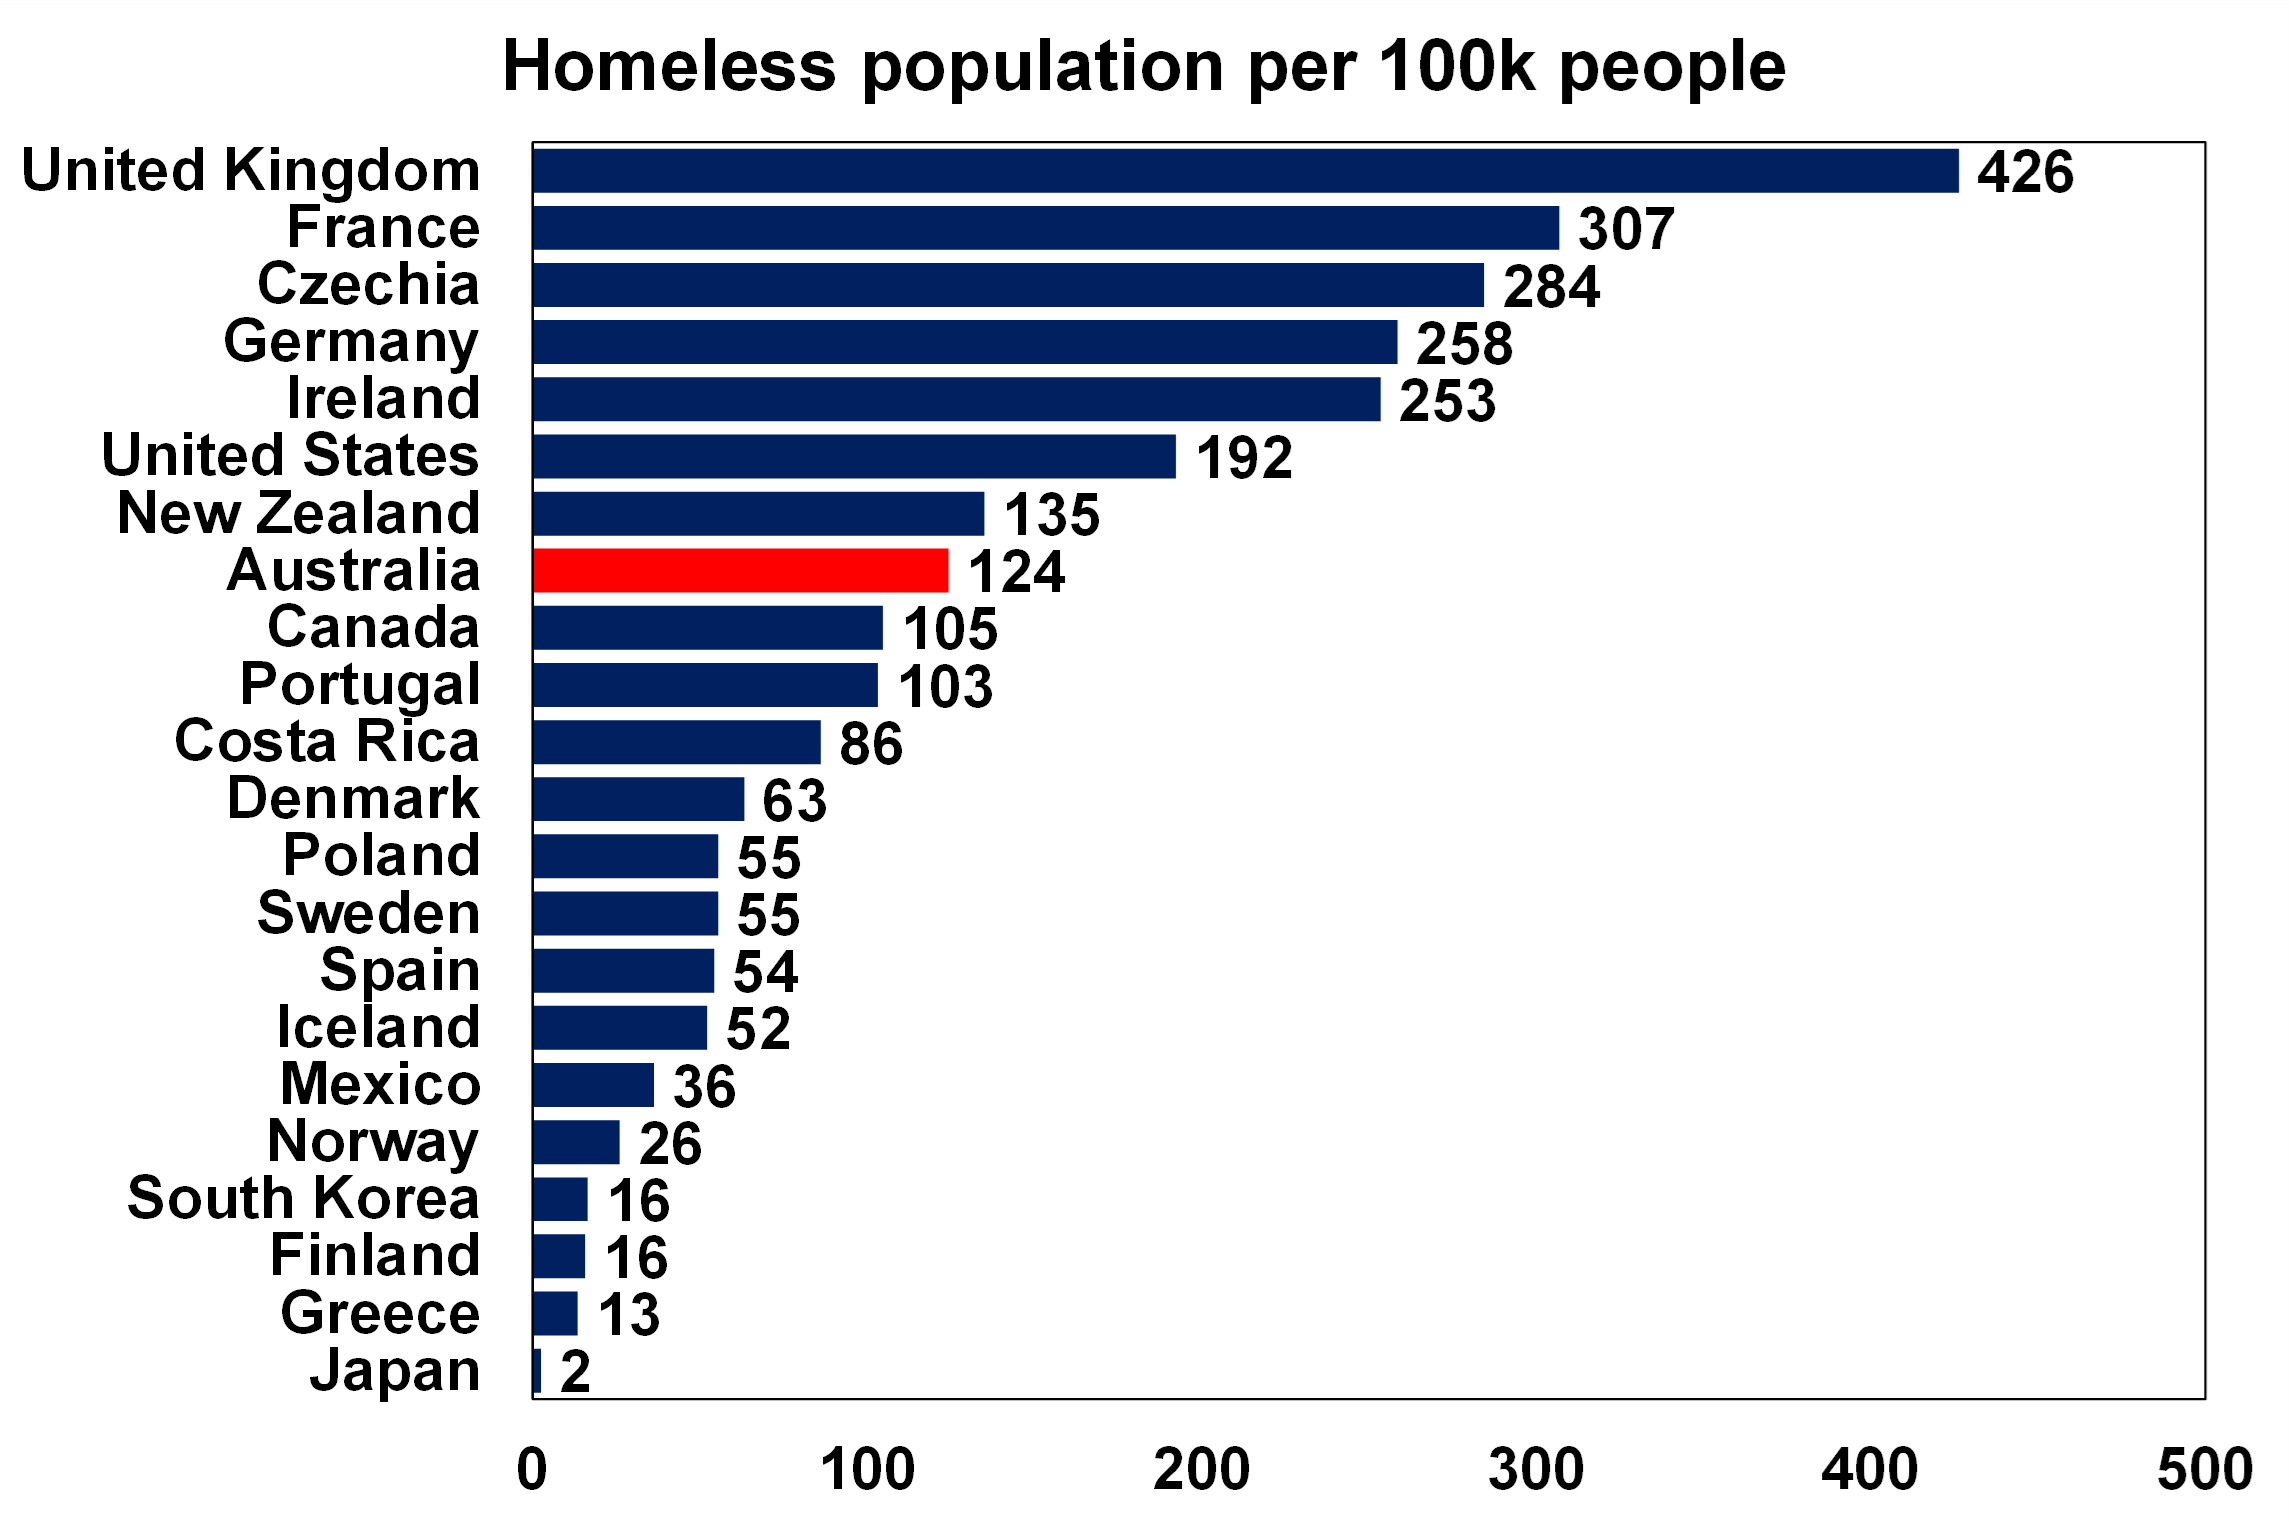
Source: ourworldindata, AMP
Generational angst around affordability is also an increasing problem which we have written about here and will be a debated issue in the 2025 Federal election.
Implications for investors
Whilst many of Australia’s peers face similar challenges around housing affordability, Australia’s situation has appeared to have gotten even worse after the pandemic because of a worsening gap between low housing supply and high demand for new housing. And this has occurred in a high interest rate environment, which would normally see lower home price growth.
We have previously written about the changes required to help address housing affordability here. While there are no quick fixes for affordability, there can be solutions to stop it from getting worse and to get home prices growing in line with income over the long-term, rather than home prices continually running above incomes. The priority needs to be a big lift in housing construction (running at least 240K new homes per year), aligning net overseas migration to these levels (which means making more cutbacks to immigration) and a tax review with potential changes to housing specific taxes like replacing stamp duty with a land tax, limiting negative gearing and reducing the capital gains tax discount.

Weekly market update 25-10-2024
25 October 2024 | Blog Rising bond yields threaten shares; US tech share nearly at 2000 levels; is Australia really that bad on inflation?; Trump and share markets; Australian underlying inflation to fall; and more. Read more
Oliver's insights - ineffective investors
22 October 2024 | Blog In the confusing and often seemingly illogical world of investing, investors often make various mistakes that keep them from reaching their financial goals. This note takes a look at the nine most common mistakes. Read more
Weekly market update 18-10-2024
18 October 2024 | Blog Down down for global inflation and rates; soft Chinese data but better than feared; strong Australian jobs and the RBA; US earnings results; time for another baby bonus?; and more. Read moreWhat you need to know
While every care has been taken in the preparation of this article, neither National Mutual Funds Management Ltd (ABN 32 006 787 720, AFSL 234652) (NMFM), AMP Limited ABN 49 079 354 519 nor any other member of the AMP Group (AMP) makes any representations or warranties as to the accuracy or completeness of any statement in it including, without limitation, any forecasts. Past performance is not a reliable indicator of future performance. This document has been prepared for the purpose of providing general information, without taking account of any particular investor’s objectives, financial situation or needs. An investor should, before making any investment decisions, consider the appropriateness of the information in this document, and seek professional advice, having regard to the investor’s objectives, financial situation and needs. This article is solely for the use of the party to whom it is provided and must not be provided to any other person or entity without the express written consent AMP. This article is not intended for distribution or use in any jurisdiction where it would be contrary to applicable laws, regulations or directives and does not constitute a recommendation, offer, solicitation or invitation to invest.
The information on this page was current on the date the page was published. For up-to-date information, we refer you to the relevant product disclosure statement, target market determination and product updates available at amp.com.au.