Key points
- Despite looking at virtually the same sets of figures, economists often have different opinions about the economic outlook.
- This is because of differences in interpreting data and giving weight to different indicators at various points in the cycle. The pandemic has also resulted in long-lasting volatility in data due to seasonal adjustment issues and structural changes in parts of the economy, like the labour market.
- The key differences between our and the RBA economic forecasts are: we are more optimistic on the inflation trajectory, we are more concerned about the outlook for the consumer and we see weaker Australian economic growth.
Introduction
We were surprised that the Reserve Bank of Australia was quite hawkish after the August Board meeting (i.e. they still considered the need for another rate hike and said they would raise rates again if they had to) while we see little need for further rate hikes and remain concerned about how the economy will keep sustaining high interest rates. How is it possible that looking at the same sets of data figures can yield a different outlook on the economy? In this edition of Econosights we look at the key areas of the economy that we have a different outlook on, compared to the RBA.
The “dark art” of forecasting
First, some thoughts on forecasting. At the same time that I started writing this note, the RBA Deputy Governor Andrew Hauser gave a speech titled “Beware False Prophets” about the risks of overconfidence in forecasting. Humility is very much needed in forecasting, as you simply cannot get everything right. Everyone likes having a go at predicting the future and when economists get it wrong, they often get told how wrong they were (mostly because their forecasts are published!). Some people tell me that economist forecasts have a track record that’s as good as a weather person. Or that when you have two economists in a room you will get at least three opinions. The process of forecasting is inherently biased because analysts give different weights and perspectives to the inputs used in forecasting. Data points can be lagging, coincident or leading indicators of the future but may be more or less useful at different points in the cycle and also change depending on the nature of each economic cycle. The pandemic has arguably made data interpretation more difficult because historical rules have proven to not always work and seasonal adjustment methods have been compromised. Some analysts also like to massage or manipulate the data to tell a story that fits their narrative.
We are more optimistic on the trajectory for inflation
Inflation surprised everyone to the upside in 2022 and 2023. While inflation has slowed in Australia from its high of 7.8% in December 2022 to 3.8% in June 2024, it has been slower to come down than both we and the RBA were expecting. The RBA upgraded its inflation forecasts in the August Statement on Monetary Policy. It expects headline consumer price inflation to be at 3% by December 2024 (because of the Federal and State governments cost-of-living initiatives) but to spike back up to 3.7% a year later as these measures drop out, before returning to 2.6% year on year by December 2026 (the mid-point of the target). Trimmed mean inflation is expected to be at 3.5% by December this year and be just under 3% in December 2025, reaching the mid-point of the target by late 2026. This forecast sees inflation back at the RBA’s midpoint around 6 months later than the last estimate. The RBA’s higher inflation assumption is based on estimates that demand will run above supply for longer than previously expected (i.e. there is excess demand) and drive higher inflation which was also reflected in the upside revisions to economic growth.
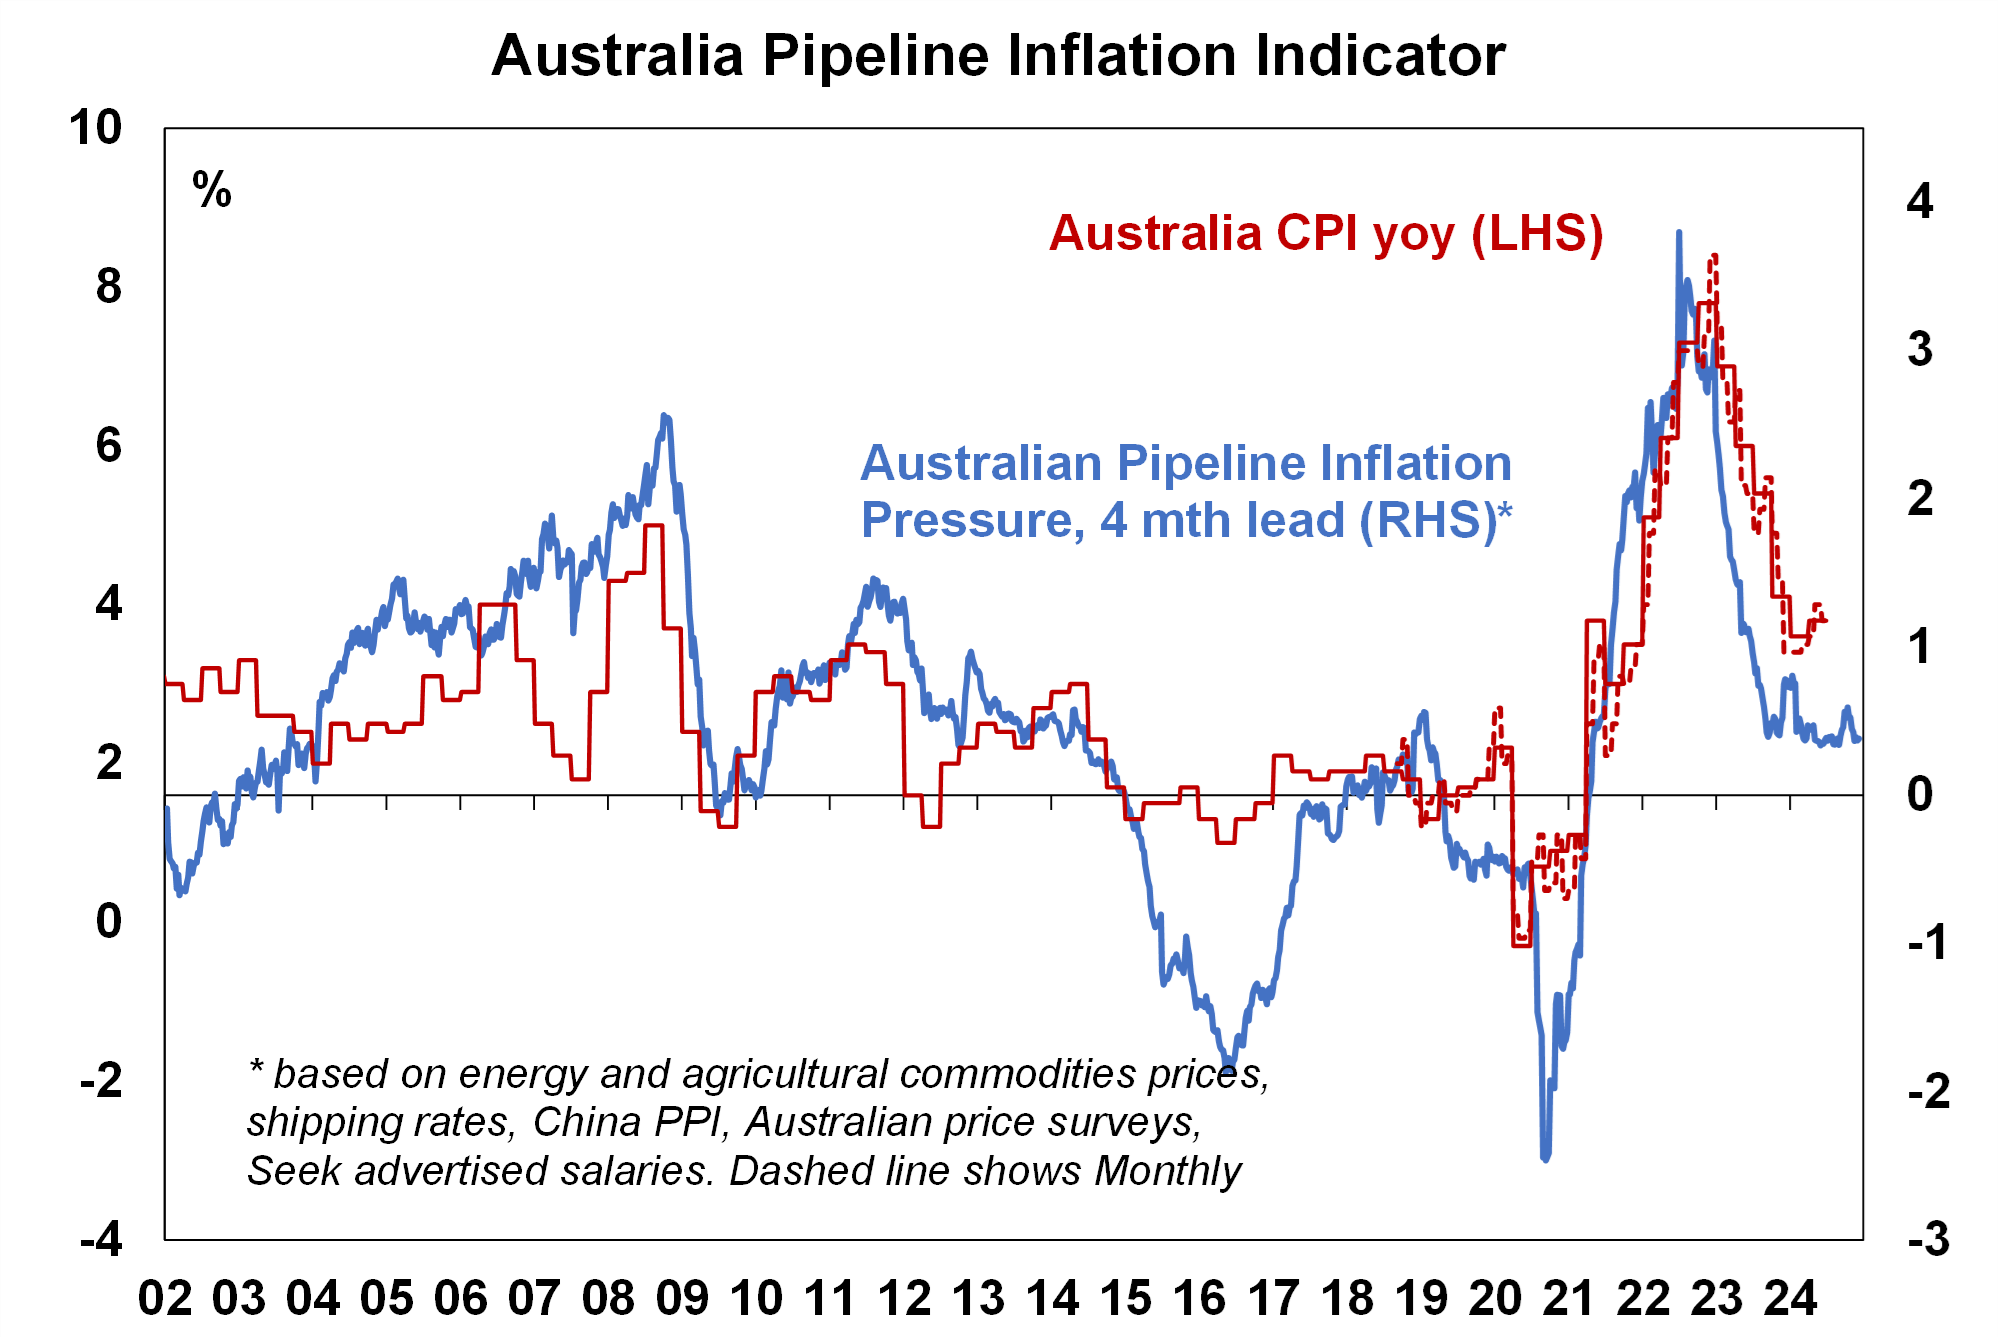
We are more optimistic about the near-term trajectory of inflation. We expect underlying inflation to be at the top end of the target band by mid 25 and within the 2-3% target midpoint by early to mid-26, around 6 months ahead of the RBA. The inflation profile across our major global peers indicates that further goods disinflation will continue and slow services inflation. Wages growth in Australia is lower compared to peers (currently at 4.1% year on year versus 4.7% in the US, 4.7% in the Eurozone, 5.4% in the UK and 4.3% in NZ). Population growth will slow to 2% over the year to June-24 from 2.5% in 2023 which will lower growth in housing demand and reduce pressure on rents and new dwelling construction costs. And we expect that administered price inflation will soften with lower headline inflation as a result of the government cost of living measures. Our leading indicator of inflation (see the chart below) is based on commodity prices, shipping rates that affect Australia, the Chinese producer price index, Australian price surveys and Seek advertised salaries. It shows some further downside to inflation is expected and has a been a good guide to the trends in this inflation cycle.

Source: Bloomberg, AMP
We are more concerned about the consumer
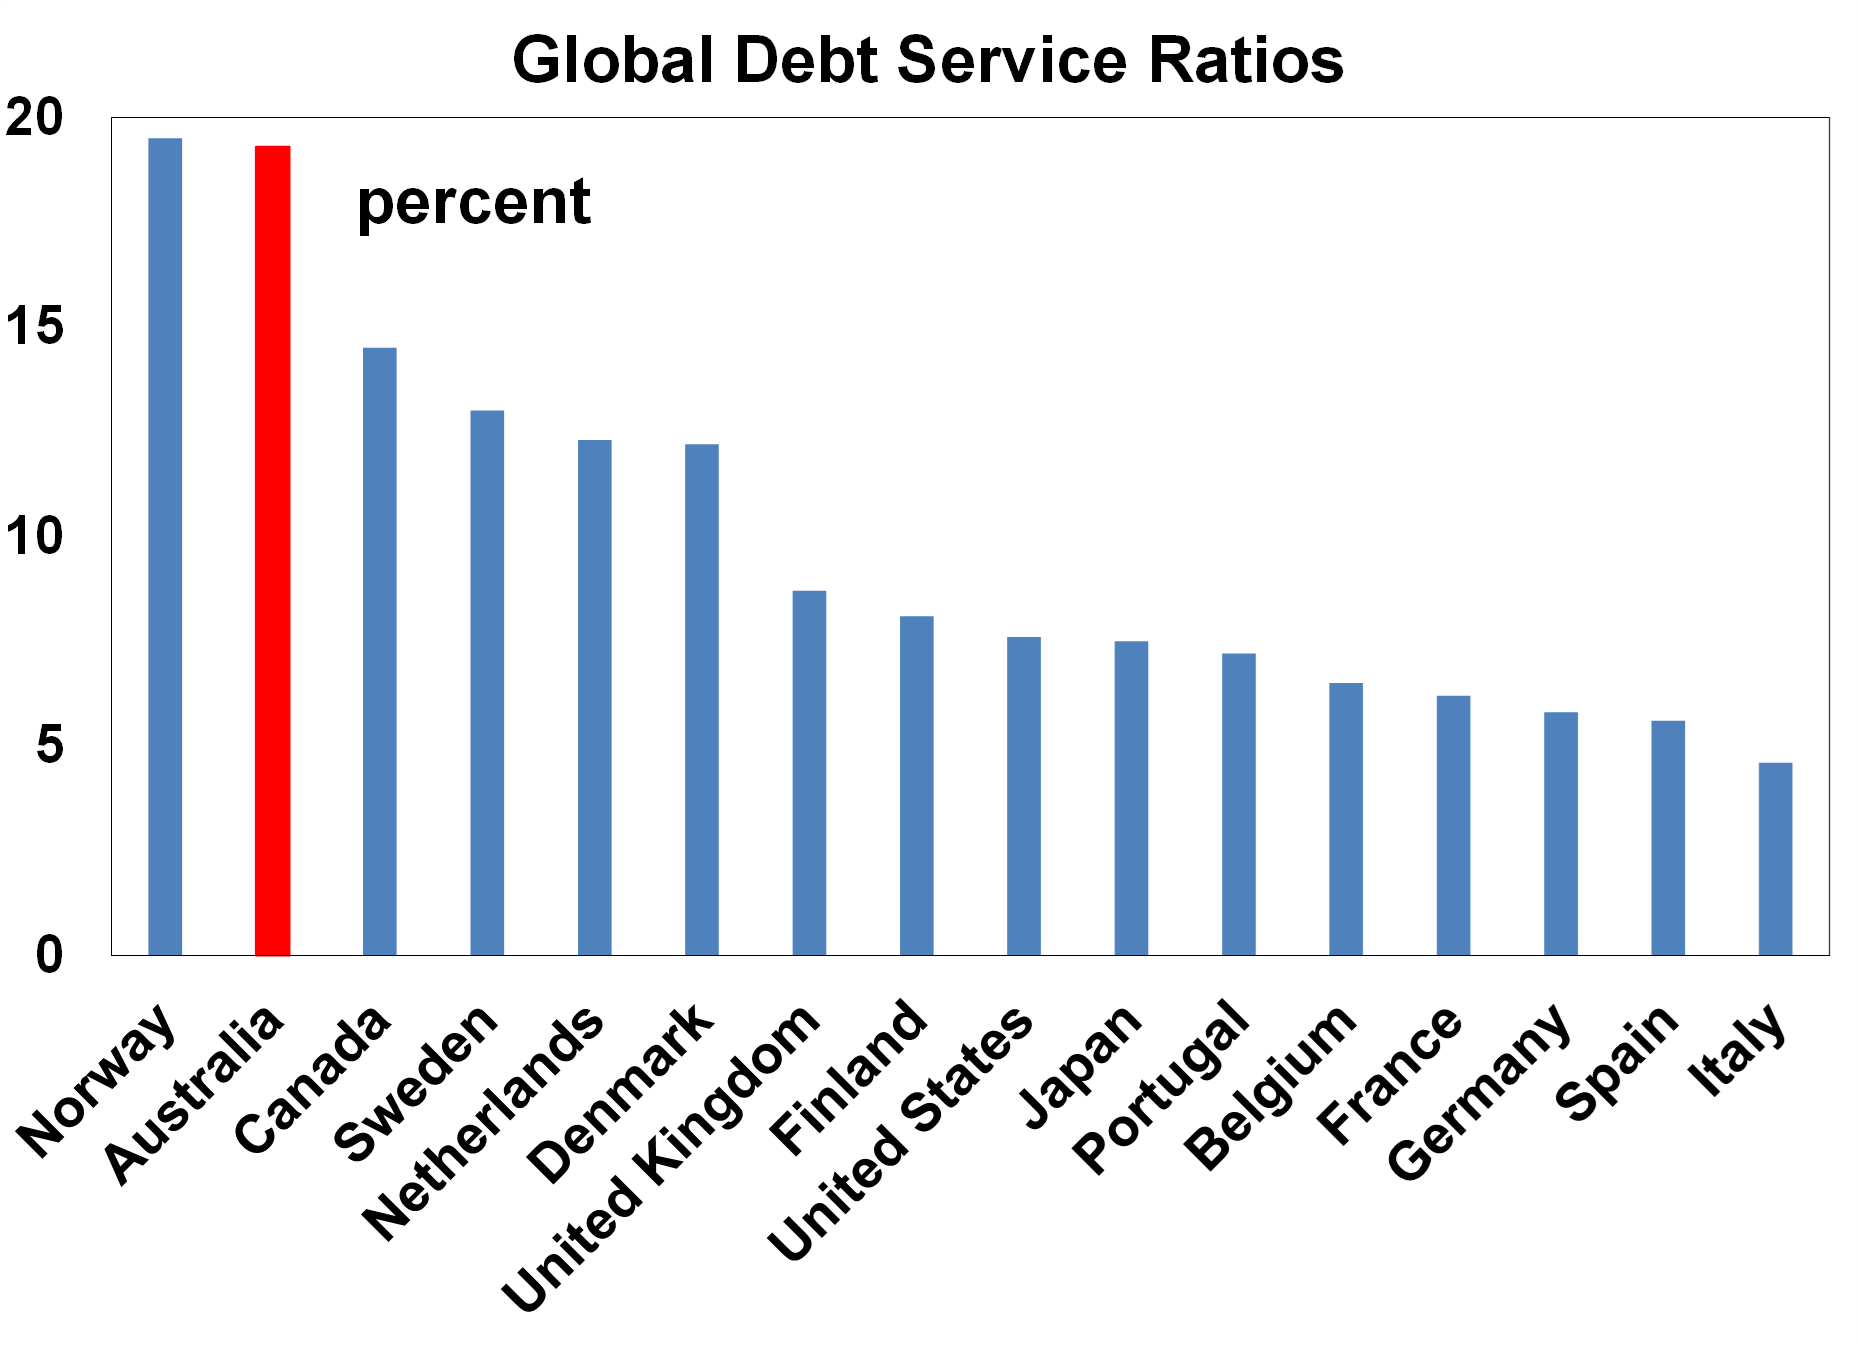
The vulnerability of the consumer to rising interest rates was always our biggest concern in a country like Australia where households are more vulnerable to rising interest rates, as households borrow in short-term fixed or variable interest rates. This is clear in Australia’s high debt service ratio (the % of income that goes to servicing debt) which is one of the highest around the world (see the next chart) which also justifies the RBA not hiking interest rates as much as our global peers.

Source: BIS, AMP
As it turned out, Australian consumer was more resilient than we expected, with a higher balance of accumulated savings to drawn upon, a stronger labour market supporting wages growth and some households relying on the “bank of mum/dad/grandparents” to pay for essentials or help in the property market. The RBA are forecasting better household consumption over the forecast period as household disposable income improves (from tax cuts, lower inflation and a decline in interest rates in the forecast horizon as the RBA use market pricing for interest rates in their forecasts) and a rise in household wealth supporting consumption. While we agree that the average consumer in Australia might be doing okay, it is the spread of outcomes across consumers that is more concerning. Older households (like Baby Boomers) are doing well because they have little to no debt and large increases in wealth. Consumer spending for those aged over 65+ has not been declining. But, younger household groups aged under 45 who have mortgages or rent have been cutting back spending and in our view have exhausted accumulated savings and do not have a large pool of wealth to drawn upon. And they are the group that change their spending more in relation to changes in their financial conditions.
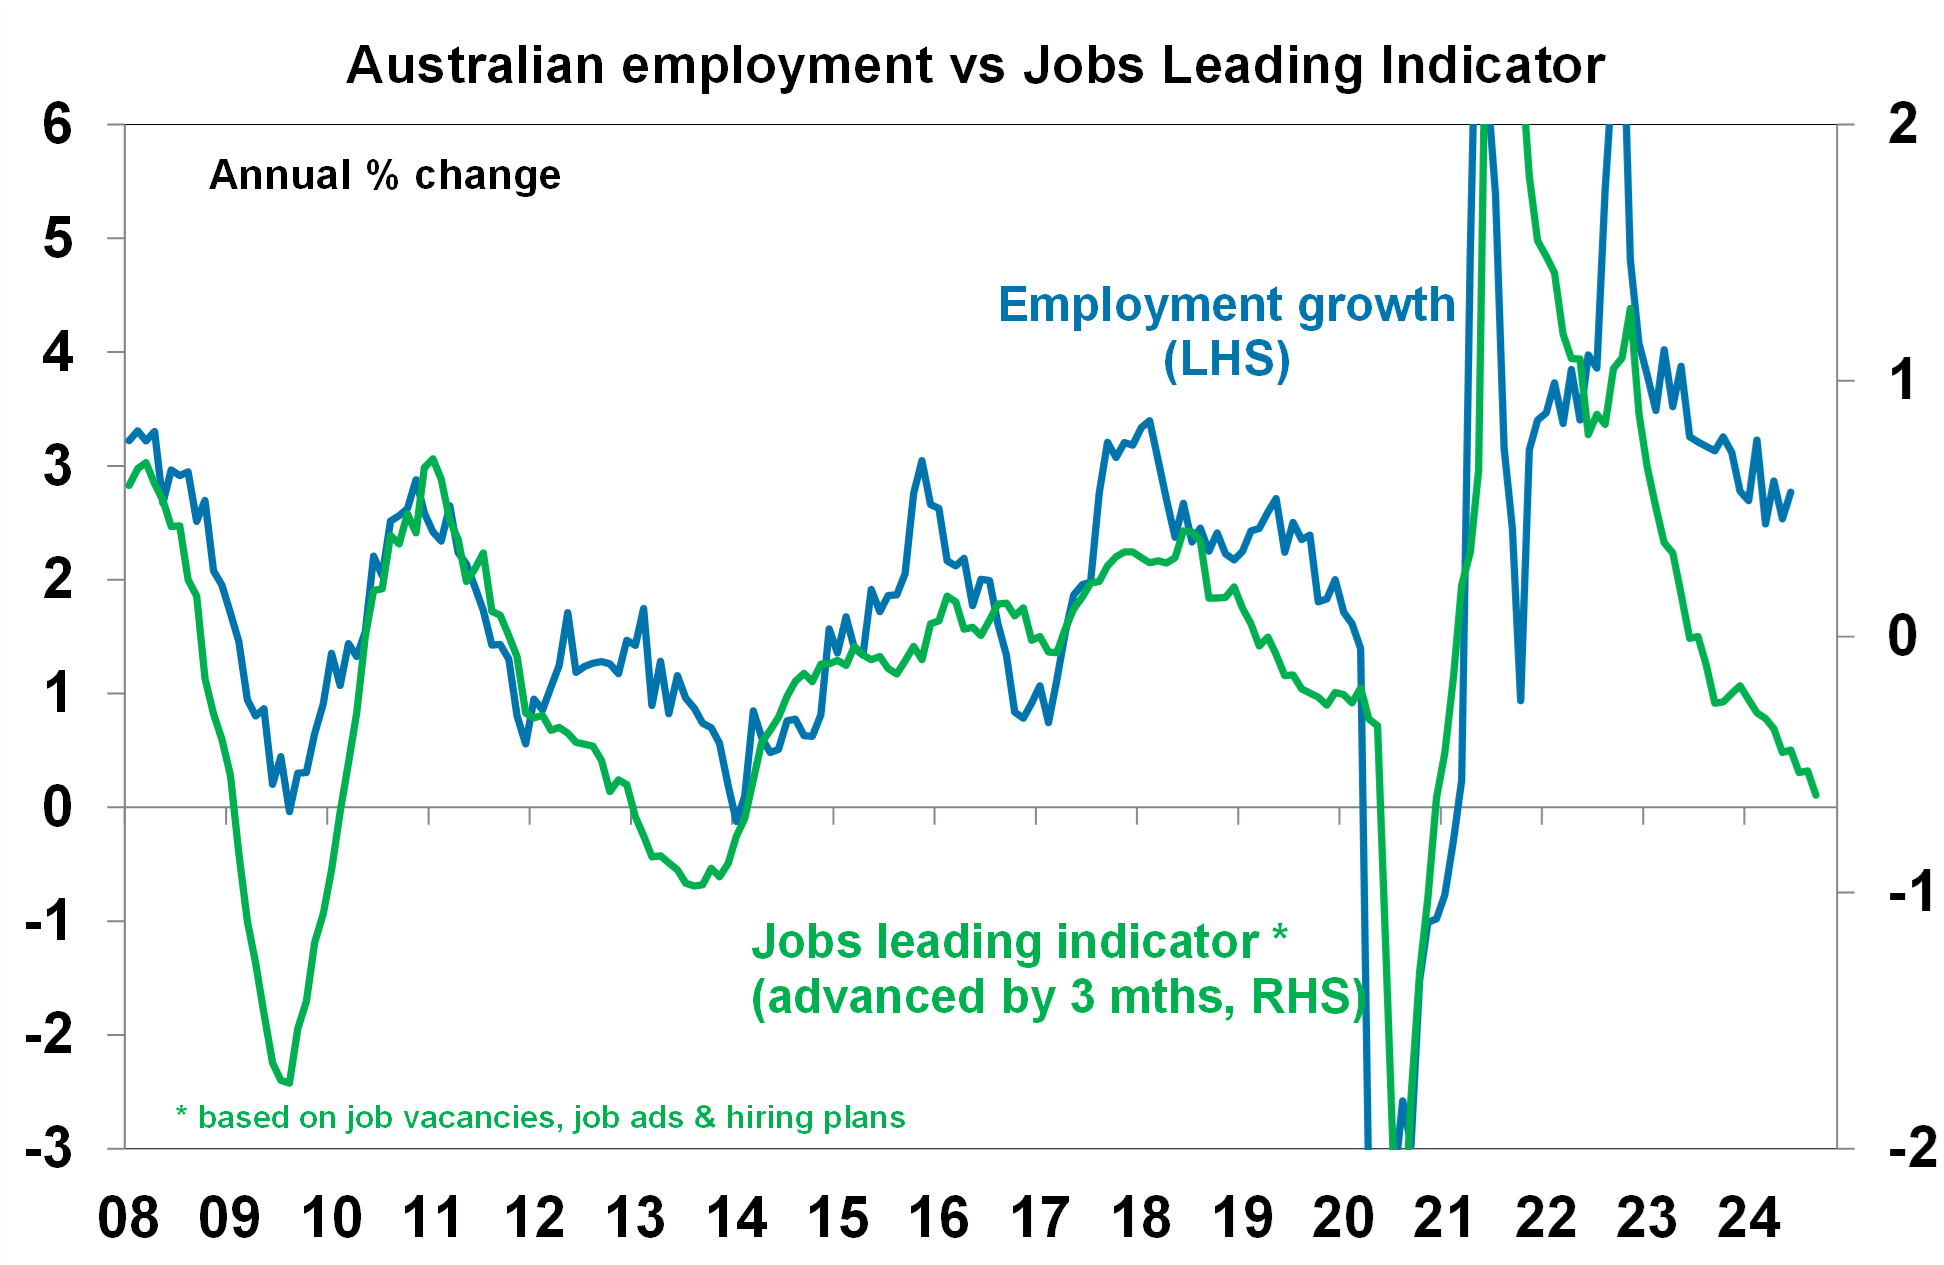
The RBA see the unemployment rate rising to a peak of 4.4% in mid-2025 and we see a slightly higher unemployment rate of 4.5% occurring earlier in late 2024 because the leading indicators like job vacancies, job advertisements and hiring intentions suggest that employment growth should be weaker (see the chart below). The risk is with a higher unemployment rate, given the weakness in leading indicators.

Source: Bloomberg, AMP
Hours worked have fallen more than employment which suggest there may be some element of labour hoarding going on, for fear of not being able to recruit staff later on. Our expectation for a faster rise in the unemployment rate will put pressure on consumer wages and salaries in the next 6-12 months.
We see poorer GDP growth in Australia… which means low per capita growth will persist and we are more concerned about the outlook for the US
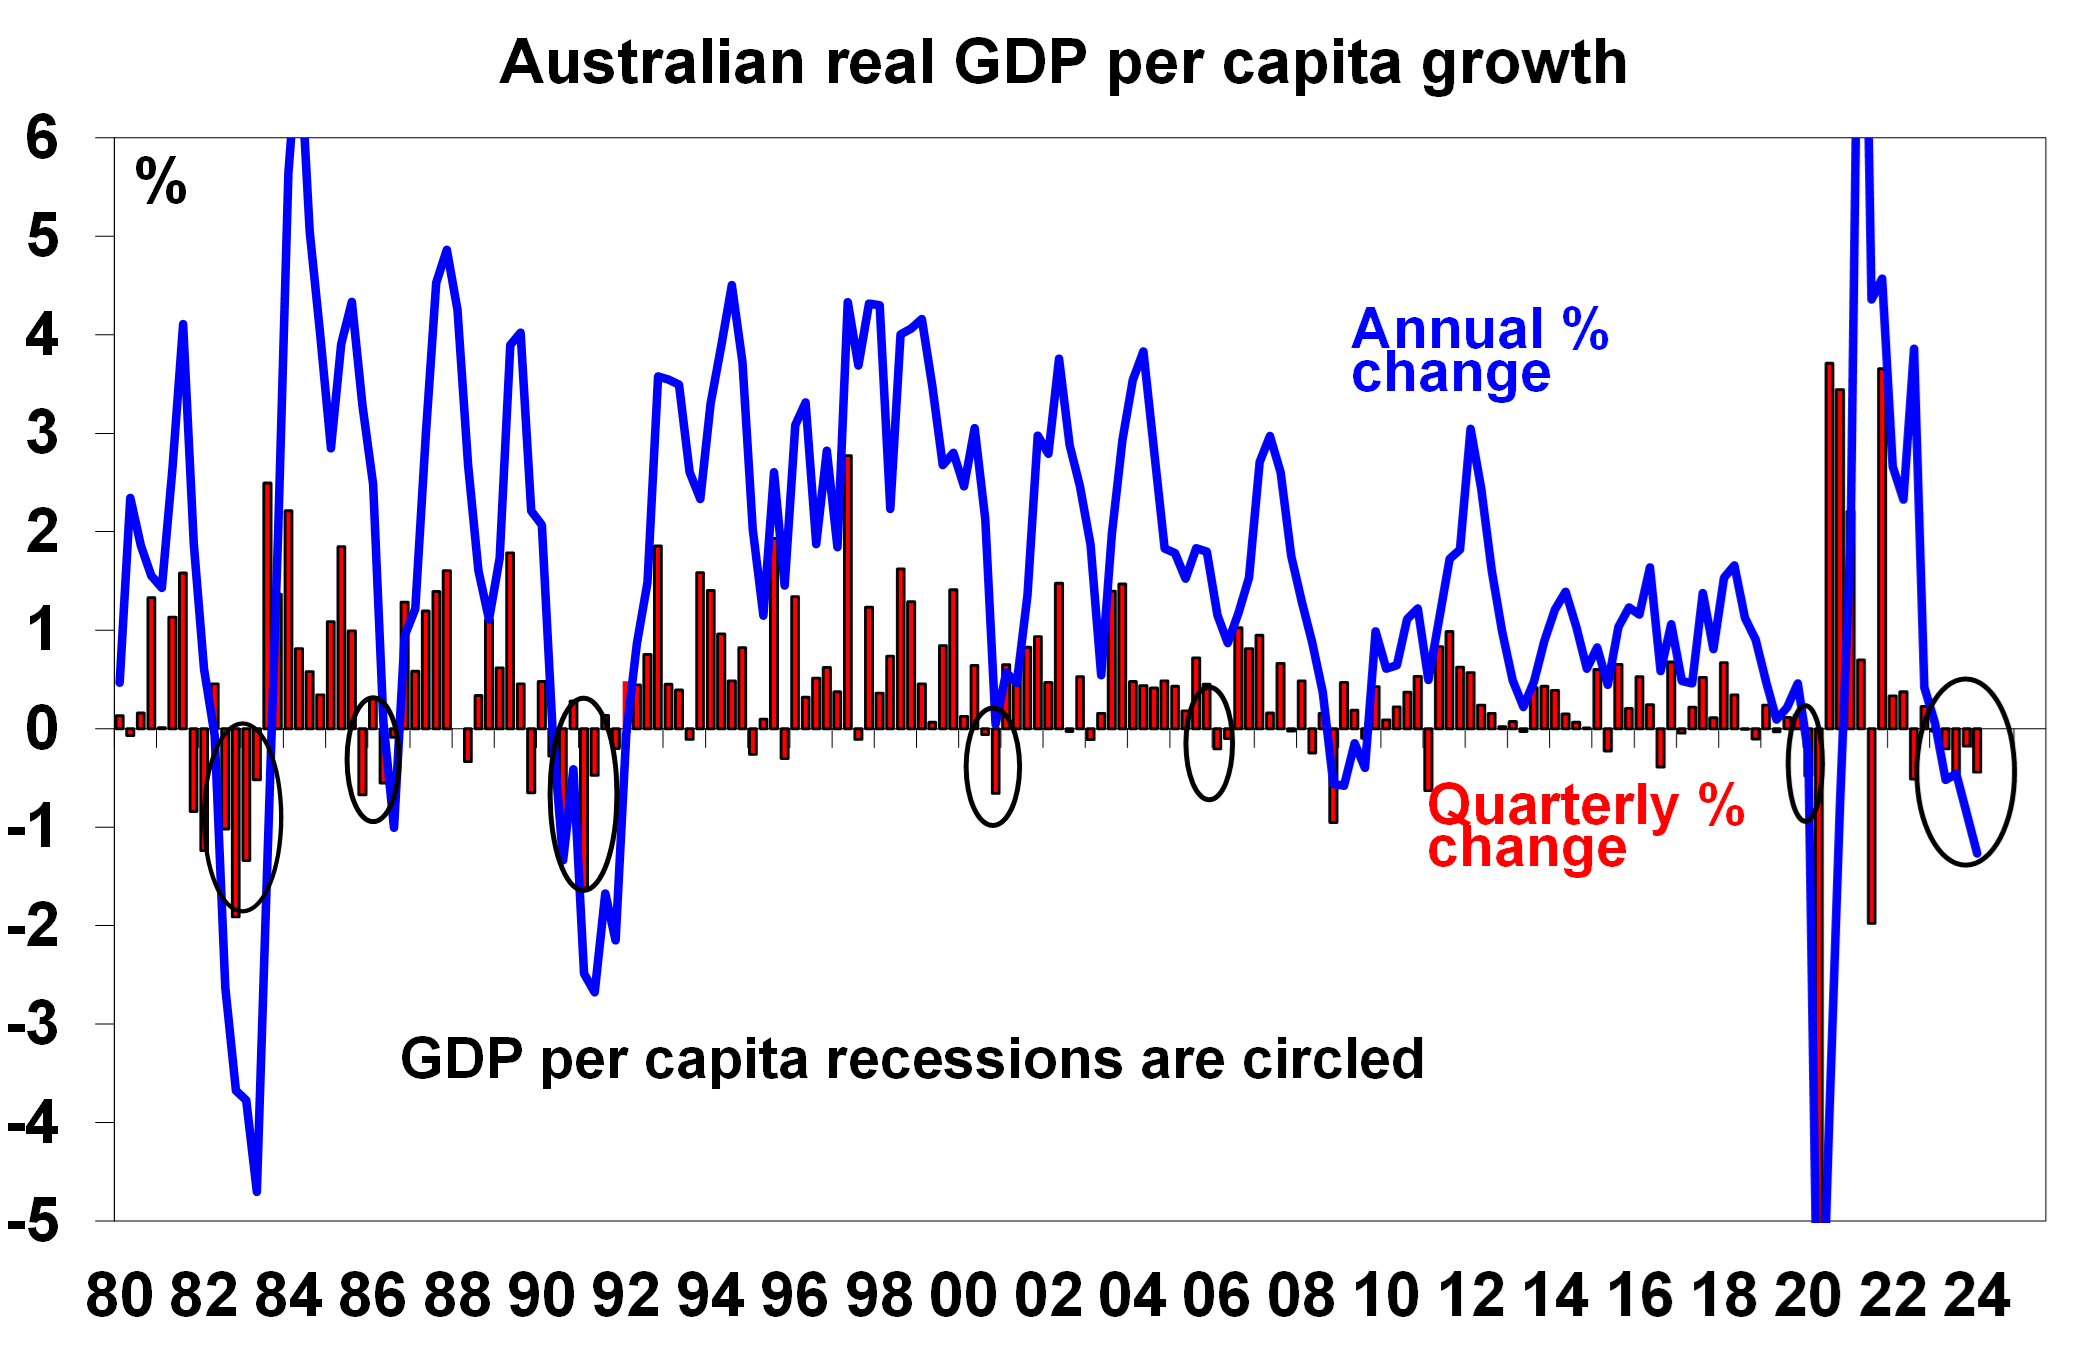
The RBA revised up growth forecasts for 2025 because of stronger government spending (based on spending programs announced in Federal and state budgets) and stronger household consumption which was partly offset by higher import growth forecasts (which is a drag on GDP) and softer dwelling investment growth. The RBA see GDP growth of 1.7% by Dec-24 and 2.6% by Jun-25 while we expect 1.3% and 1.7% respectively which means that per capita GDP growth will still remain negative in the near-term before improving slightly in 2025. Per capita GDP growth has already been negative for the last 5 quarters (see the chart below) which means that living standards are going backwards!

Source: ABS, AMP
We expect softer consumption growth and a lower contribution from public spending relative to the RBA’s forecasts. We are also concerned that a drop in population growth in 2024 and onwards will make a larger-than-expected dent to nominal growth in the economy offsetting the boost from tax cuts. We are also more negative on growth in the US economy (and see a 50% chance of a recession in the next 12 – 18 months) although the US is a small trade partner to Australia (~4% of exports go the US), the negative sentiment hit from weaker US GDP growth could impact Australia as would the flow on to our trading partners, particularly China.
Implications for investors
The risks around the pathway for the RBA cash rate is reflected in market pricing for interest rates which is based on the probability of cutting, holding or hiking the cash rate. Market pricing moves around a lot and is influenced by what happens in international markets (particularly the US). The market is pricing in around 1 interest rate cut in Australia by the end of this year and 3 rate cuts by the end of 2025, with the cash rate ending 2025 at 3.35%. In our view, market pricing is too dovish right now given the RBA’s comments around the upside risks to inflation. We think that economic data will continue to weaken over coming months and inflation will surprise to the downside which will allow the RBA to start cutting interest rates in early 2025. While the data may slow enough by late 2024 to justify a rate cut, given the RBA’s latest rhetoric, they do appear reluctant to cut interest rates, in case it provides a second-round tailwind to inflationary pressures.

Weekly marketing update 29-11-2024
29 November 2024 | Blog Shares have been mixed over the last week with lots of noise around Trump including tariff posts, political uncertainty in France and another elevated inflation reading in the US, but mostly solid US economic data and news of a cease fire between Israel and Hezbollah. Read more
Weekly market update 22-11-2024
22 November 2024 | Blog Against a backdrop of geopolitical risk and noise, high valuations for shares and an eroding equity risk premium, there is positive momentum underpinning sharemarkets for now including the “goldilocks” economic backdrop, the global bank central cutting cycle, positive earnings growth and expectations of US fiscal spending. Read more
Oliver's insights - Trump challenges and constraints
19 November 2024 | Blog Why investors should expect a somewhat rougher ride, but it may not be as bad as feared with Donald Trump's US election victory. Read moreWhat you need to know
While every care has been taken in the preparation of this article, neither National Mutual Funds Management Ltd (ABN 32 006 787 720, AFSL 234652) (NMFM), AMP Limited ABN 49 079 354 519 nor any other member of the AMP Group (AMP) makes any representations or warranties as to the accuracy or completeness of any statement in it including, without limitation, any forecasts. Past performance is not a reliable indicator of future performance. This document has been prepared for the purpose of providing general information, without taking account of any particular investor’s objectives, financial situation or needs. An investor should, before making any investment decisions, consider the appropriateness of the information in this document, and seek professional advice, having regard to the investor’s objectives, financial situation and needs. This article is solely for the use of the party to whom it is provided and must not be provided to any other person or entity without the express written consent AMP. This article is not intended for distribution or use in any jurisdiction where it would be contrary to applicable laws, regulations or directives and does not constitute a recommendation, offer, solicitation or invitation to invest.
The information on this page was current on the date the page was published. For up-to-date information, we refer you to the relevant product disclosure statement, target market determination and product updates available at amp.com.au.

