

Key points
- In Australia, government spending has reached a record high as a share of the economy. The US government sector has trended down as a share of the economy over time.
- The influence of government spending is clear in construction, with public building and engineering projects rising as a share of GDP, at the expense of private projects.
- The impact on the labour market hasn’t been as evident. Public sector jobs make up around 14% of employment, which has been steady over the past 12 months. While there have been a lot of jobs created in healthcare and education, some of these are private sector jobs.
- There is no “perfect” level of the government sector we need to adhere to, but signs of the public sector crowding out the private sector can become a problem over time.
- Rising government spending over the long-term is usually associated with higher inflation, interest rates and bond yields. Productivity growth can also suffer. There does not seem to be a discernible impact on inequality as the government becomes a larger or smaller share of the economy (although it would probably matter at the extremes).
Introduction
The June quarter national accounts data showed that government spending has been rising as a share of the Australian economy and has reached a record high of just under 28% of GDP (see the chart below). We look at the implications of a bigger government in this edition of Econosights.
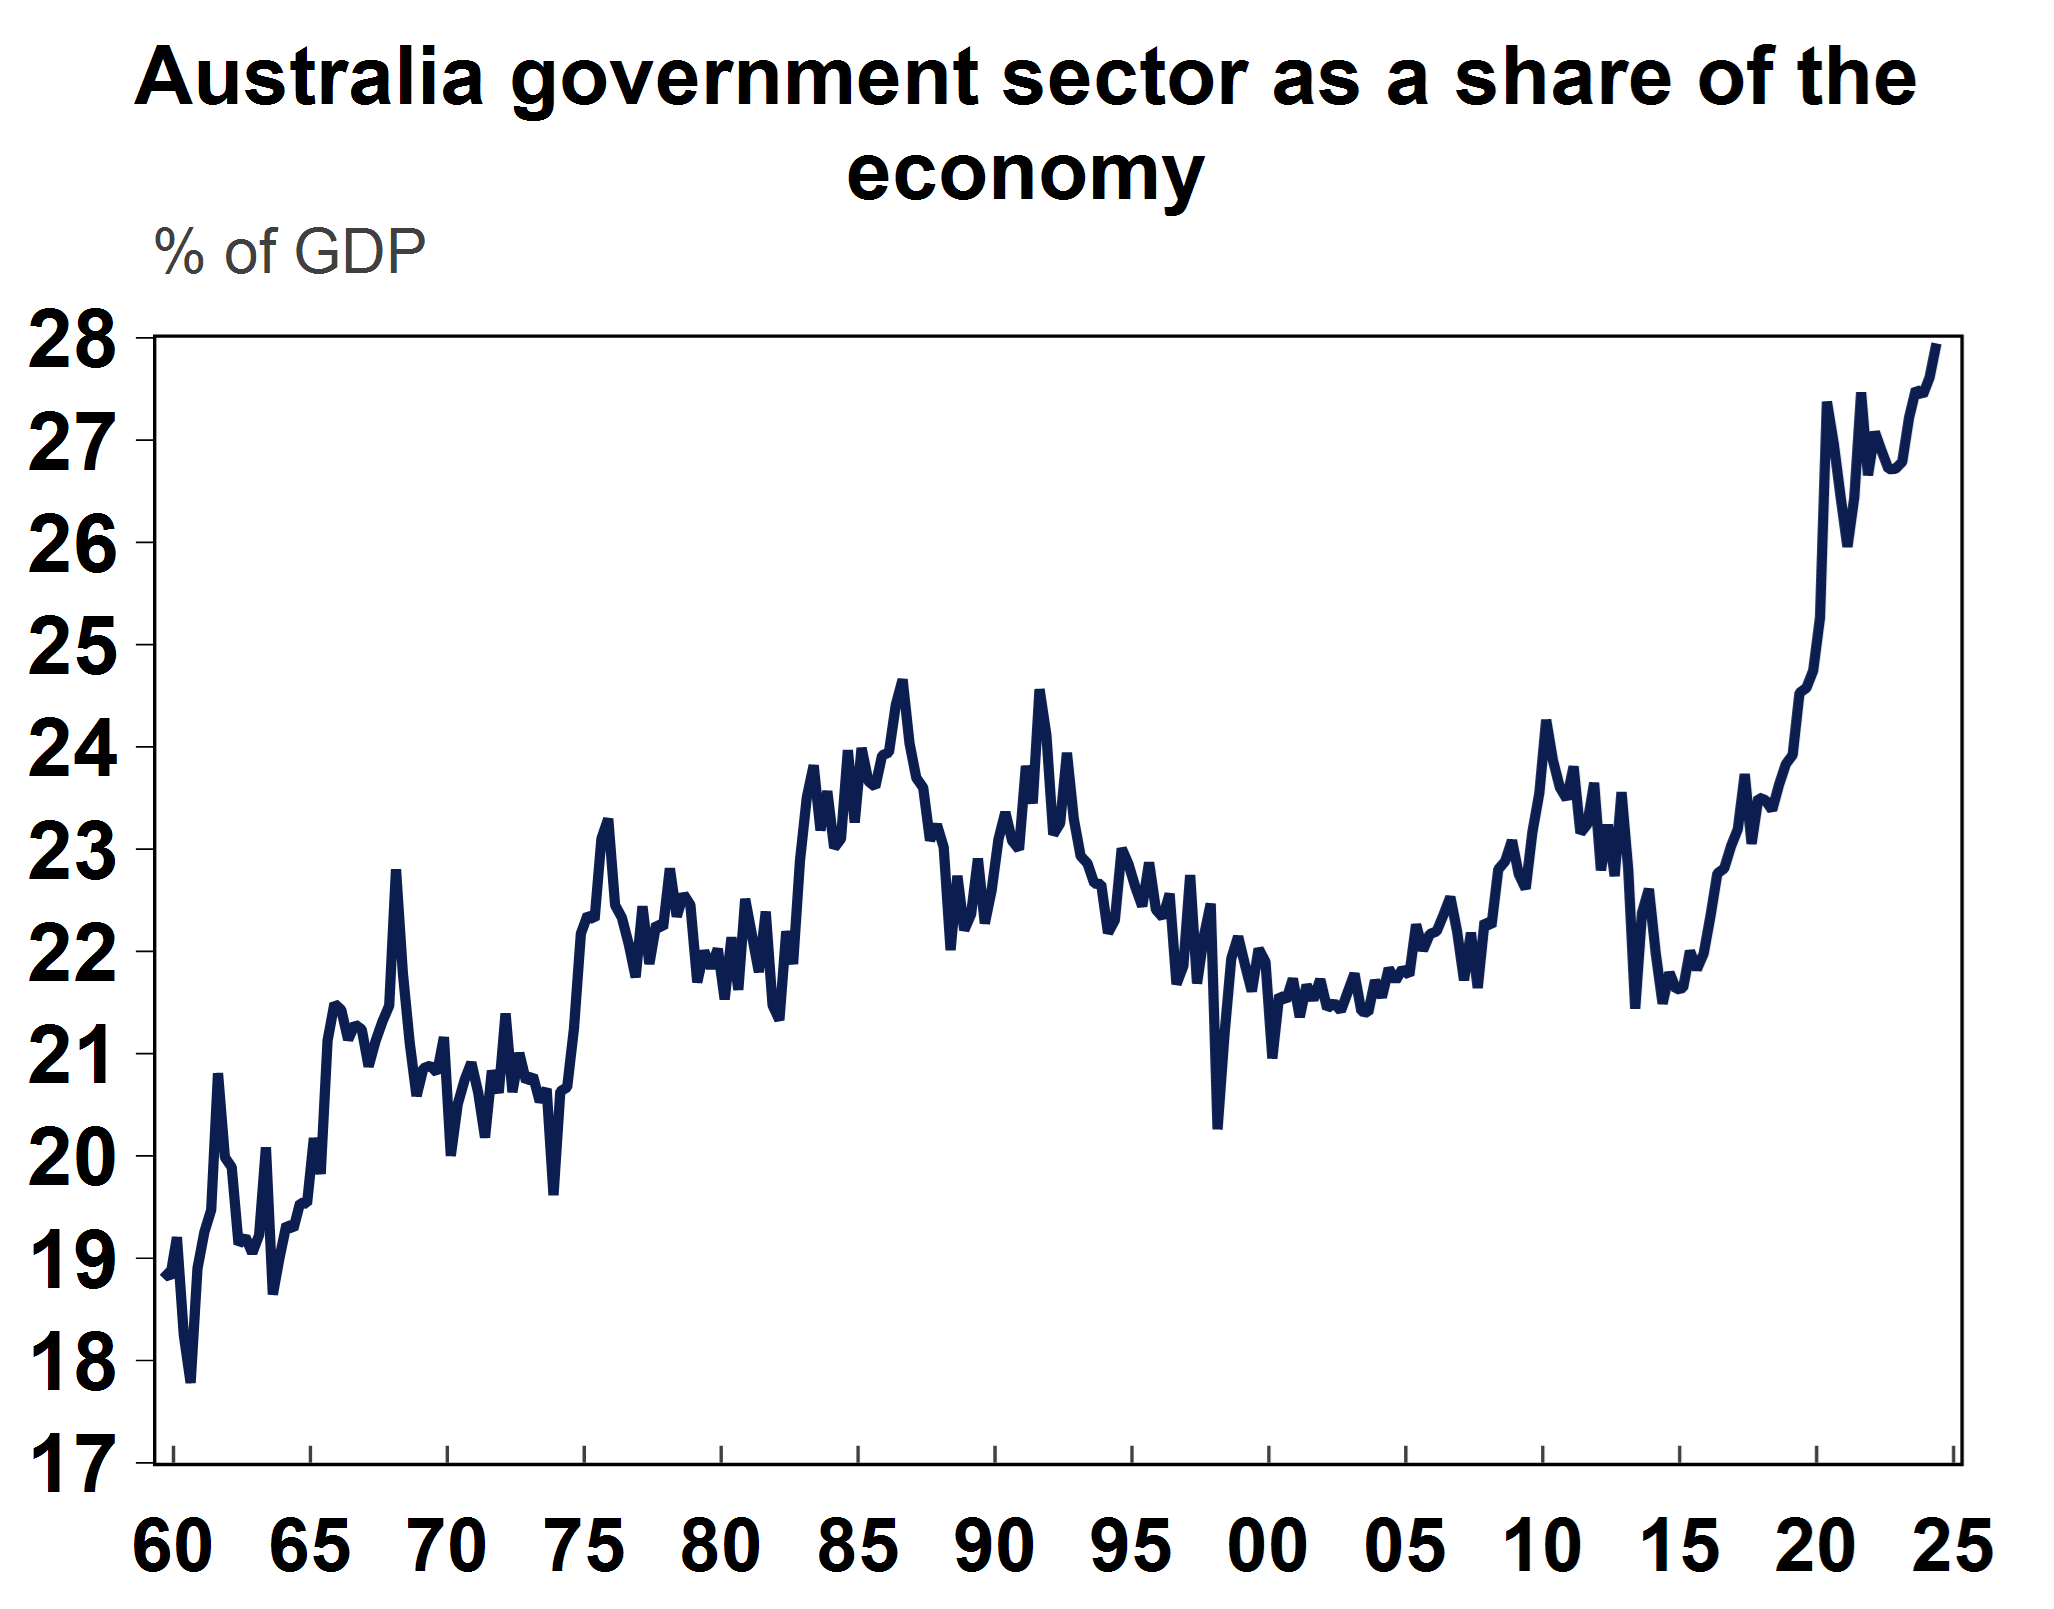
Source: Macrobond, ABS, AMP
What is the role of government?
The first question to ask is what is the purpose of government? While many will have different opinions on this, the basic purpose of the government is to provide a safety net and administer goods and services that the private sector would be ineffective at providing. This is mostly in areas of the economy that are not meant to generate a profit (for example things like education and healthcare).
Government spending in the economy is accounted for via “consumption” which is otherwise known as “government final consumption expenditure”. This is basically all the government’s current expenditure across its portfolios which is mostly transfers (pensions, unemployment benefits and welfare payments) and public wages. There is also government investment which is known as “public gross fixed capital formation” which is the value of net new public assets, taking into account transfers to the private sector. Investment is much smaller than government consumption because assets can be sold to the private sector. The reason behind the lift in government spending over the last decade has been through higher consumption, which is running around 5 percentage points above its long-run average (as a share of GDP). The COVID-19 pandemic led to a big level increase in government spending. Government investment tends to be fairly steady at 5% of GDP – see the chart below.
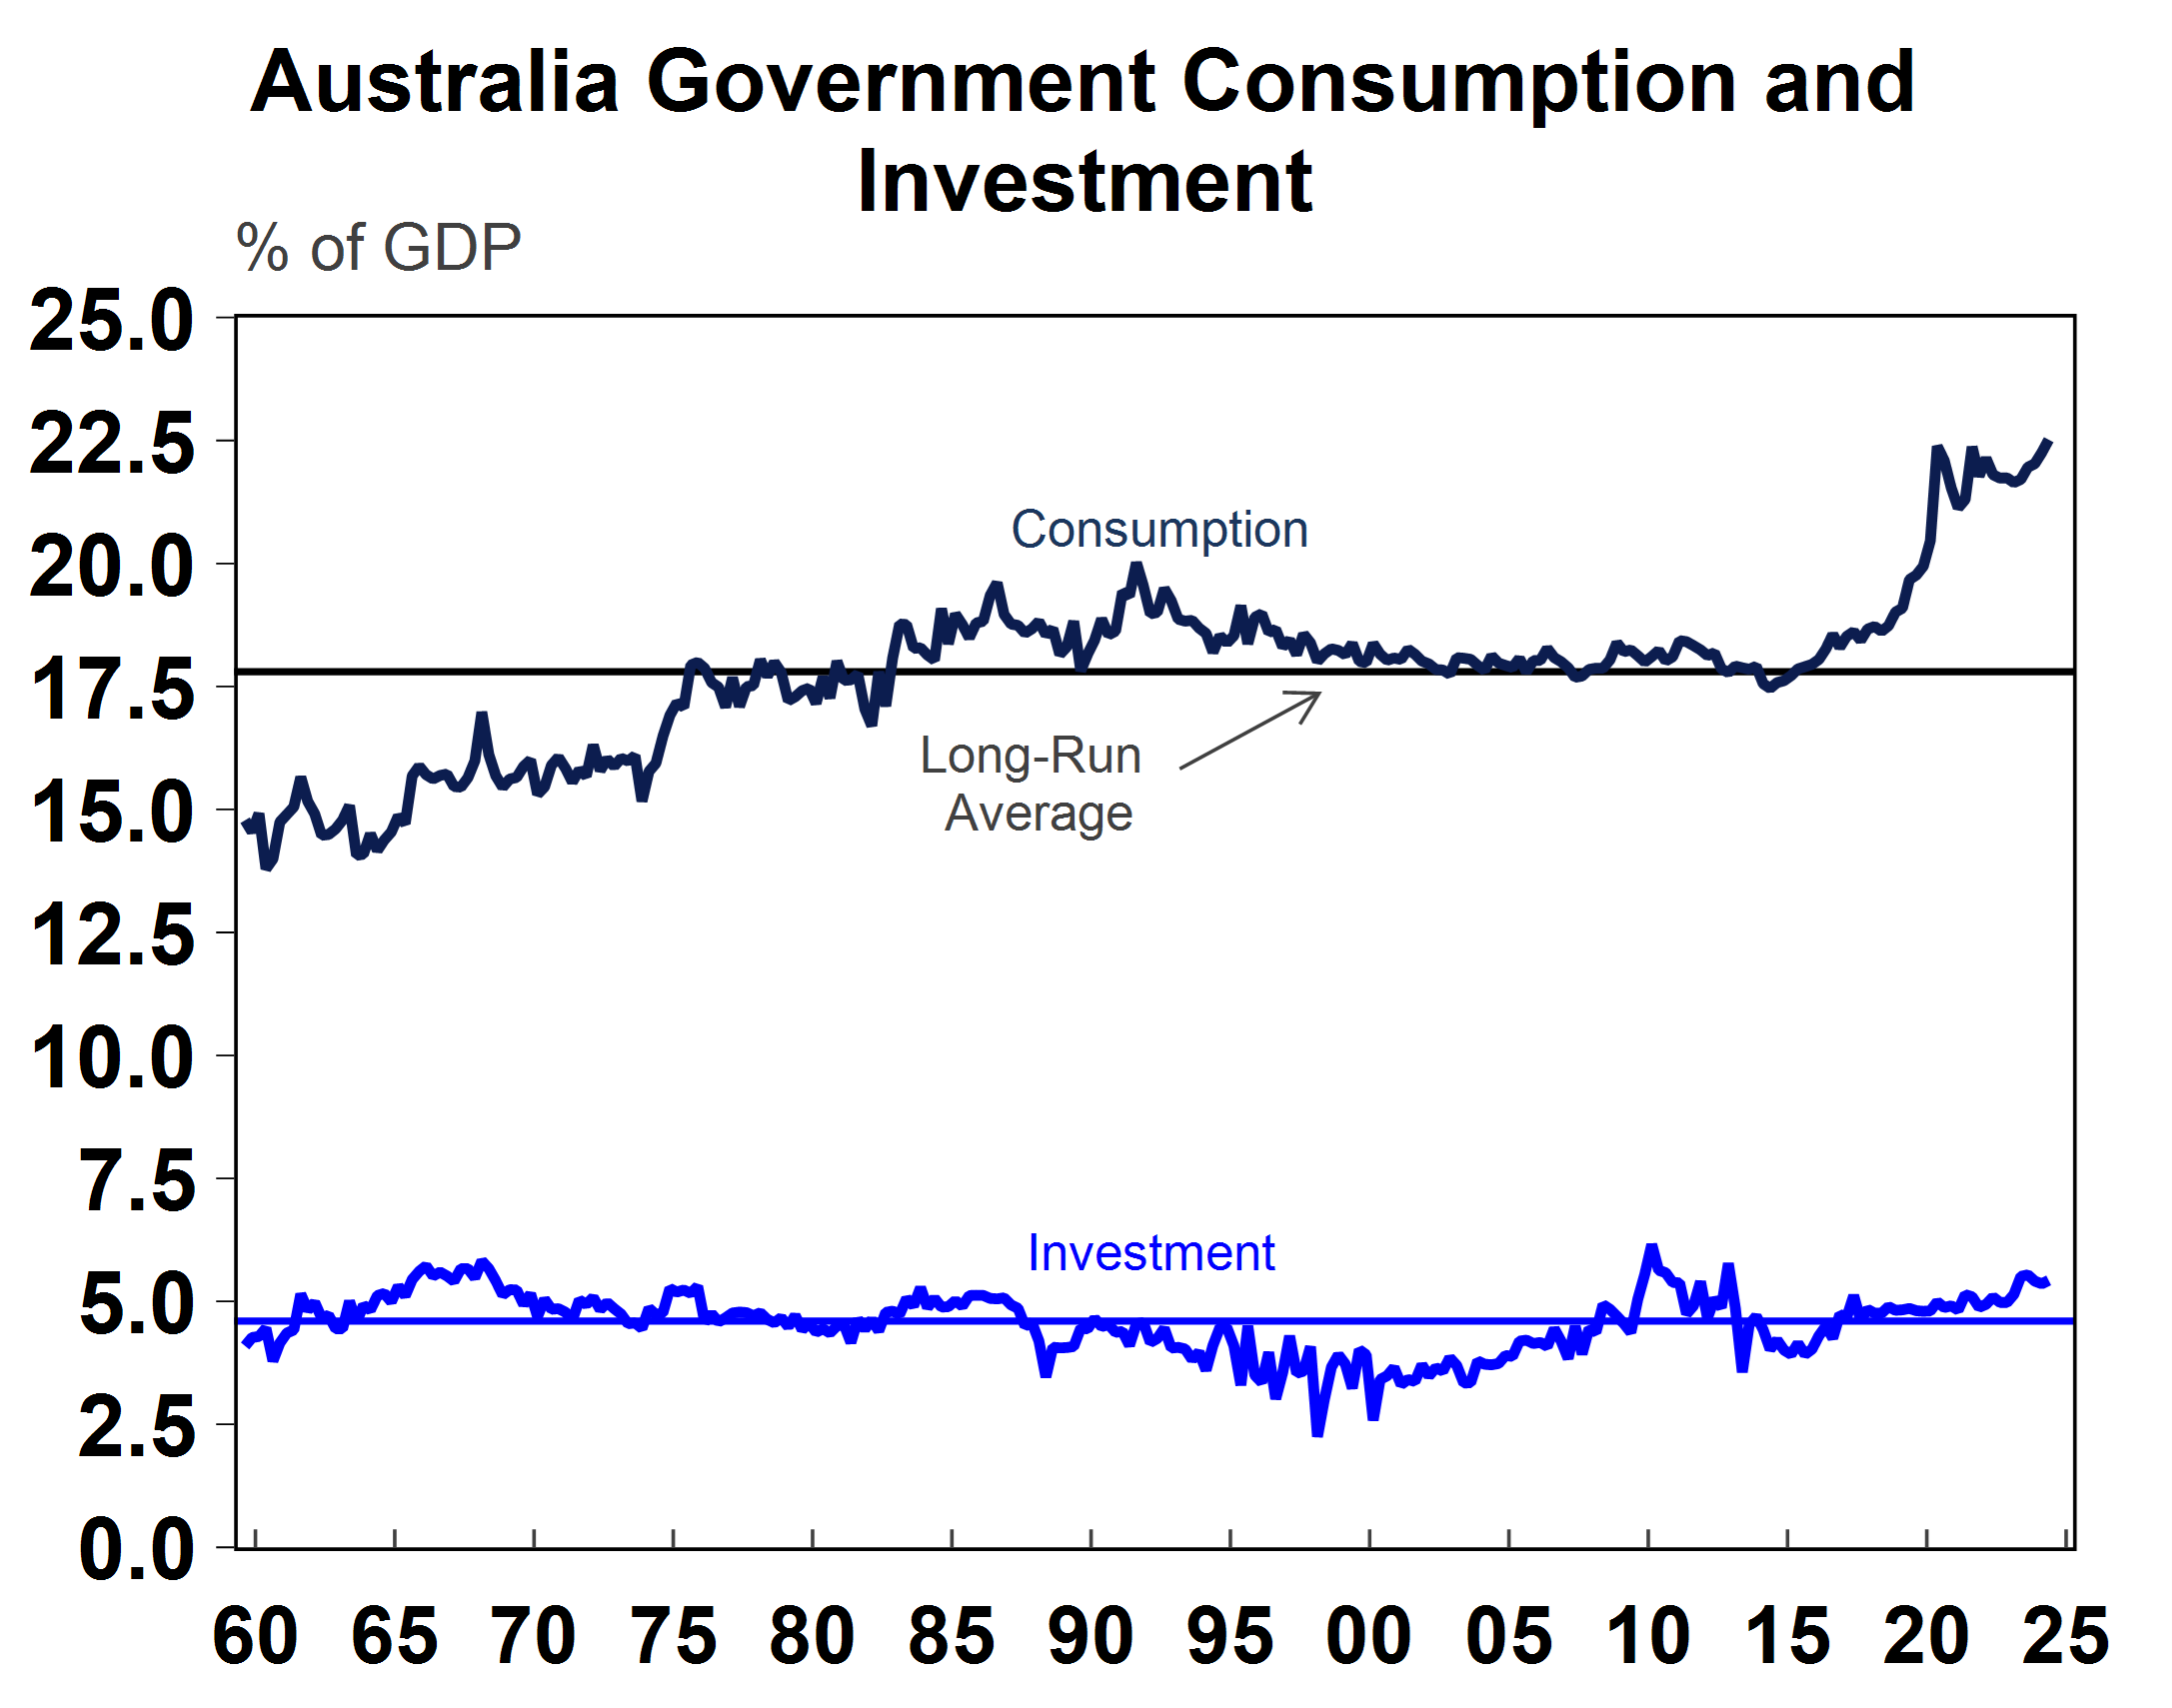
Source: Macrobond, ABS, AMP
The influence of the public sector is clear in infrastructure projects. While private sector construction (building and engineering) still accounts for the majority of work done, public sector construction has been increasing as a share of the economy (see the chart below), resulting in some “crowding out” of the private sector through utilising public sector jobs and resources.
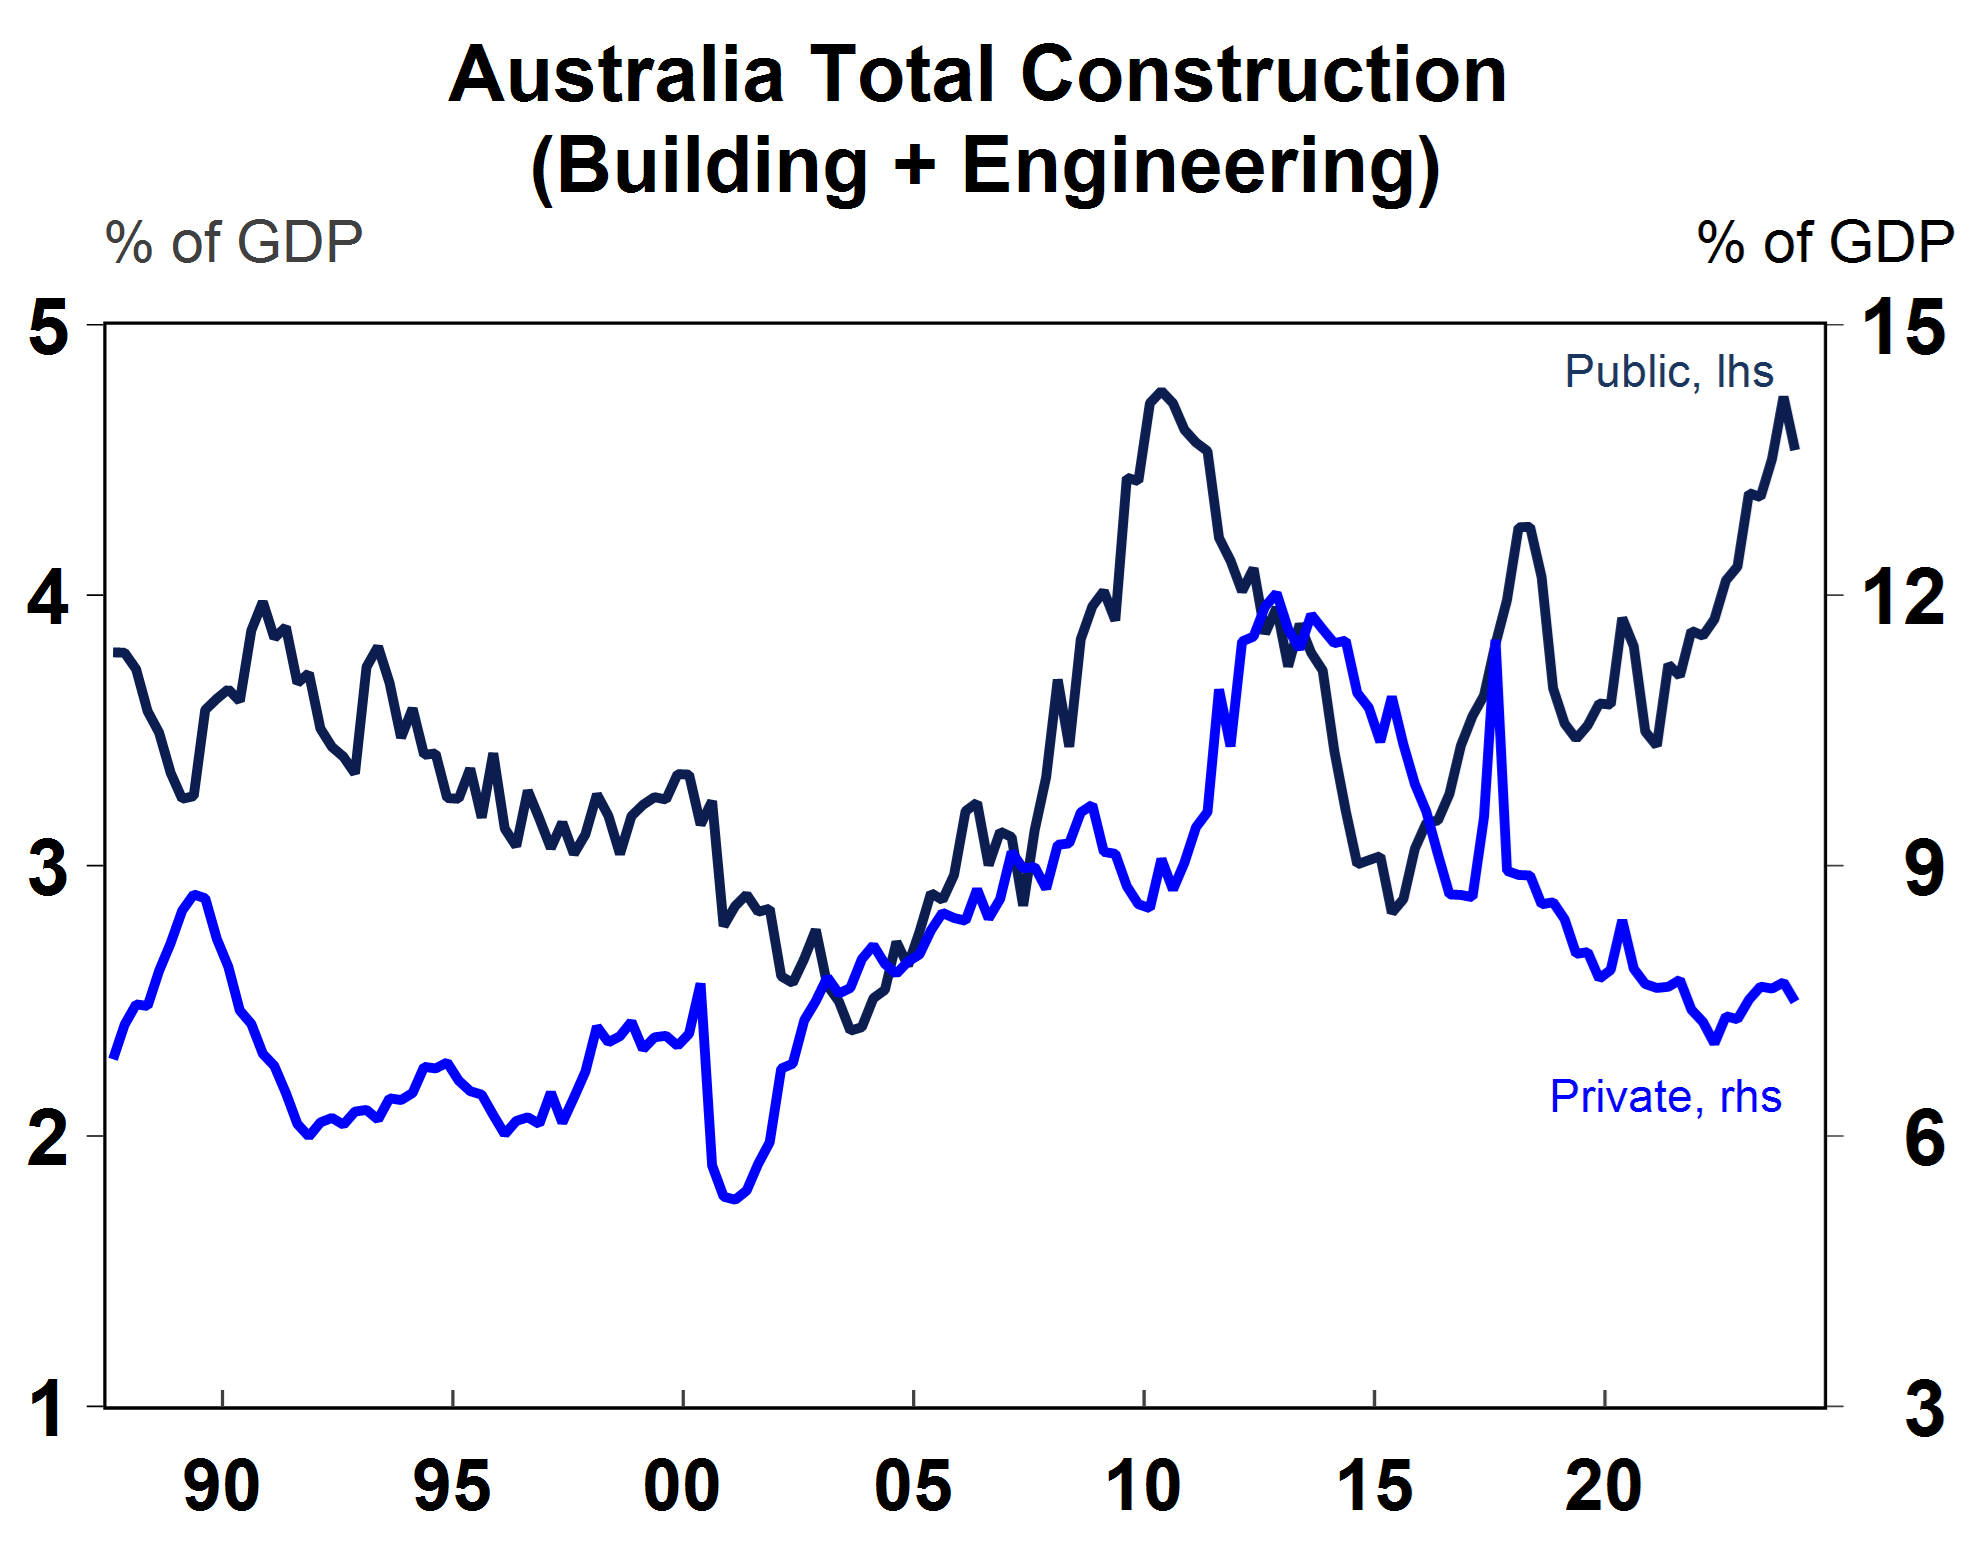
Source: Macrobond, AMP
Many analysts cite the big growth in healthcare and education jobs (which have contributed 44% of total jobs growth over the year to May) as an indicator of the ballooning public sector. However, some of these are private sector jobs. The share of total public sector jobs is ~14% (see the chart below) which barely increased over the past year and is not as high as 2019/20 levels.
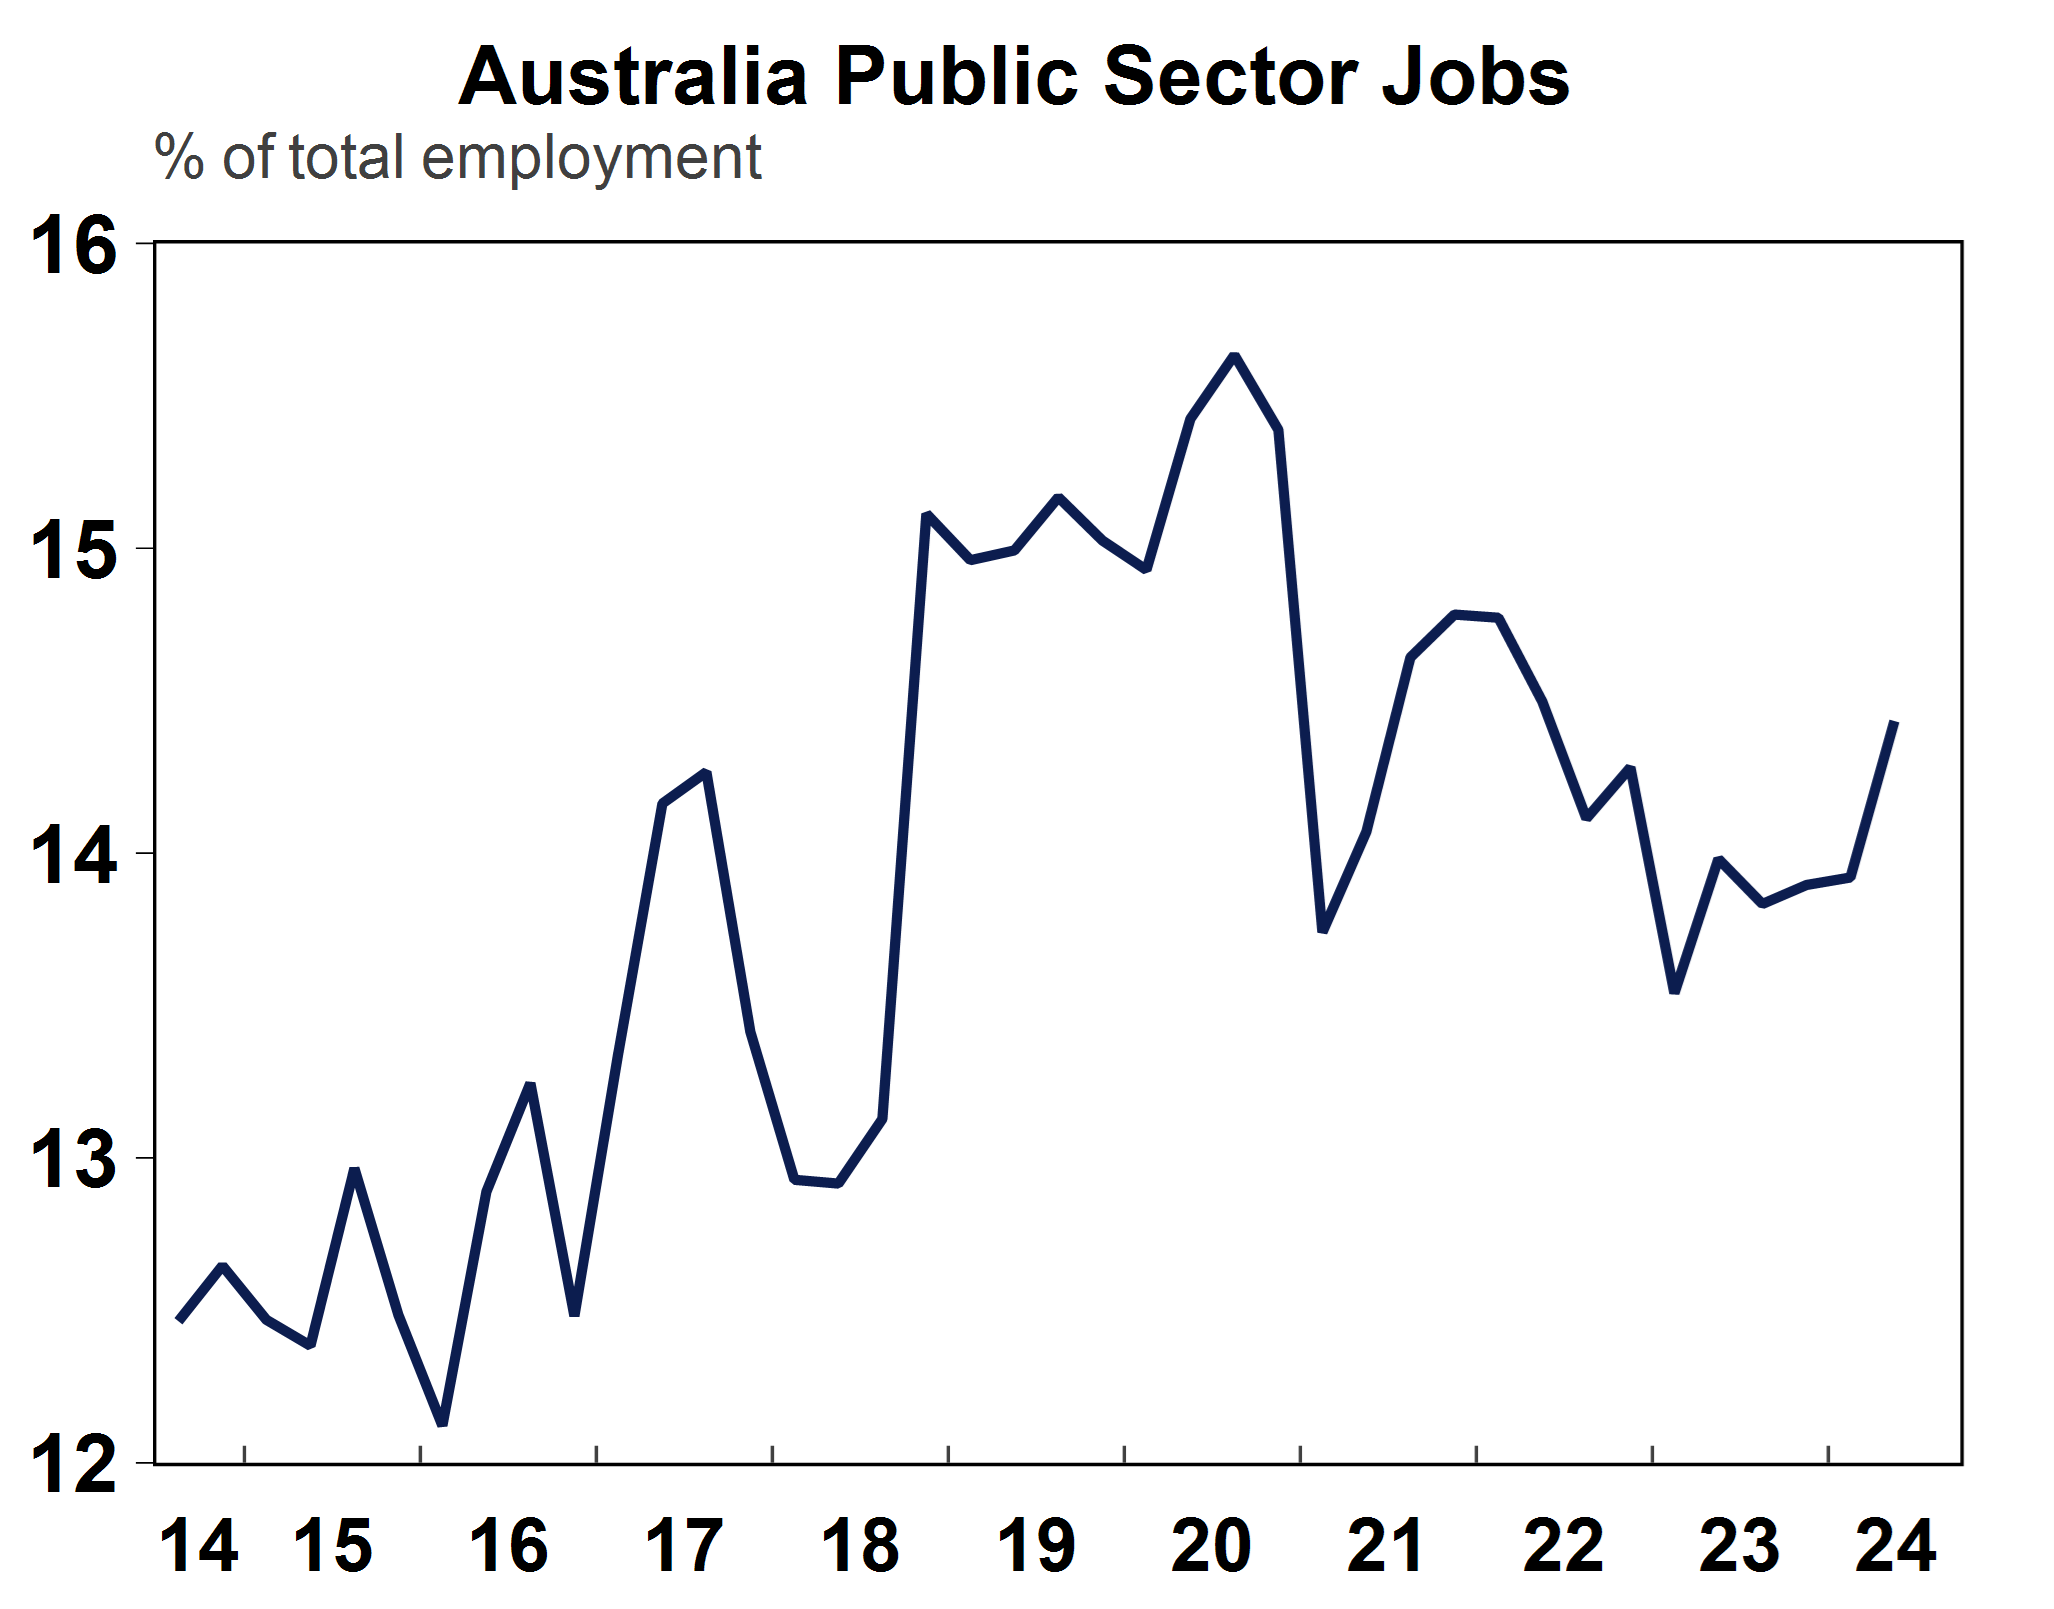
Source: Macrobond, ABS, AMP
In the US, the government share of the economy has been trending down over time (peaking at 24% of GDP) and is now around 17.5% of the economy which is around its historical lows (see the chart below). In other countries that have traditionally had larger government involvement like Sweden and Finland, government spending has been declining as a share of the economy through time, although has been trending up a bit in recent years.
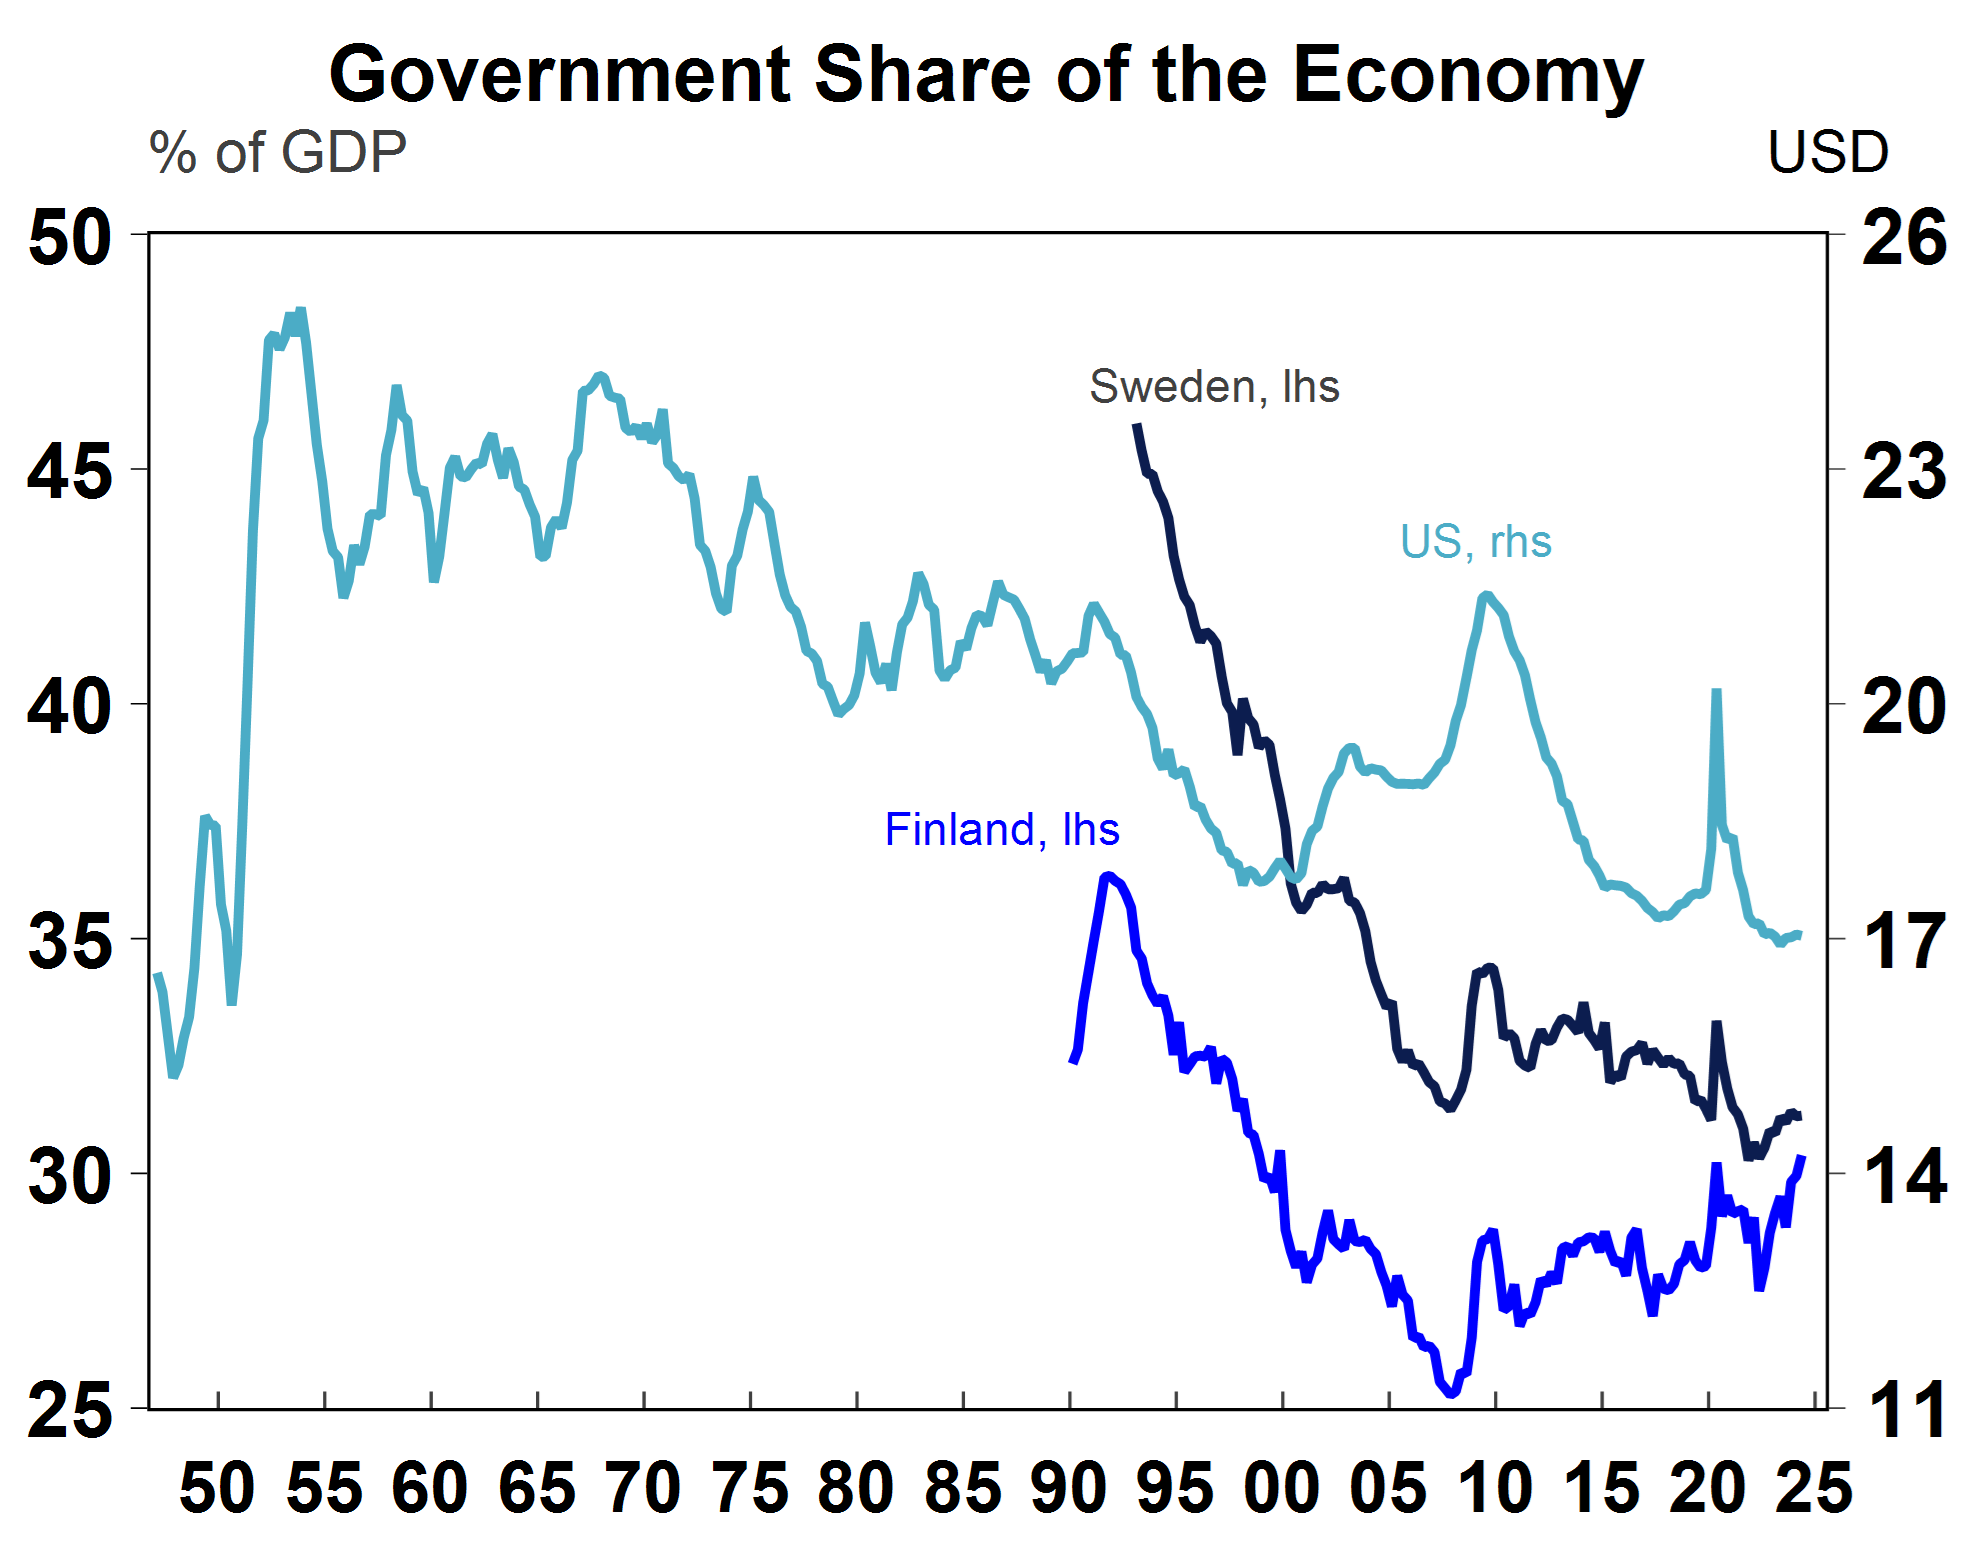
Source: Macrobond, AMP
Impacts of larger government
It is hard to see the value of government spending falling as a share of the economy in Australia in the near-term. Australian budget papers indicate that the budget deficit is going to be an ongoing large share of GDP, at 1.5% of GDP in 2025-26, 0.9% in 2026-27 and 0.8% in 2027-28 (in contrast we currently have a budget surplus of 0.3% of GDP). Government spending is being propped up by increasing spending due to interest costs, the NDIS, defence, health and aged care.
There is no hard and fast rule about the impact of a larger government or what the perfect size of the government should be. Too much government intervention leads to more redistribution, increase inefficiency and lower productivity growth which leaves less room for the private sector to create. But too little government involvement often means that basic goods and infrastructure are not provided. If Australia had not had the same level of government spending in recent years, economic growth may have been weaker than it has been. A larger public sector is often used to blame for Australia’s low productivity growth (GDP per hour worked was up by just 0.4% over the year to June). However, productivity growth in Australia has also been poor in the market (i.e. private) sector - see the chart below.
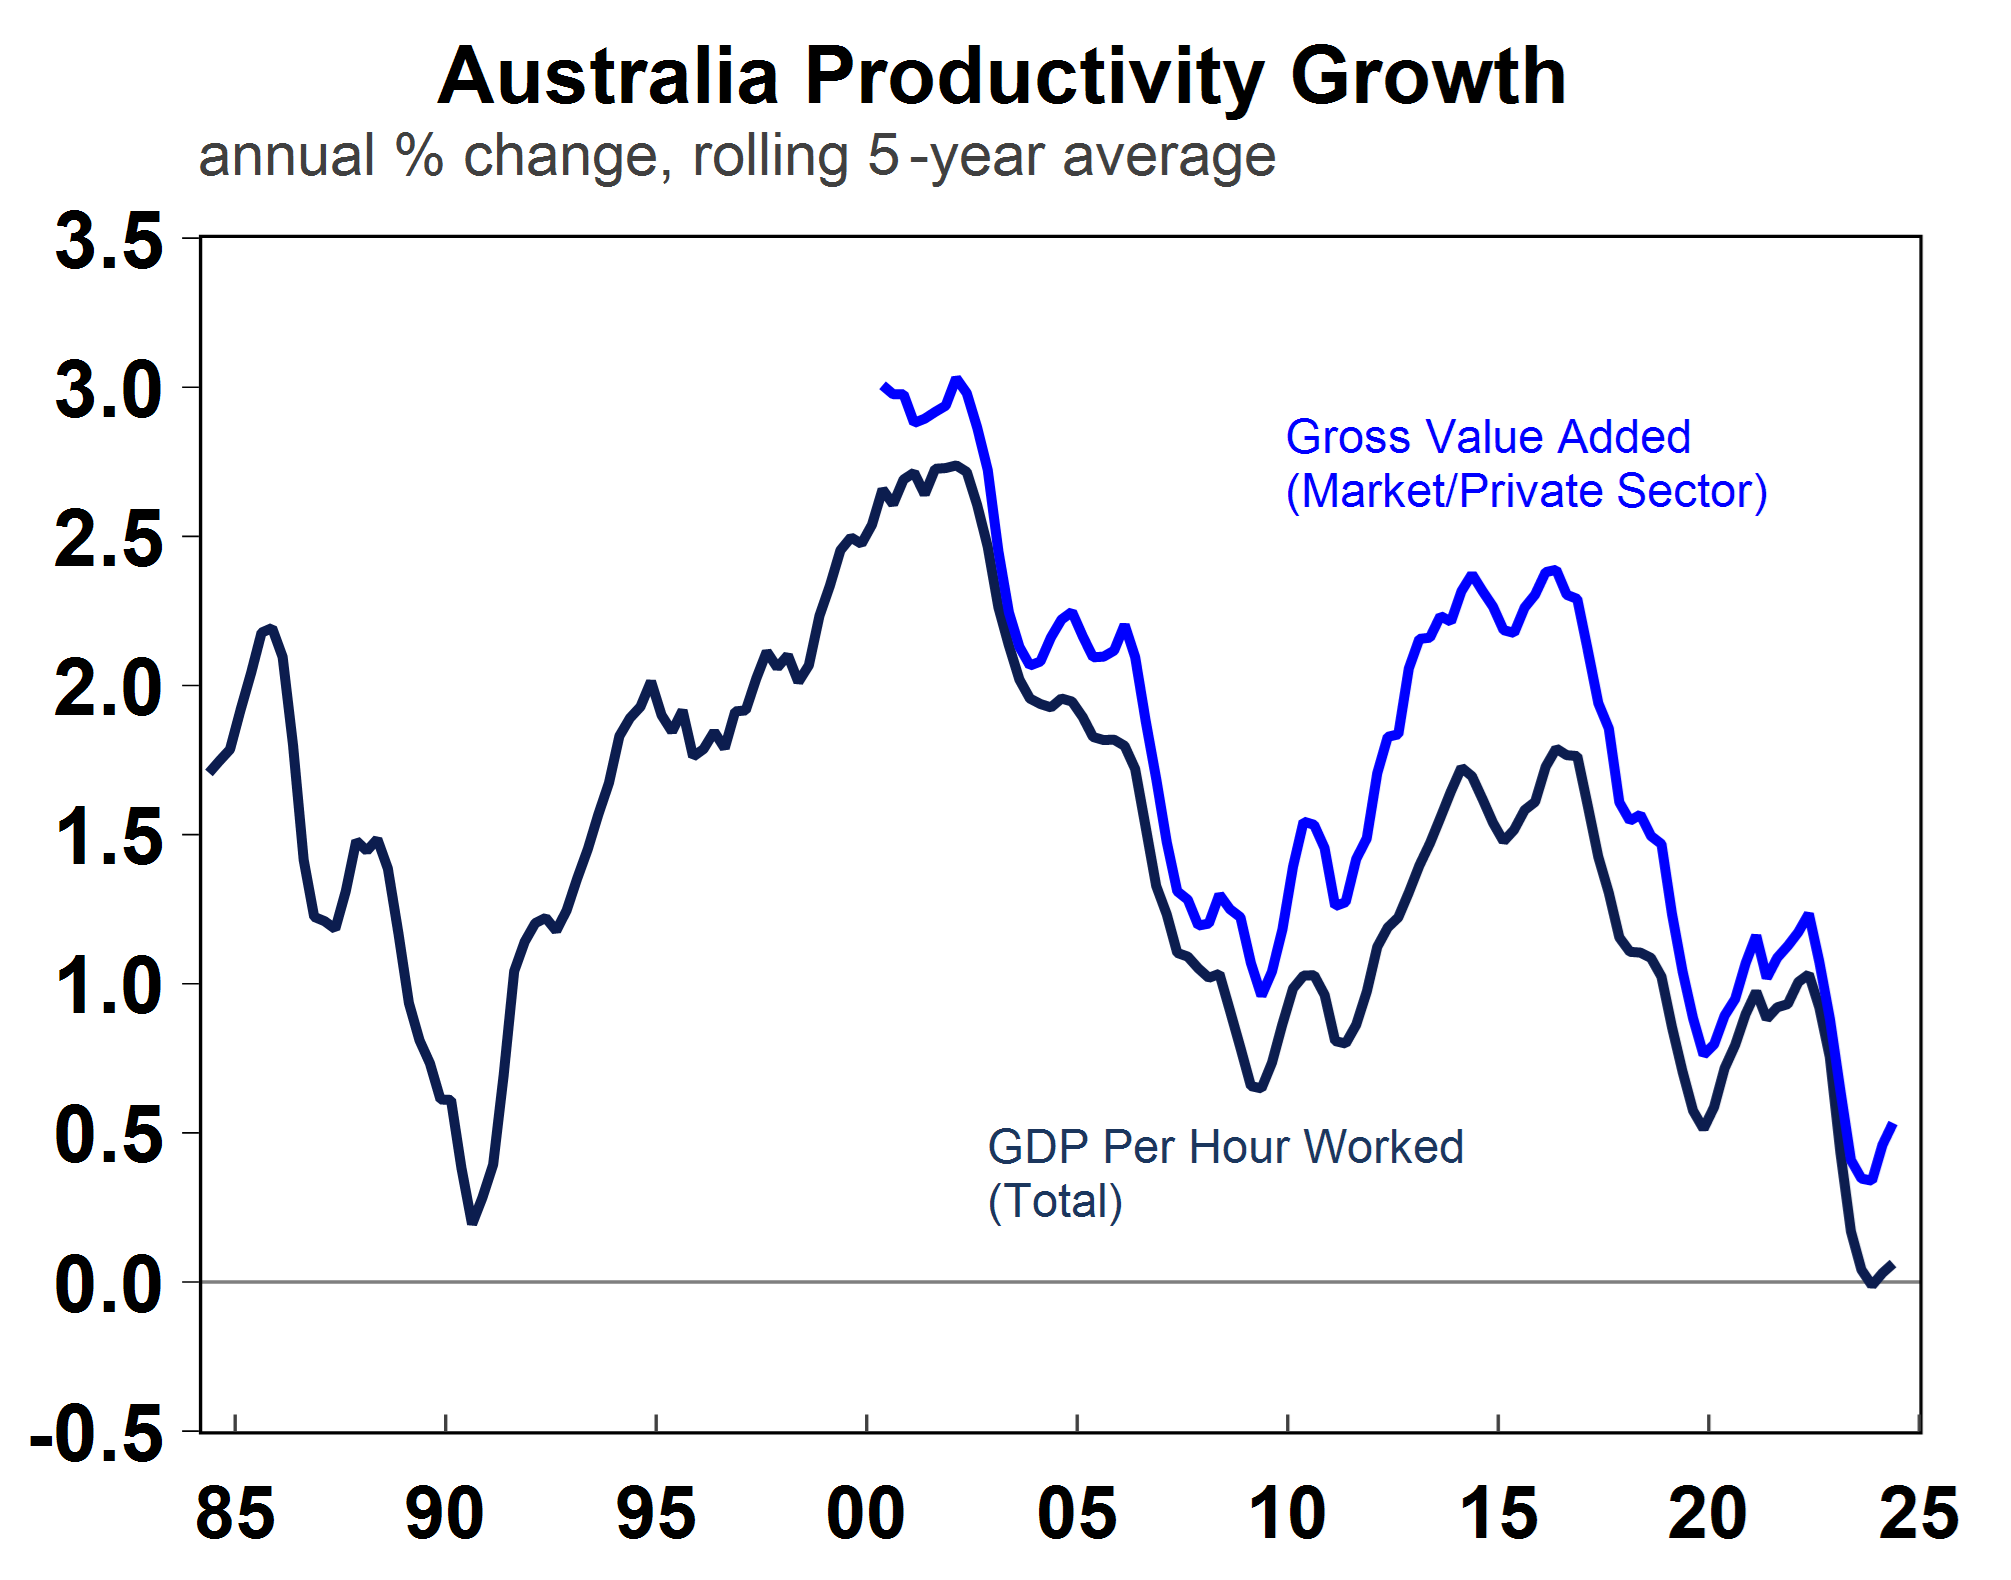
Source: Macrobond, ABS, AMP
The impact of a rising or falling government sector does not appear to have a significant impact on inequality (as measured by the Gini coefficient). Inequality has gone up in many advanced countries in recent decades (see the chart below) who have had differing levels of government spending.
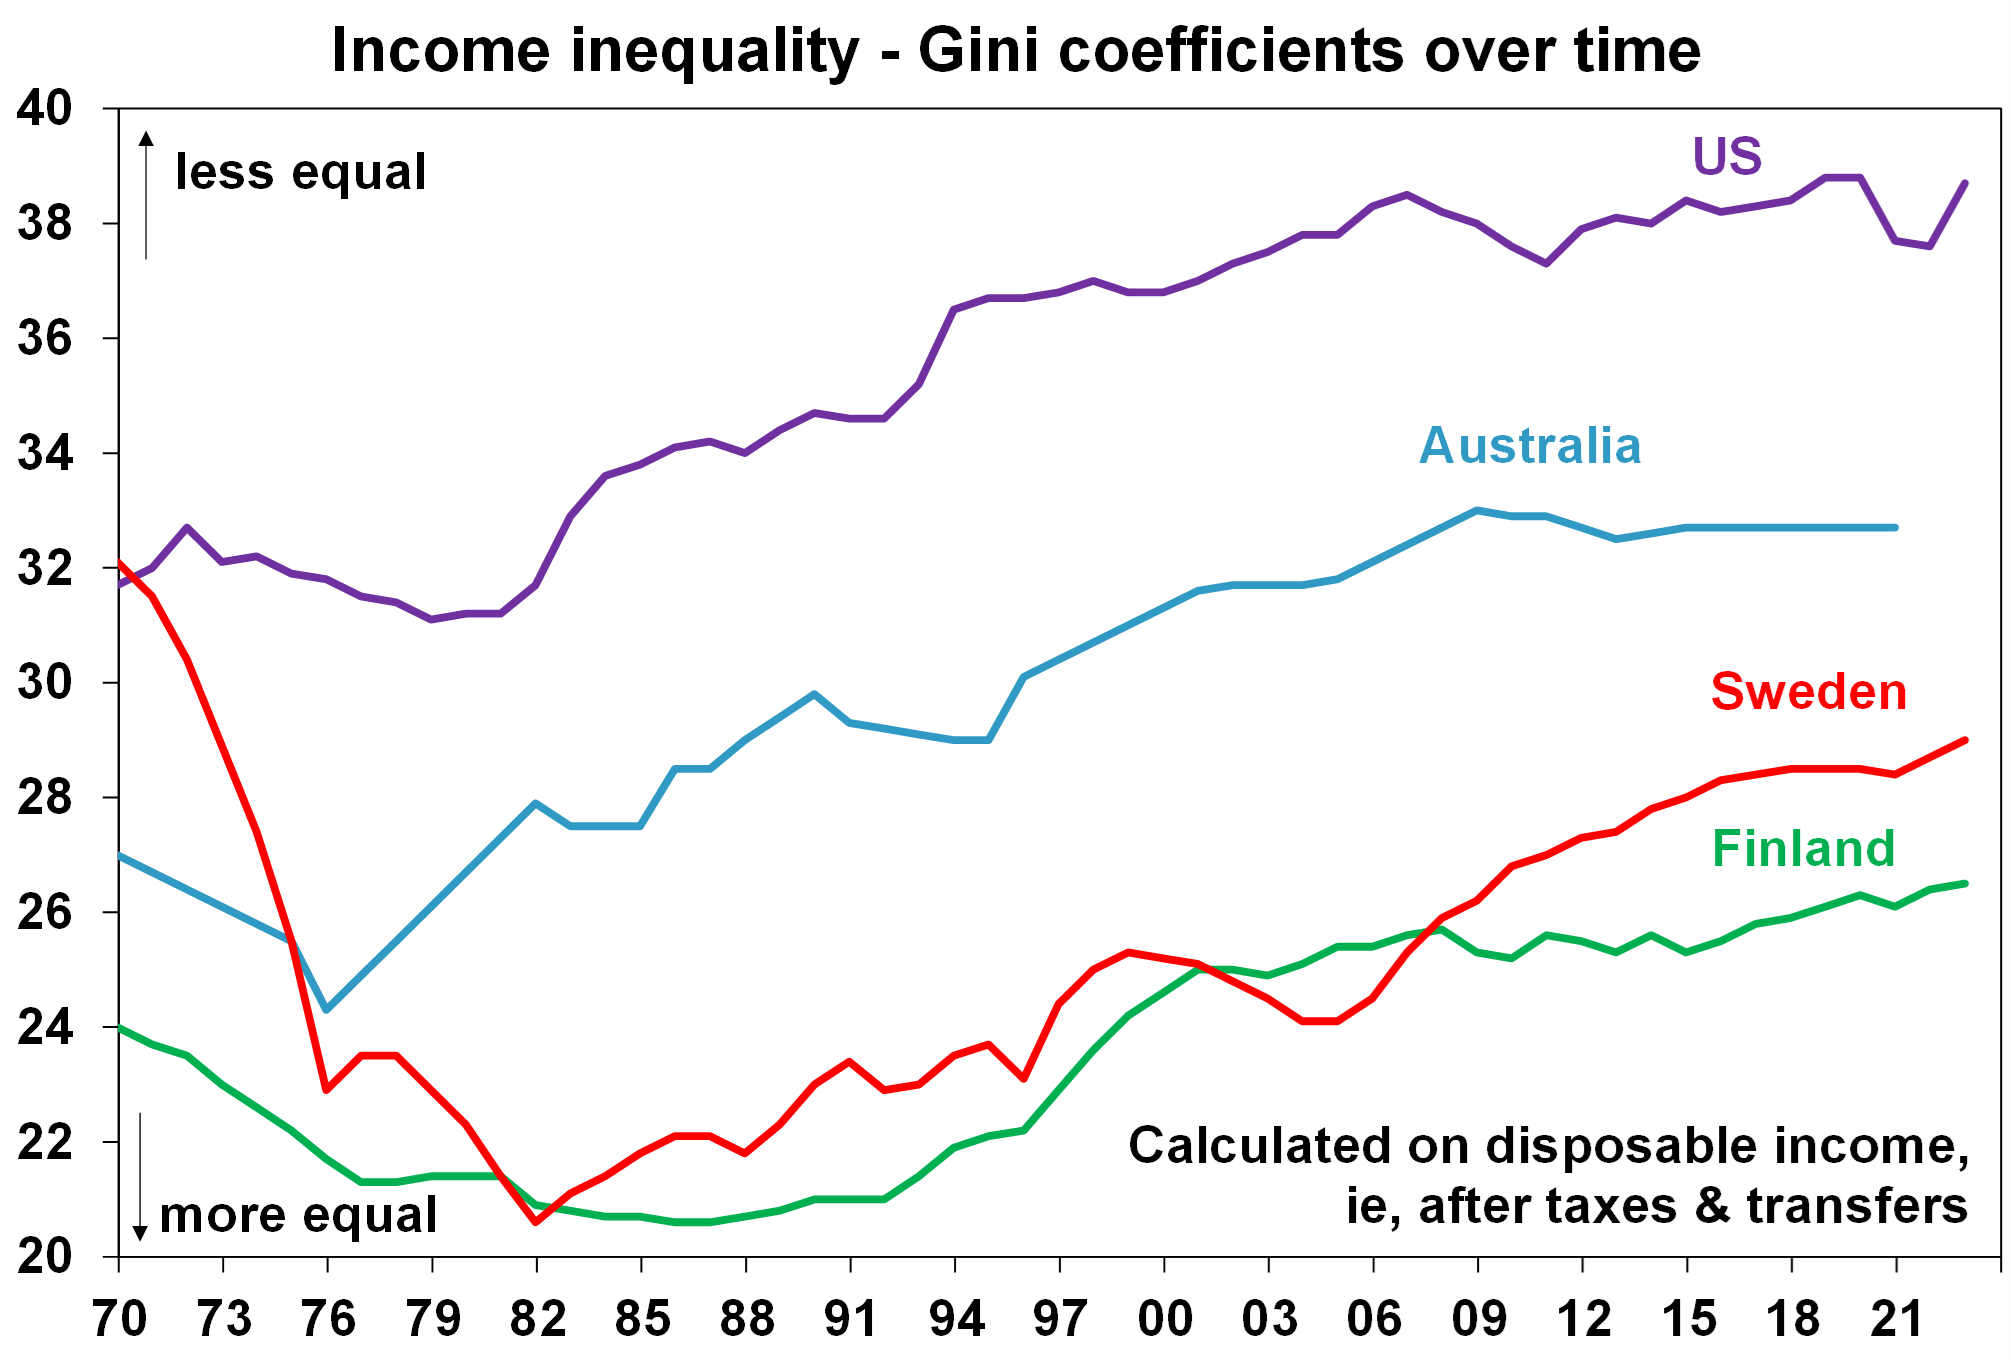
Source: Standardized World Income Inequality Database, AMP
In the short-run, the increasing public sector in Australia may not have clear impacts on the economy. But generally, a ballooning public sector is associated with higher inflation over the long-term (especially if the public sector crowds out the private sector) which means higher interest rates and bond yields and can also be associated with lower productivity growth.

Oliver's insights - Trump challenges and constraints
19 November 2024 | Blog Why investors should expect a somewhat rougher ride, but it may not be as bad as feared with Donald Trump's US election victory. Read more
Econosights - strong employment against weak GDP growth
18 November 2024 | Blog The persistent strength in the Australian labour market has occurred against a backdrop of poor GDP growth, which is unusual. We go through this issue in this edition of Econosights. Read more
Weekly market update 15-11-2024
15 November 2024 | Blog Global share markets were messy over the last week, not helped by the ongoing rise in bond yields and a wind back in Fed rate cut expectations after some elevated US inflation data and slightly hawkish comments from Fed chair Powell. Read moreWhat you need to know
While every care has been taken in the preparation of this article, neither National Mutual Funds Management Ltd (ABN 32 006 787 720, AFSL 234652) (NMFM), AMP Limited ABN 49 079 354 519 nor any other member of the AMP Group (AMP) makes any representations or warranties as to the accuracy or completeness of any statement in it including, without limitation, any forecasts. Past performance is not a reliable indicator of future performance. This document has been prepared for the purpose of providing general information, without taking account of any particular investor’s objectives, financial situation or needs. An investor should, before making any investment decisions, consider the appropriateness of the information in this document, and seek professional advice, having regard to the investor’s objectives, financial situation and needs. This article is solely for the use of the party to whom it is provided and must not be provided to any other person or entity without the express written consent AMP. This article is not intended for distribution or use in any jurisdiction where it would be contrary to applicable laws, regulations or directives and does not constitute a recommendation, offer, solicitation or invitation to invest.
The information on this page was current on the date the page was published. For up-to-date information, we refer you to the relevant product disclosure statement, target market determination and product updates available at amp.com.au.