Key points
- Global inflation has been surprising to the downside recently and there is growing checklist of forward-looking inflation indicators which are pointing to further downward pressure including: Chinese deflation, lower food prices, declines in commodity prices, falling capacity utilisation and a continued decline in the money supply.
- The easing in global inflation is a positive sign for future Australian inflation data. Australian inflation peaked later compared to global peers so is also lagging the decline.
- We see Australian inflation at 4% by the end of and back at the top end of the RBA’s target band by early 2024.
Introduction
The Australian inflation data has been the predominant driver of RBA policy decisions since the first interest rate increase in May 2022, so any updates to inflation figures are critical in determining the future path of monetary policy. In this edition of Econosights we look at the recent trends in global inflation figures (which have mostly been surprising to the downside), domestic Australian inflation trends and what this means for next week’s June quarter consumer price figures.
The global context
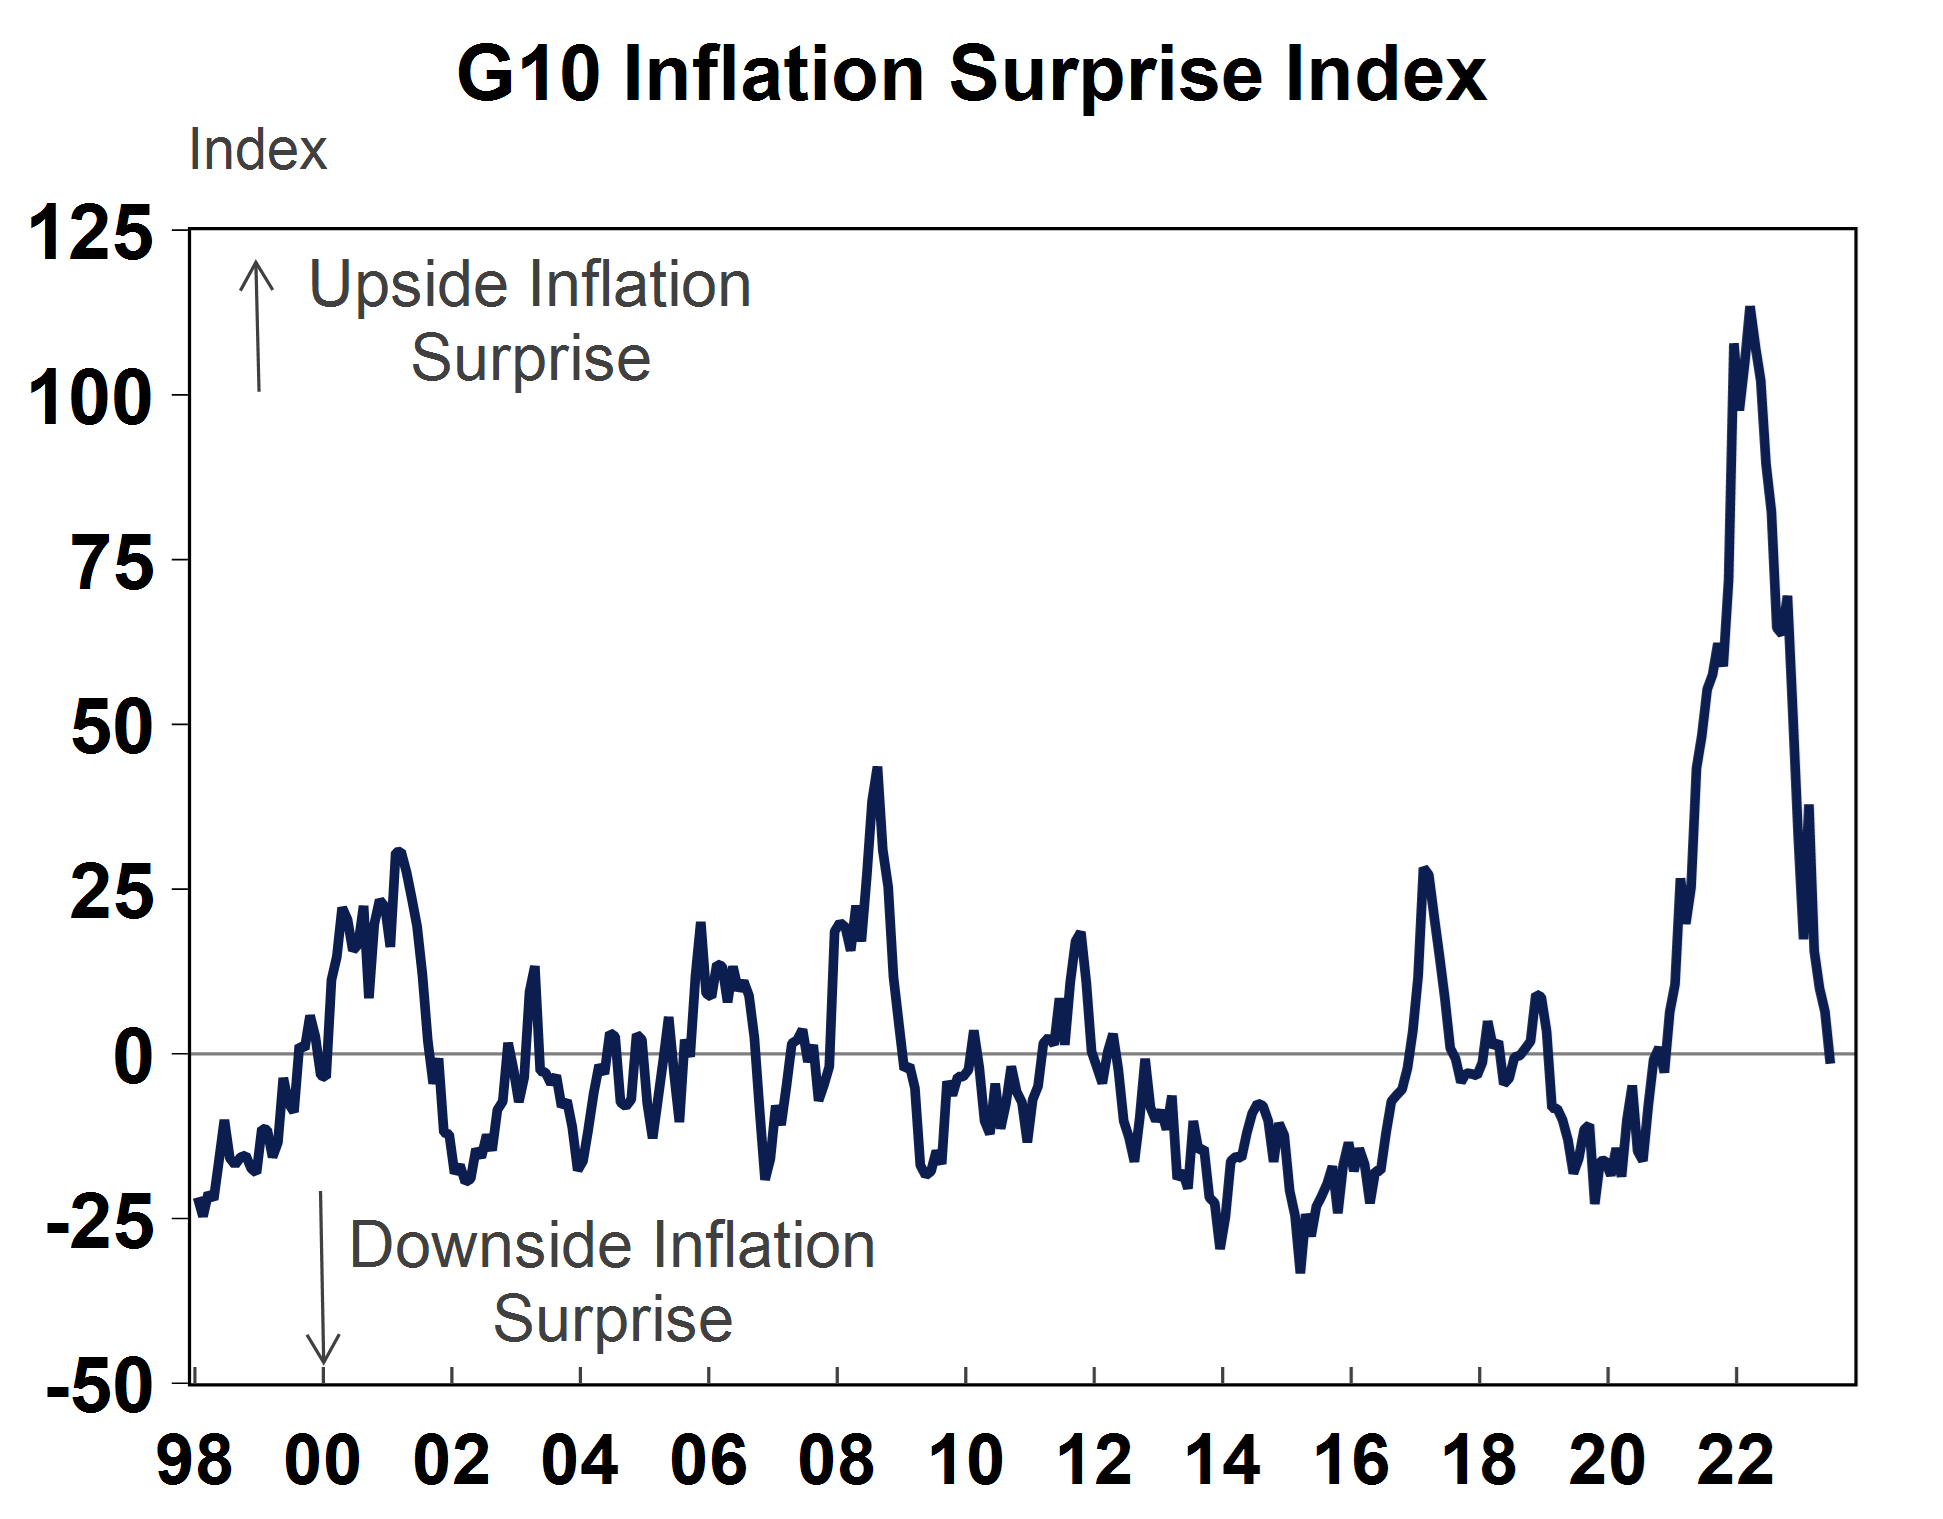
Inflation was much stronger than consensus expectations throughout late 2021/22 but the latest inflation figures have been surprising to the downside in many countries. The G10 “inflation surprise” index, which measures the difference between actual and consensus estimates of various inflation series, moved negative recently – see the chart below.
Source: Macrobond
The high inflation environment in 2021-22 had caused many to be concerned that high inflation would become entrenched. While inflation is still above central bank’s targets, inflation has come down noticeably over the past few months. This has occurred as global shipping costs have normalised, commodity prices have declined and a slowing in growth has led to a slowing in consumer goods demand, helping to reduce inflationary pressures. Goods prices usually lead services prices and services inflation has now started to slow, following the signal from goods prices.
There is now an ever-growing checklist of inflation surprising to the downside around the world including:
- Chinese deflation, with consumer prices falling every month since February and flat over the year to June. Producer prices have been declining since April and producer prices are down by 5.4% over the year to June. Because of China’s large presence in global trade, falling Chinese goods prices are exported globally. US imports from China were down by 2.3% over the year to June – the largest fall since November 2009.
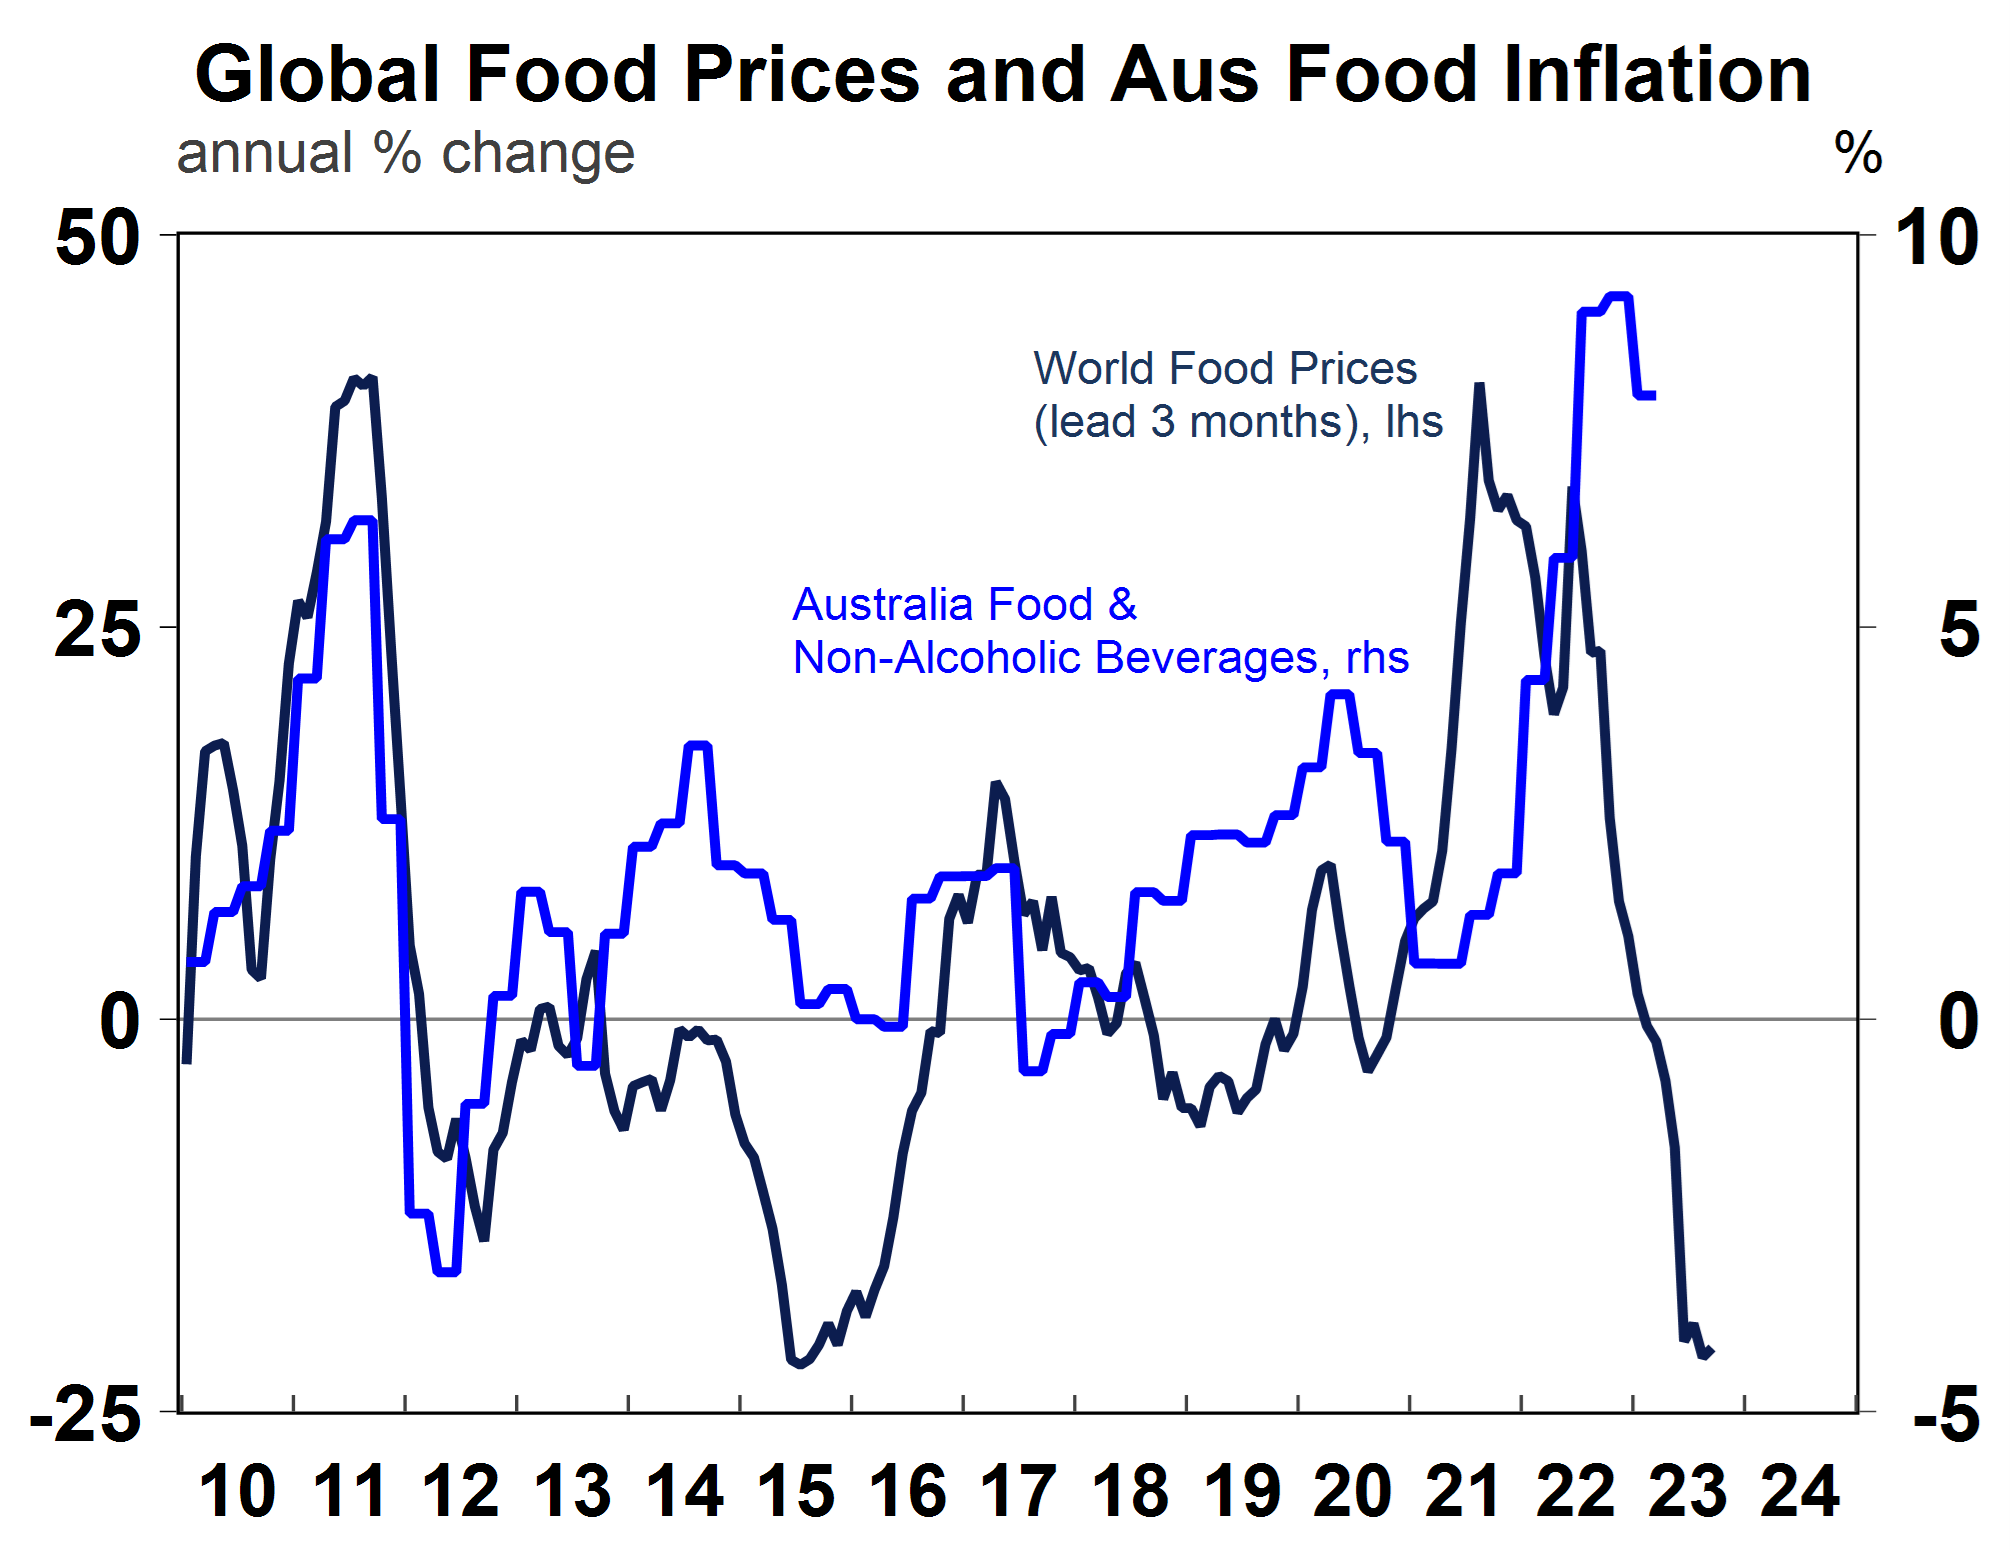
- Food inflation will continue to decline as most agricultural commodities are well down from their highs (although fertiliser prices are still above pre-Covid levels) and the world food price index is much lower than a year ago (see the chart below).
Source: Macrobond, AMP
- Continuing declines in many other global commodities like energy and metals prices will also help to reduce inflation through the supply chain.
- Capacity utilisation (in the US and Australia) has fallen alongside the slowing in GDP growth.
- Money supply growth has plummeted across the major economies as central banks have tightened monetary policy and some are actively pursuing quantitative tightening.
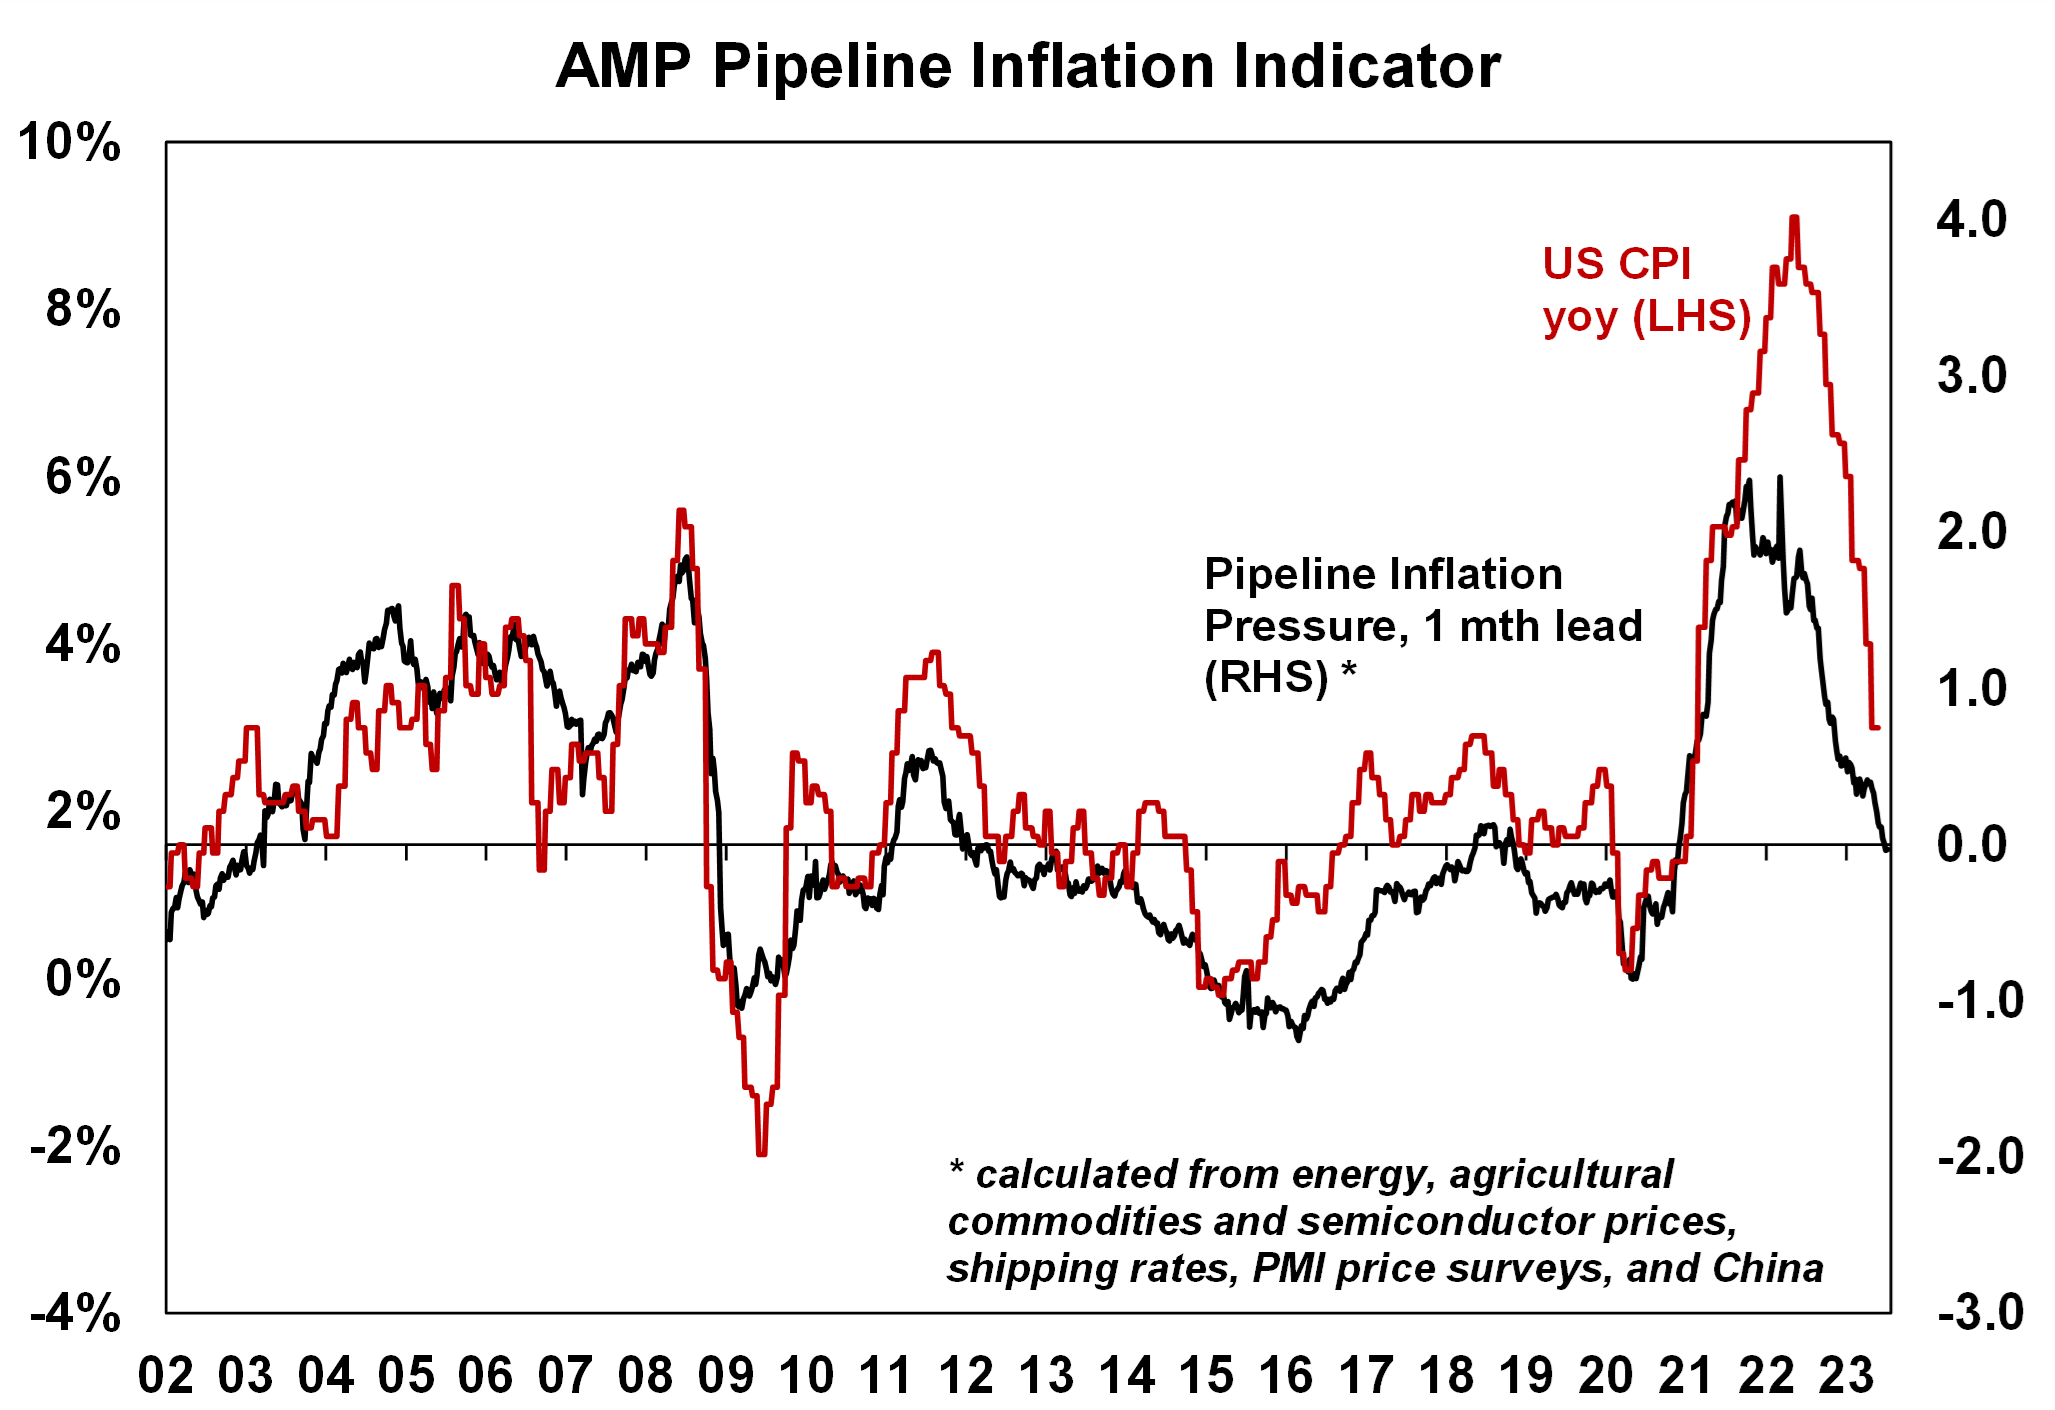
Our own Pipeline Inflation indicator (see the below chart) measures some of these leading indicators of inflation including major commodity prices, semiconductor prices, shipping rates, PMI survey prices and the Chinese producer price index and has been a very useful guide to US inflation (particularly for goods) and is indicating more downside to come for US inflation by the end of the year.
Source: Bloomberg, AMP
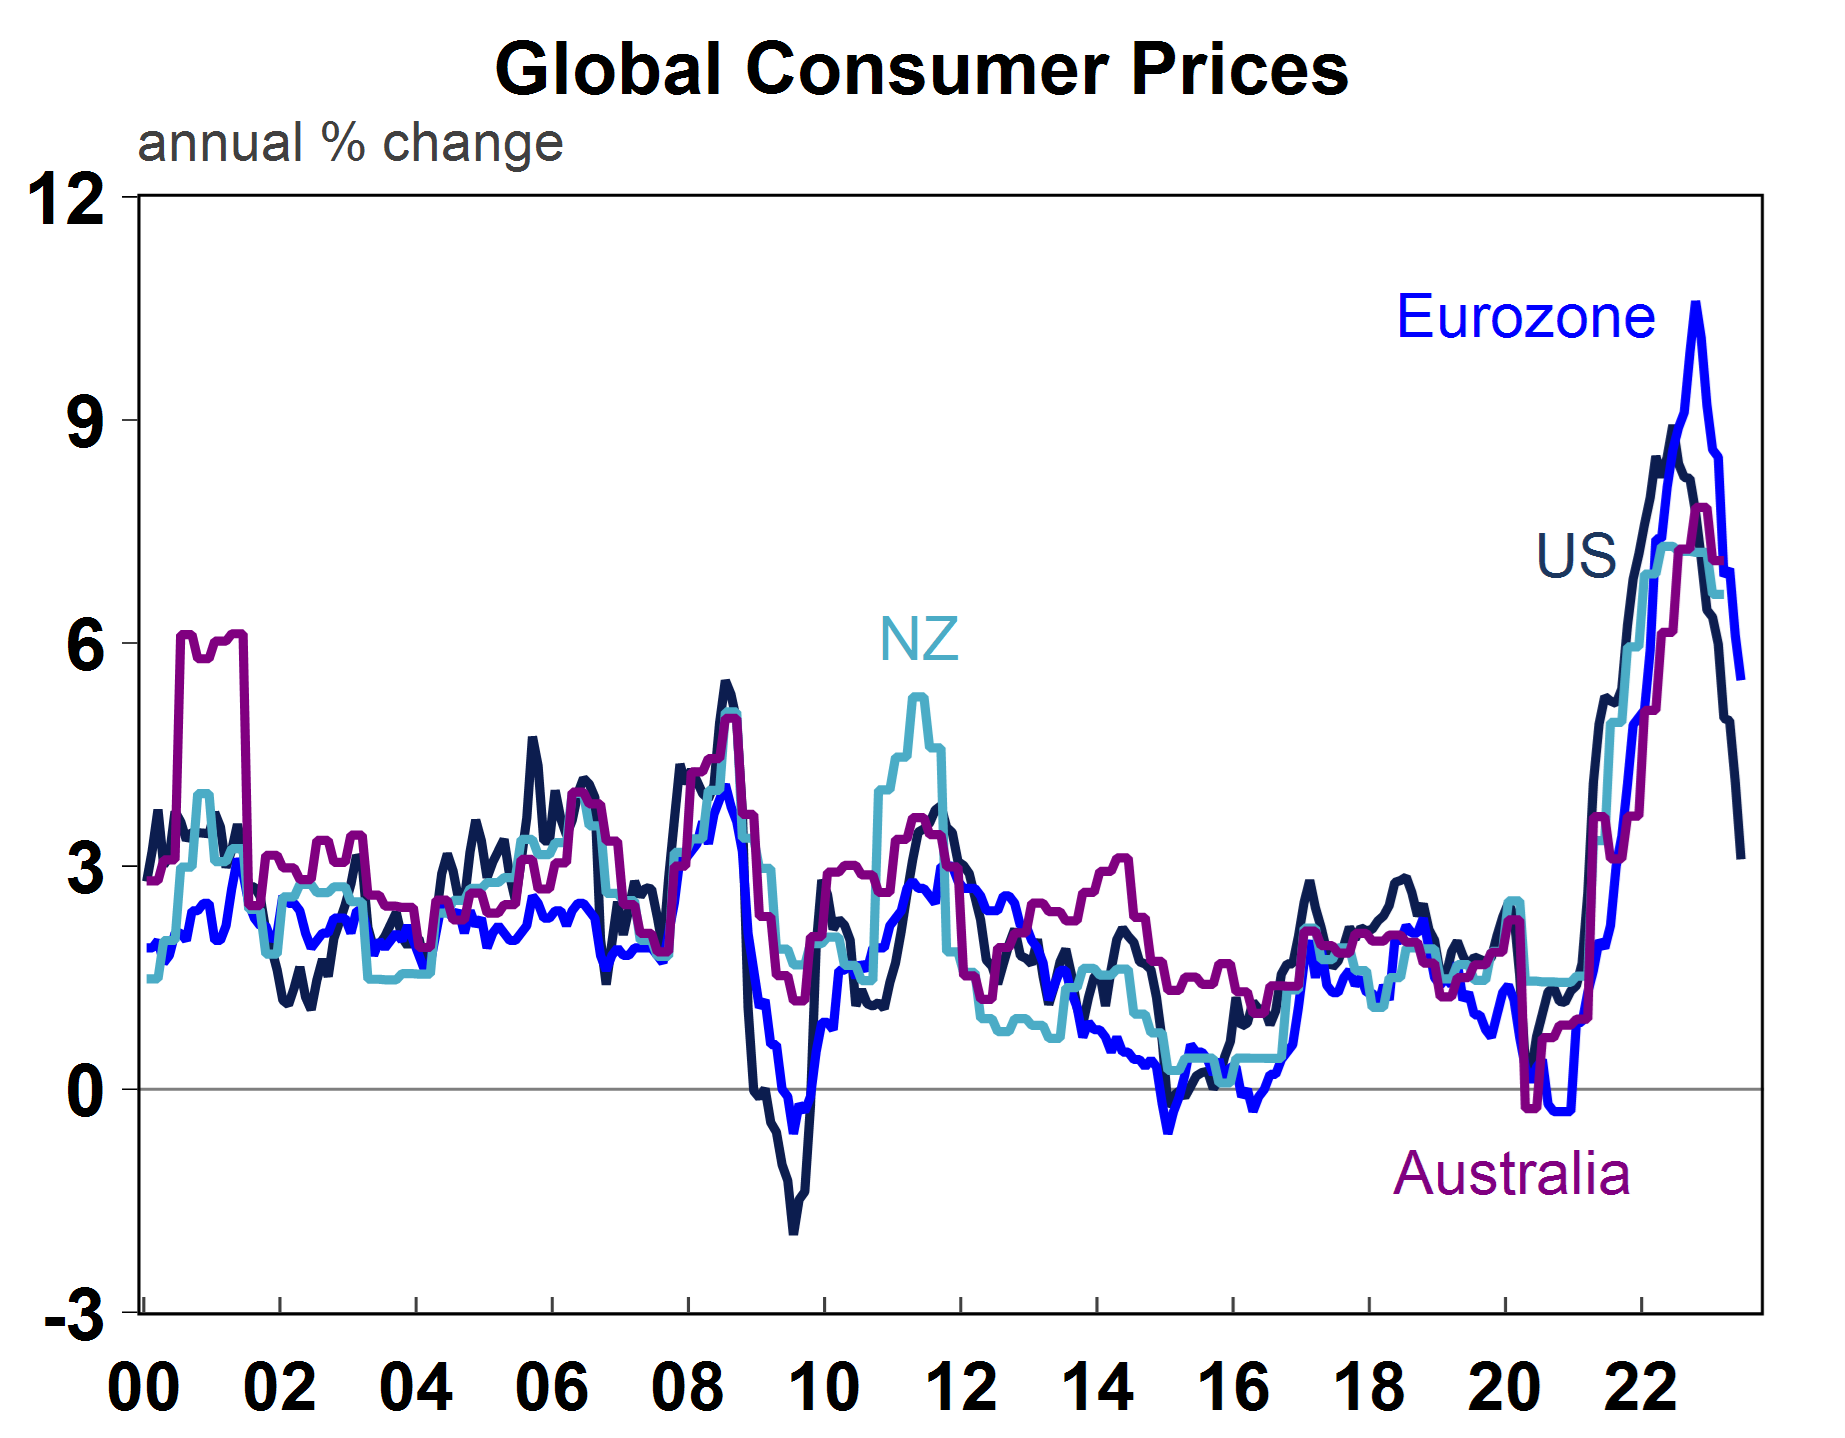
The US is a good guide to observe for inflation trends because it reached an earlier peak in inflation in June 2022 (at 9.1% year on year) ahead of many other countries like Australia (where inflation peaked in December 2022 at 7.8%) and Eurozone (which peaked at 10.6% in October 2022) – see the chart below. Each country has its own domestic issues and policy settings at play which will influence inflation, but the easing in global inflation is a positive sign for future Australian inflation data.
Source: Macrobond, AMP
What to expect in next week’s Australian June quarter inflation data?
On our estimates, the June quarter inflation data next Wednesday will show a 1% rise in headline consumer prices, taking annual growth to 6.2%, down from a peak of 7.8% in December 2022. The “trimmed mean” (Australia’s main measure of “core” inflation) is expected to be up by 1% or 5.9% over the year. In the June quarter, food prices are expected to be up by a decent 1.5%, alcohol and tobacco should increase by 1.2% (in line with the tobacco excise), clothing and footwear prices should get a rebound (+1.5%) after a seasonal fall in the prior quarter, housing is likely to rise (+2.5%) from another solid increase in rents but offset by a slowing in utilities prices (gas and electricity after a fall last quarter – although this is likely to be reversed in the September quarter as utility prices increased), household furnishings are expected to lift marginally after a fall in the March quarter, health prices look to have increased based on the monthly inflation data, transport prices look flat as motor vehicle prices declined, petrol prices rose modestly and transport fares declined, communication prices are expected to have declined, recreation and culture prices also fell (by -1.5%) after a jump in recent periods from higher demand for holiday travel, education prices are likely to be flat (based on seasonality) and insurance and finance up slightly.
Has the fight against inflation been won?
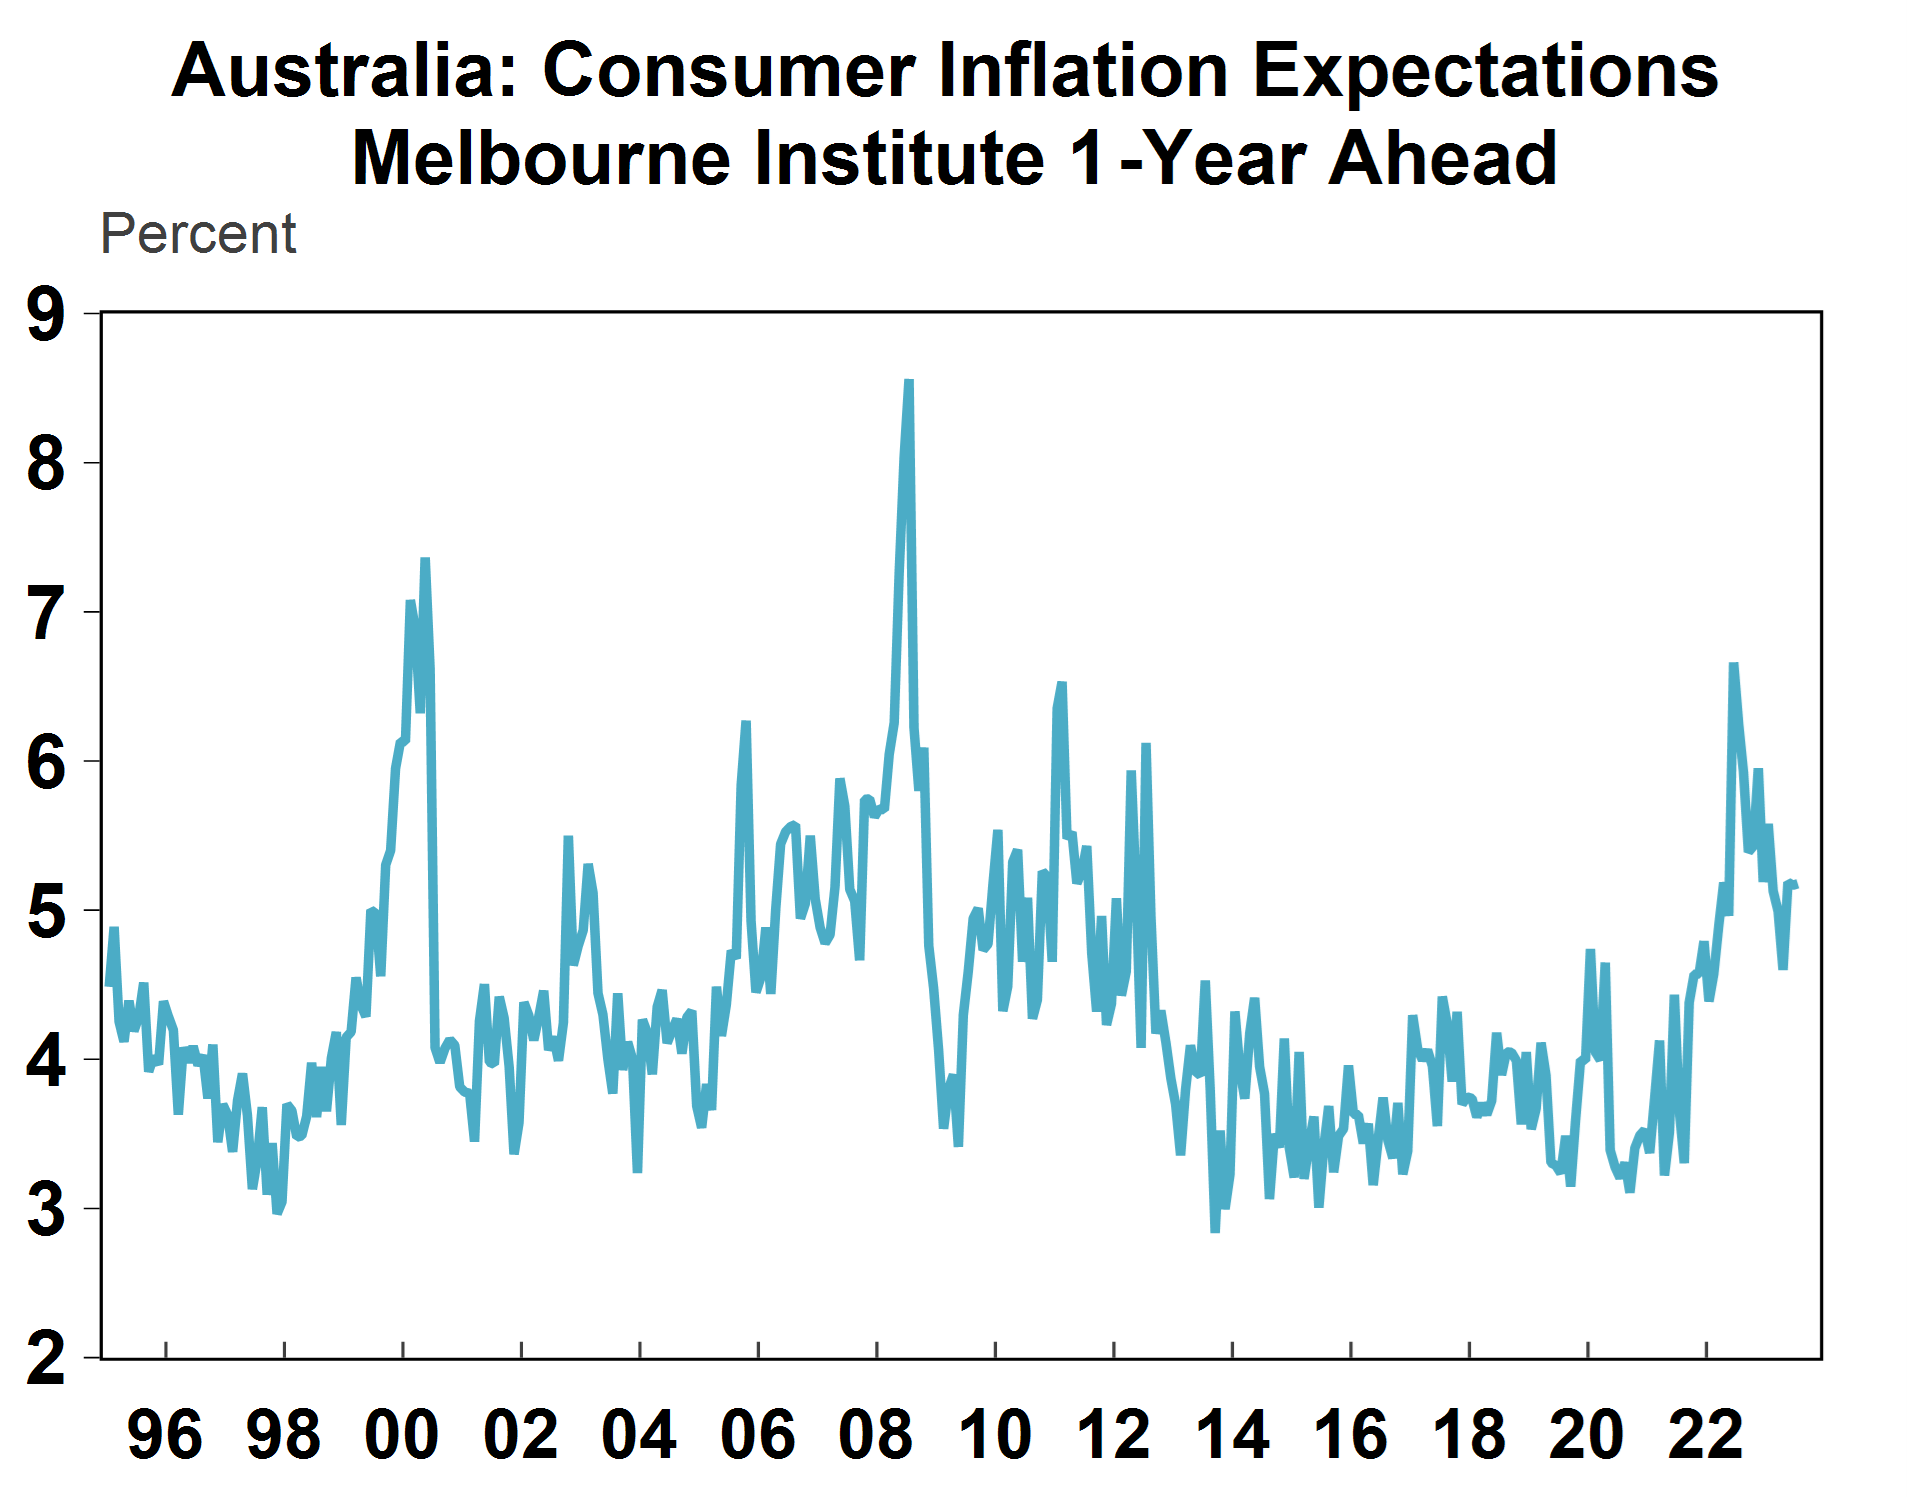
The growing checklist of downside inflation surprises does not mean that we can declare complete victory on the inflation front. There is still a need to reduce core inflation, which is now running in line or ahead of headline inflation. There is also a risk that the weakening in inflation could prove to be temporary if consumer spending rises again as real wages growth rises. Australian 1-year inflation expectations have declined (see the chart below) from their highs but are still around 5%, well above the 2-3% inflation target.
Source: Macrobond, AMP
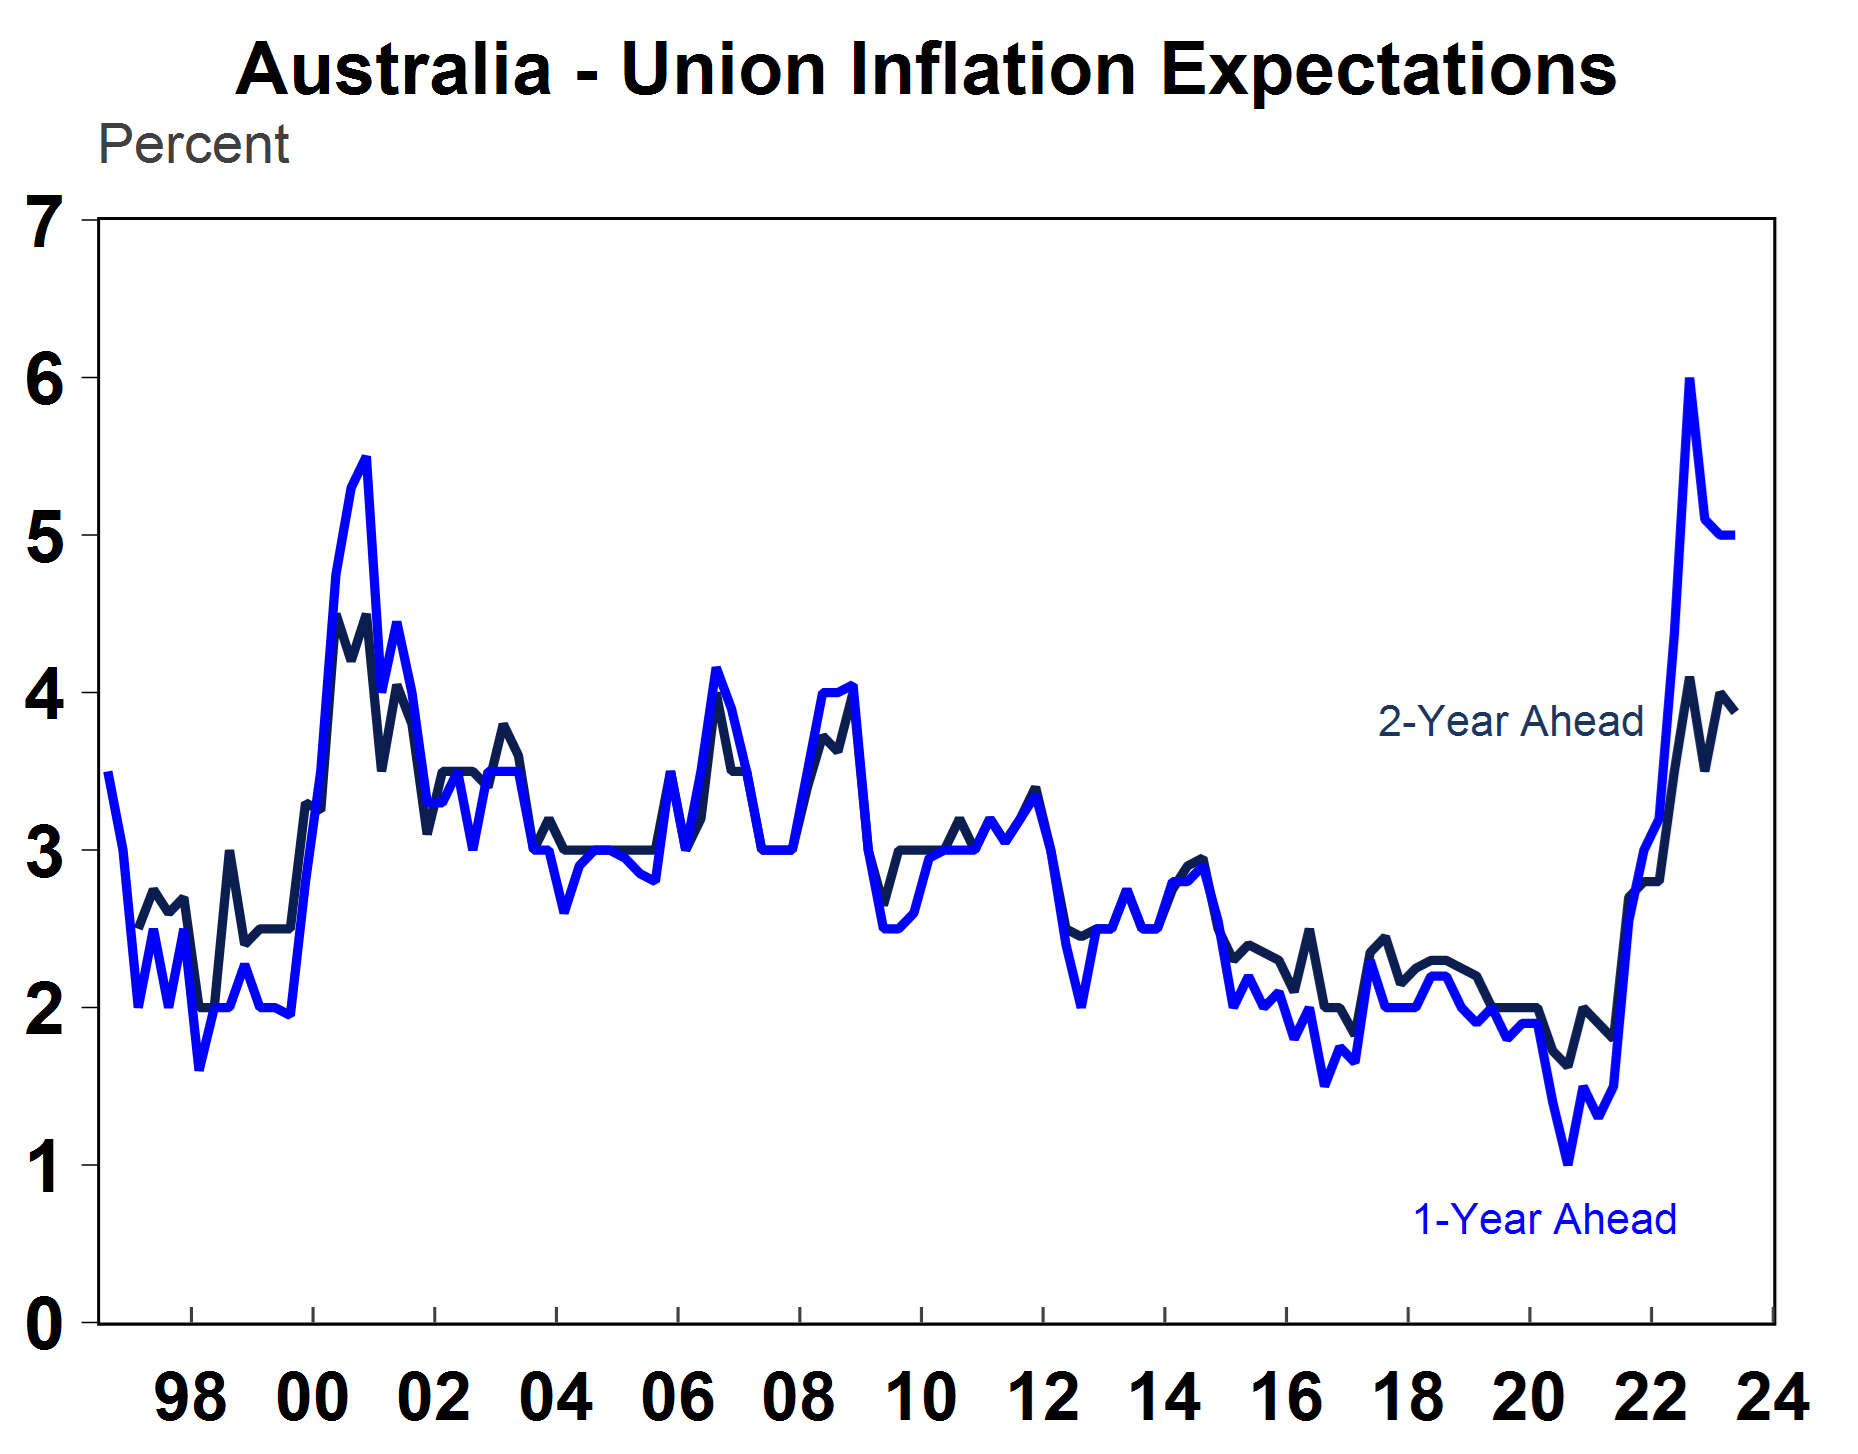
The larger than expected rise to minimum and award wages in June (which impacted around 25% of the workforce directly and potentially a larger share through a signalling effect on wage expectations) is also an upside risk to inflation and union expectations around wages are still elevated (see the chart below). Based on current levels of productivity growth, wages need to be sub 3% per annum to be consistent with the inflation target.
Source: Macrobond, AMP
On our forecasts, June quarter inflation will print slightly below the RBA’s forecasts. But, unless inflation surprises significantly to the downside of our forecast, another rate rise is still likely from the RBA at its next meeting in August. At this meeting, the RBA will review the latest inflation and growth forecasts which are expected to show some downgrade to growth forecasts (but no forecast of a recession) because the actual cash rate is higher than it was projected to be 3 months ago (and just under two rate rises are priced in from here) and some upward revision to wage projections based on the higher awarded minimum wages decision in June. Near-term inflation projections may look a little better compared to 3 months ago but the upward revisions to wages could keep the longer-run inflation forecasts higher for longer, making the RBA uncomfortable around the long-term risks to inflation, therefore pushing the case for another interest rate increase in August. But given that interest rates have already increased significantly in just over a year, there is also a good cause to keep the cash rate unchanged (which we think the RBA should do) so the decision to hike or pause in August is a very close call. Either way, we are very close to the end of the RBA hiking cycle.

Weekly market update 15-11-2024
15 November 2024 | Blog Global share markets were messy over the last week, not helped by the ongoing rise in bond yields and a wind back in Fed rate cut expectations after some elevated US inflation data and slightly hawkish comments from Fed chair Powell. Read more
Oliver's insights - staying focused as an investor
12 November 2024 | Blog Dr Shane Oliver suggests five ways to help manage the noise and stay focussed as an investor with the changes in the macro enviroment. Read more
Weekly market update 08-11-2024
08 November 2024 | Blog It was all about the US Presidential election this week. Despite concerns that the election outcome would be extremely close, the Republican victory was stronger than the polls and betting markets were suggesting into the lead up. Read moreWhat you need to know
While every care has been taken in the preparation of this article, neither National Mutual Funds Management Ltd (ABN 32 006 787 720, AFSL 234652) (NMFM), AMP Limited ABN 49 079 354 519 nor any other member of the AMP Group (AMP) makes any representations or warranties as to the accuracy or completeness of any statement in it including, without limitation, any forecasts. Past performance is not a reliable indicator of future performance. This document has been prepared for the purpose of providing general information, without taking account of any particular investor’s objectives, financial situation or needs. An investor should, before making any investment decisions, consider the appropriateness of the information in this document, and seek professional advice, having regard to the investor’s objectives, financial situation and needs. This article is solely for the use of the party to whom it is provided and must not be provided to any other person or entity without the express written consent AMP. This article is not intended for distribution or use in any jurisdiction where it would be contrary to applicable laws, regulations or directives and does not constitute a recommendation, offer, solicitation or invitation to invest.
The information on this page was current on the date the page was published. For up-to-date information, we refer you to the relevant product disclosure statement, target market determination and product updates available at amp.com.au.

