

Key points
- The budget this year is expected to show a surplus of $9.3bn thanks to a continuing
revenue windfall, but slip back into bigger deficits from 2024-25.
- Key measures include broader cost-of-living support & “Future Made in
Australia” measures.
- Significant extra spending risks adding to inflation.
- Structural budget deficits remain in the medium term as the revenue windfall fades and spending remains high. Bigger government looks increasingly locked in.
AMP Head of Investment Strategy and Chief Economist Dr Shane Oliver, Deputy Chief Economist Diana Mousina and Economist My Bui explain what effects the Federal Budget could have on the Australian economy.
Introduction
The Budget is aimed at trying to lower inflation in the near term but supporting Government
priorities including formally launching a “Future Made in Australia” (FMIA) over the medium term. In terms of the former, there is another round of cost-of-living subsidies designed to reduce measured inflation. In terms of the latter, it further cements bigger government and sees bigger deficits for the medium term.
Key budget measures
Key measures, many of which were announced prior, include:
- $5.4bn in a broader round of cost-of-living relief, including broadening energy bill relief for all households and extending rent assistance.
- A renewed focus on the benefits to all households from the Stage 3 tax cuts that were rejigged in January (worth an average of $36/wk).
- $3bn for community pharmacies for cheaper medication and $6.2bn on Medicare and expanding the Pharmaceutical Benefits Scheme.
- $9.6bn on housing & crisis accommodation and extra on related infrastructure (although much is a continuation of existing programs) and $89m to train home builders (although the planned 20,000 new tradies are only 1.7% of the existing construction workforce).
- Prac payments for nurses, midwifes and social workers.
- A change to student debt indexation which cuts the value of debt with no near-term budget cost as it won’t involve a handout to students.
- A mix of subsidies, tax breaks, cheap loans, relaxed foreign investment rules & less red tape to boost investment in government chosen industries as part of the $22.7bn “FMIA” policy.
- Caps on international student arrivals by each university which can be raised if they build more student accommodation.
- Extra spending on aged care & childcare to cover wage rises.
- Freeze on deeming rates for low-income households.
Budget savings include:
- Further savings in areas like consultants, compliance and efficiencies and reducing spending on the National Disability Insurance Scheme.
Economic assumptions
The Government left its growth forecasts unchanged for this year but revised them down slightly for the next two years. Notably it has revised down slightly its inflation forecasts and still sees wages growth slowing from here as does the RBA, but an obvious risk to this is that its support for wage increases in certain industries has a flow on effect to other industries (just as the aged care wage rises last year seems to be leading to higher wages for childcare workers). It also sees lower inflation this year and next than the RBA and this is partly due to a continuation of cost-of-living relief measures that it sees as lowering measured inflation (by 0.5% in 2024-25), whereas the RBA assumed the measures lapse.
The Government now sees net immigration of 395,000 this financial year (MYEFO was 375,000), falling to 260,000 in 2024-25, taking population growth down to around 1.4% from 2.4% in 2022-23. The Government kept its medium-term iron ore price assumption at $US60/tonne. With the iron ore price well above that (>$US100 as of May 2024), it’s still a potential source of revenue upside.
Economic assumptions
| 2022-23 | 2023-24 | 2024-25 | 2025-26 | 2026-27 | 2027-28 | ||
| Real GDP | Govt | 3.1 | 1.75 | 2 | 2.25 | 2.5 | 2.75 |
| % year | AMP | 1.5 | 1.7 | 2.4 | 2.5 | 2.5 | |
| Inflation | Govt | 6.0 | 3.5 | 2.75 | 2.75 | 2.5 | 2.5 |
| % to June | AMP | 3.6 | 2.7 | 2.5 | 2.5 | 2.5 | |
| Wages | Govt | 3.7 | 4 | 3.25 | 3.25 | 3.5 | 3.5 |
| % to June | AMP | 4.1 | 3.1 | 2.8 | 3.5 | 3.75 | |
| Unemp Rate | Govt | 3.6 | 4 | 4.5 | 4.5 | 4.5 | 4.25 |
| % June | AMP | 4 | 4.4 | 4.3 | 4.25 | 4.25 | |
| Net migration | Govt | 528,000 | 395,000 | 260,000 | 255,000 | 235,000 | 235,000 |
Source: Australian Treasury, AMP
Another budget surplus then bigger deficits
This Budget like all of those since 2020 has again benefitted from extra revenue flows coming from higher personal tax collections due to stronger jobs growth and higher commodity prices (and hence mining profits) than assumed. This is not smart management but good luck flowing from conservative forecasts. This windfall (see the line called “parameter changes” in the next table) is estimated to reduce the deficit this financial year by $10.6bn compared to last December’s update, with a total benefit over the five years shown of $12.6bn. But this table – a more detailed version of which appears in the Budget papers and is nicknamed the “table of truth” – also shows how much of the windfall has been spent (see the line called “new stimulus”). Last year only 14% of the windfall through the forward years was spent but this budget nearly twice the windfall (i.e. $24.4bn) is being spent. As a result, while the budget now looks better for this financial year (with another surplus – which could turn out to be even bigger), because of the extra spending in subsequent years it now looks worse from 2024-25.
The "table of truth" - underlying cash budget balance projections
| 2023-24 | 2024-25 | 2025-26 | 2026-27 | 2027-28 | |
| May 23-24 Budget, $bn | -13.9 | -35.1 | -36.6 | -28.5 | |
| Dec 2023 MYEFO, $bn | -1.1 | -18.8 | -35.1 | -19.5 | -26.5 |
| Parameter chgs, $bn | +10.6 | +0.0 | +2.6 | -4.0 | +3.3 |
| New stimulus, $bn | -0.2 | -9.5 | -10.3 | -3.3 | -1.2 |
| Projected budget, $bn | +9.3 | -28.3 | -42.8 | -26.7 | -24.3 |
| % GDP | +0.3 | -1.0 | -1.5 | -0.9 | -0.8 |
Source: Australian Treasury, AMP
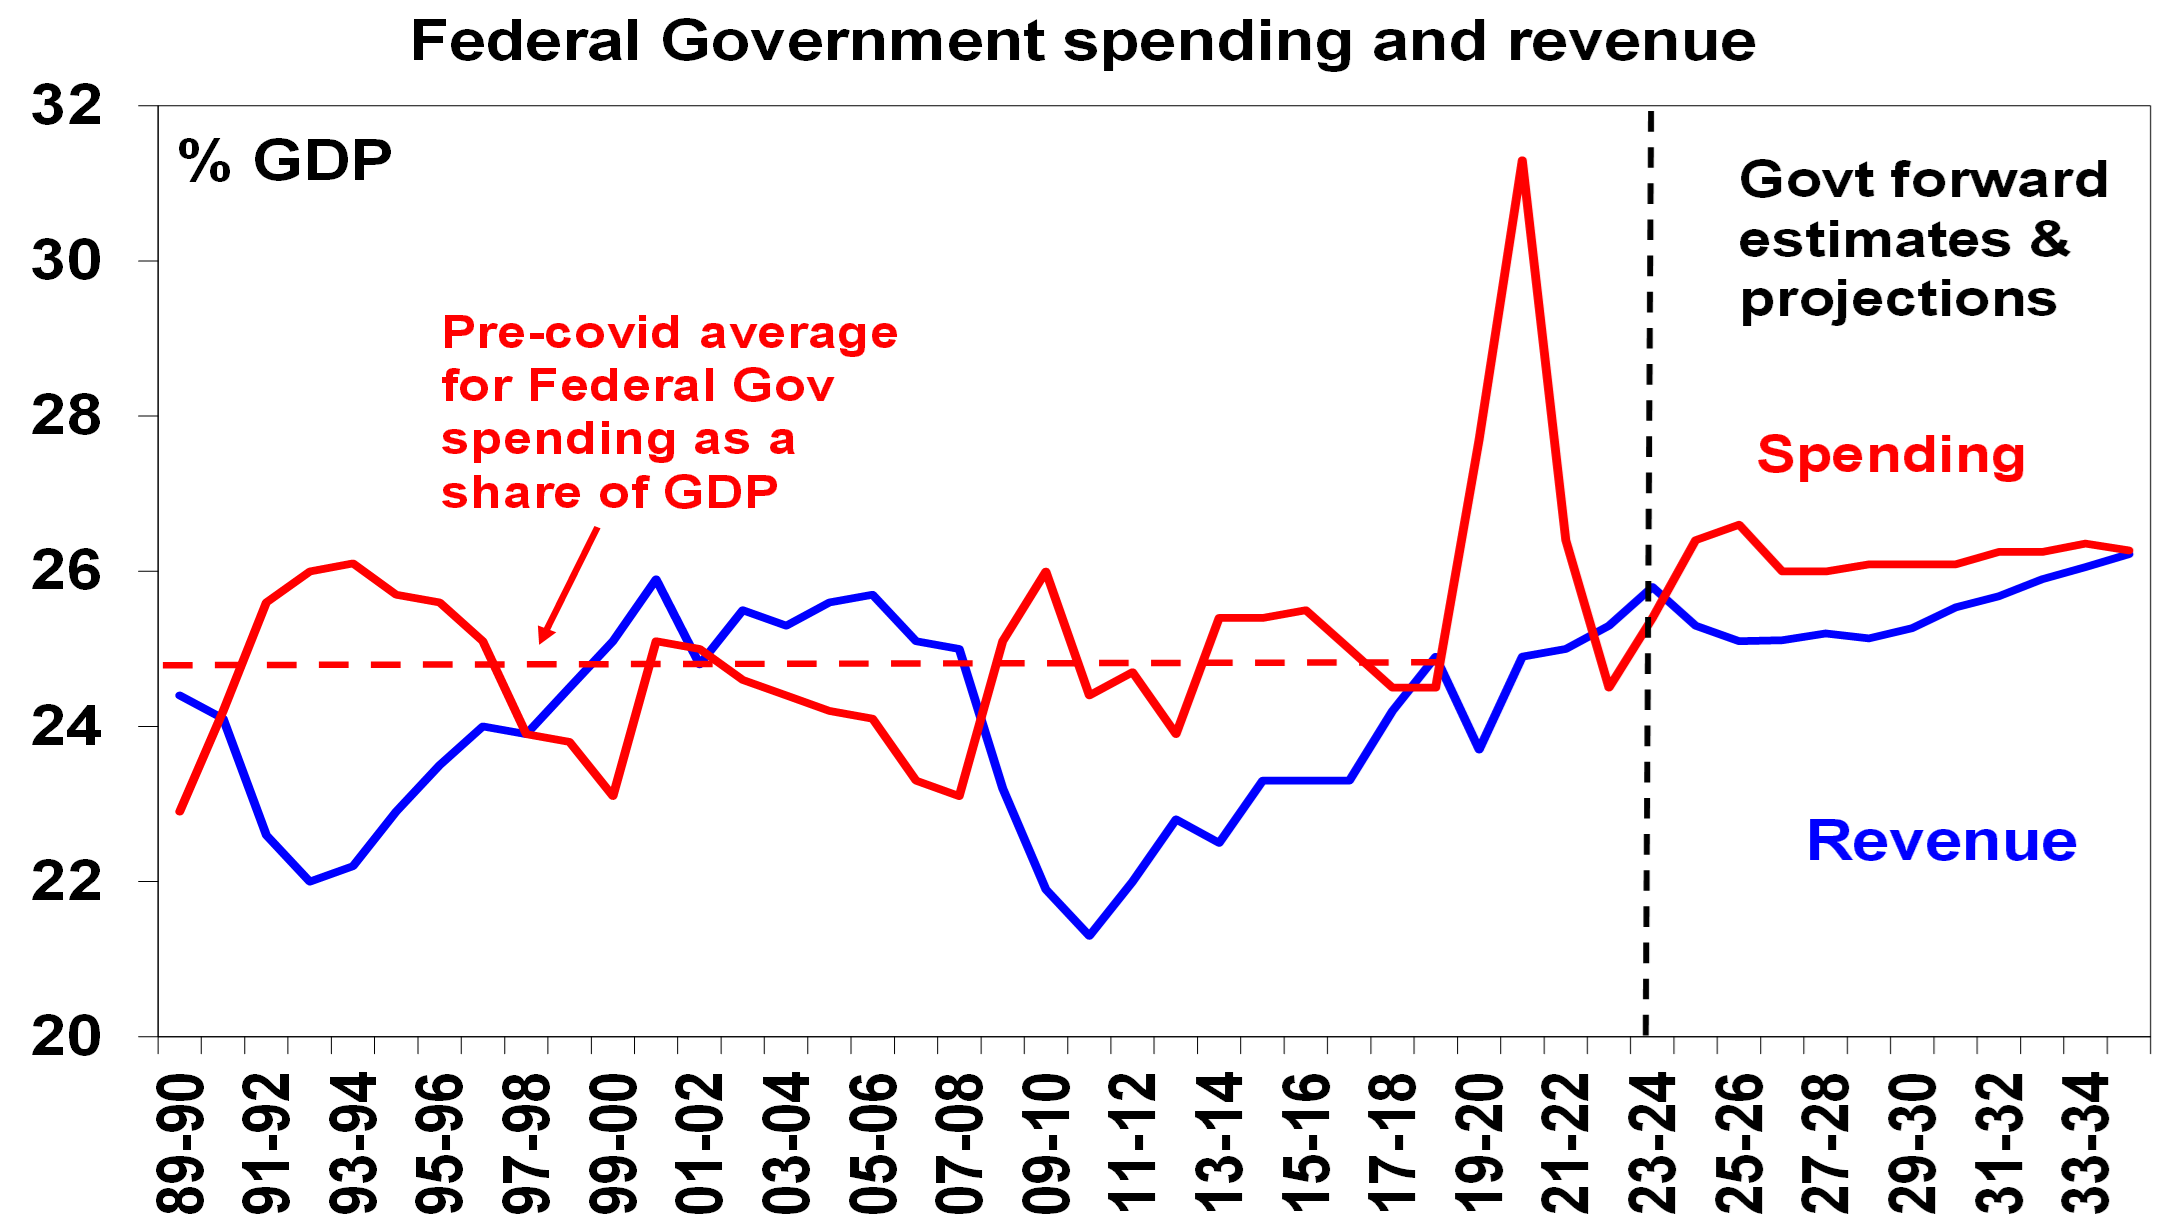
Due to new spending & structural pressures from interest costs, the NDIS, defence, health and aged care spending as a share of GDP is expected to average 26.2% over the longer term, well above the pre-Covid average of 24.8%. Despite a blip down with tax cuts, revenue trends up reaching its 1986-87 record of 26.2% of GDP in 10 yrs. So bracket creep, not spending restraint is assumed to do the work in getting us back to a budget balance.
Source: Australian Treasury, AMP
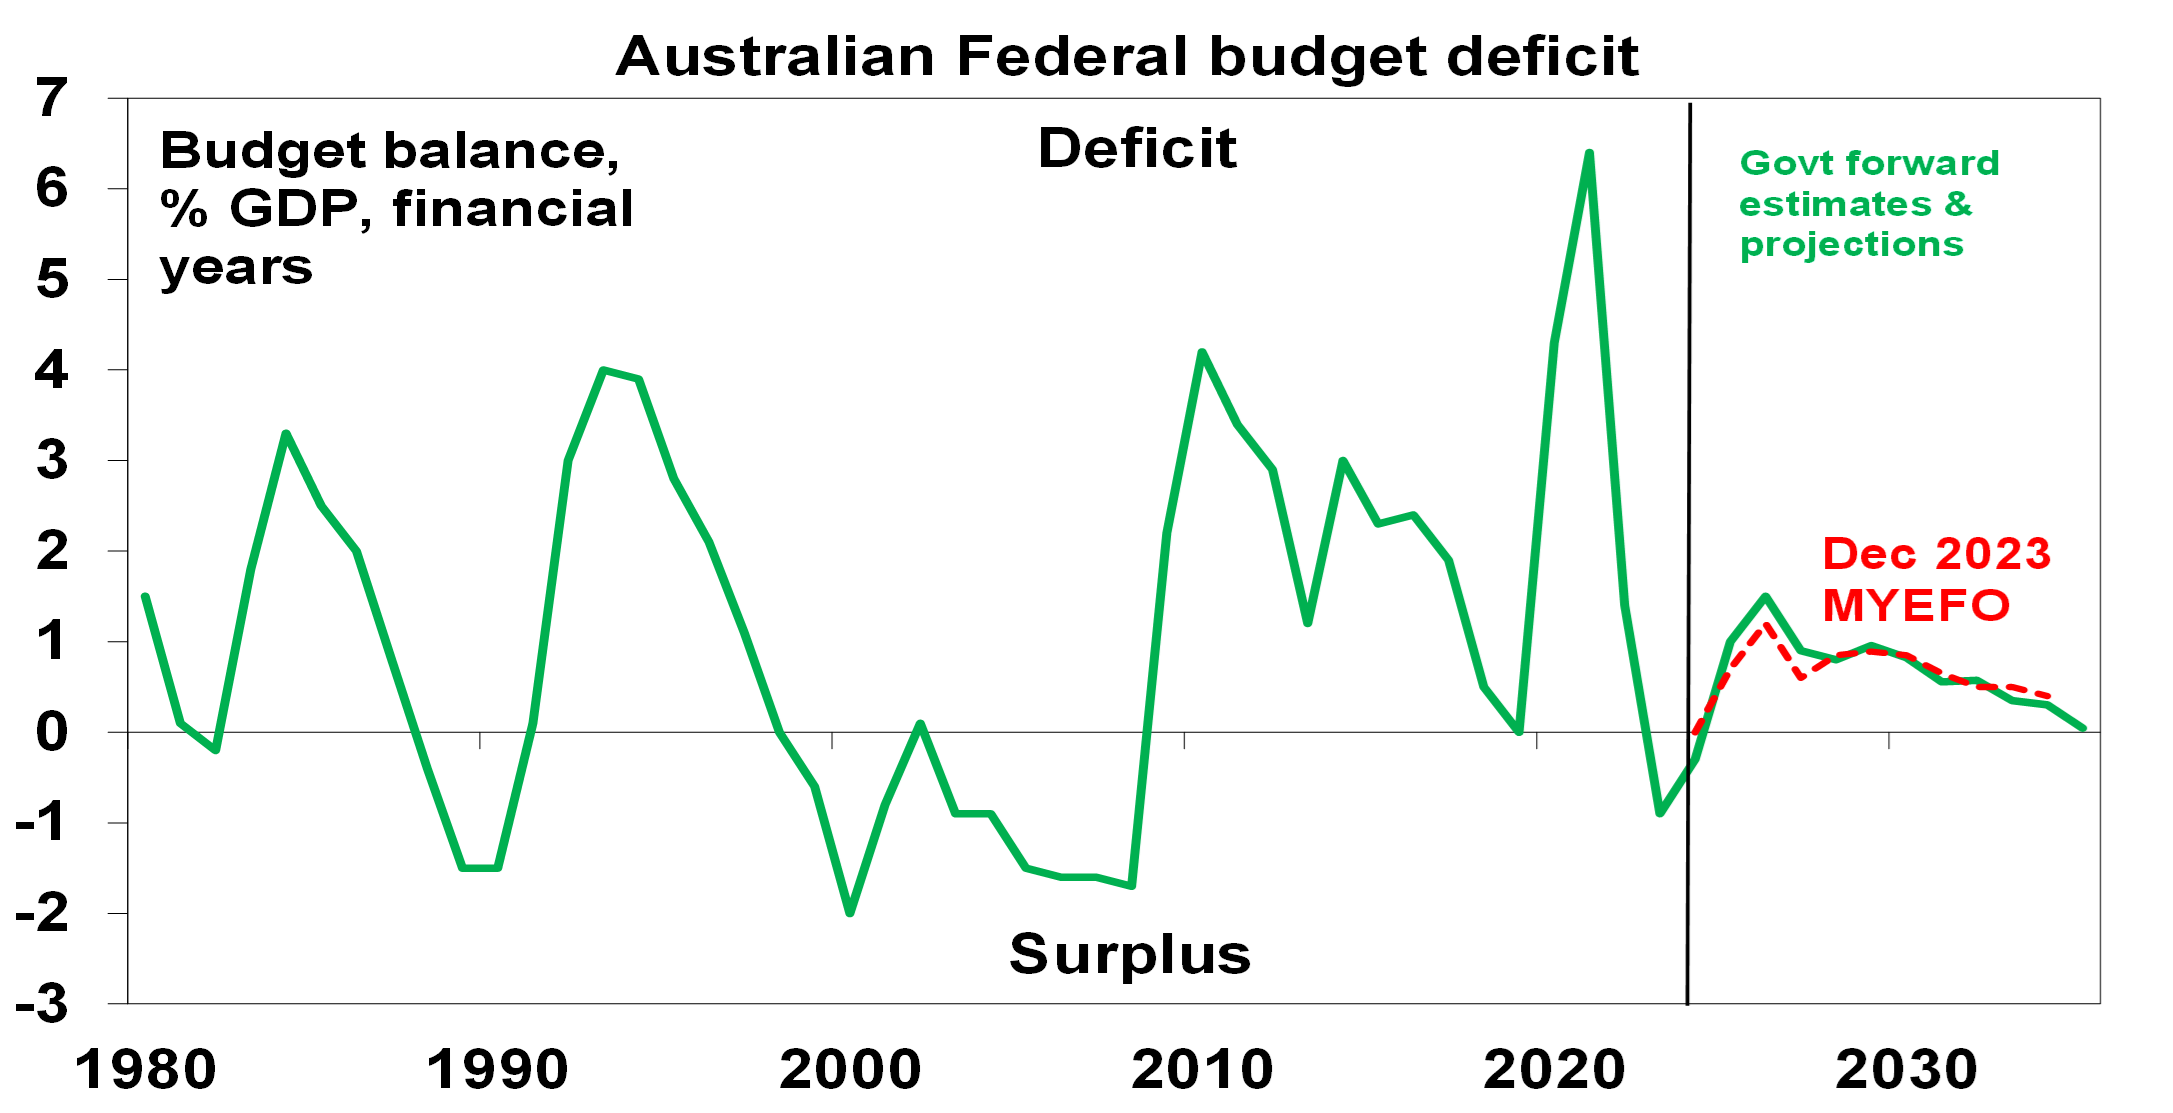
After a surplus this year, there are bigger deficits over the next few years.
Source: Australian Treasury, AMP
Gross public debt is projected to remain elevated at around 35% GDP before falling next decade.
Winners and losers
Winners include: low and middle income households; pensioners; women; medicine users; aged & child care workers; low income renters; students; apprentices; home builders; students; defence; critical mineral projects; and clean energy manufacturers. Losers include: consultants, universities, foreign students, backpackers and dodgy NDIS providers.
Assessment
The positives in the Budget include: another surplus; the cost-of-living measures will help ease pressure on the most vulnerable and some will lower measured inflation with a second round flow on to lower indexed price rises and inflation expectations; tax breaks & streamlined approvals should help boost medium term business investment; & there is still scope for revenue to surprise with commodity price assumptions.
However, the Budget has several significant weaknesses in relation to:
- Inflation. The cost-of-living measures will help lower measured inflation. But the new stimulus (shown in the “table of truth” above) risks boosting demand. Federal and state fiscal positions point to a sharp shift from fiscal contraction (which helps lower demand and inflation) to expansion over the year ahead (see the next chart). And Government support for high wage increases for some sectors risks adding to wages growth given the flow on and influencing effects at a time when wages growth is already at its maximum level consistent with the inflation target. All of which risks making the RBA’s job harder.
.png)
Source: Australian Treasury, AMP
- Structural deficits. The Budget has added to medium term structural deficits. This leaves it vulnerable if the economy weakens and sees no money put aside for a rainy day over the forecast period.
- Bigger government. Spending as a share of GDP is seen settling well above that seen pre pandemic thereby locking in a bigger government sector which risks further slowing medium term productivity growth.
- FMIA. While “made in Australia” is popular and there is talk of a “new growth” model, its reliance on protectionism and government picking winners has been tried and failed in the past with a long-term cost to productivity & living standards. Moving to net zero is one thing, but this doesn’t mean we need to make solar panels or quantum computing or that we have a comparative advantage in them. Just because other countries are deploying subsidies is no reason for Australia to do so. We should just take the subsidised products!
- Productivity. Beyond the hopes of FMIA there is not a lot here to improve Australia’s medium term productivity performance. This is the key to growth in living standards but needs urgent reform in terms of tax, competition, the non-market services sector, industrial relations, education and training and energy generation. Fortunately, the Government is moving on the last two at least.
- Housing. The latest housing measures are welcome, but are unlikely to be enough to hit the 1.2 million new homes over five years objective with the supply shortfall set to remain unless immigration plunges.
Implications for the RBA
The direct lowering in measured inflation from cost of living measures will be welcomed by the RBA, but it will be wary of the rise in new stimulus. The net effect adds to the risk of higher for longer interest rates, but is probably not enough to change our forecast for a rate cut later this year.
Implications for Australian assets
Cash and term deposits – cash and bank deposit returns have improved substantially with RBA rate hikes and the Budget won’t change this much.
Bonds – another surplus takes pressure off bond yields, but this is offset by higher medium term deficits…so there is not much in it.
Shares – the Budget is positive for spending and hence retail shares, but this may be offset by higher than otherwise rates. Some manufacturers may benefit from FMIA. Overall, it looks neutral for shares.
Property – the housing measures are unlikely to alter the home price outlook which is dominated by supply shortages & high rates. We see modest home price growth this year.
The $A – the Budget is unlikely to change the direction for the $A.

Weekly market update 28-06-2024
28 June 2024 | Blog Dr Shane Oliver observes strong financial year returns - but can it continue?; Trump odds up after debate - watch trade war risks; risk of another RBA hike up but not fait accompli; Australian jobs market cooling; another big Australian budget surplus and more. Read more
Oliver's insights - investing 40 years
25 June 2024 | Blog Dr Shane Oliver shaes his nine most important lessons from investing over the past 40 years. Read more
Weekly market update 21-06-2024
21 June 2024 | Blog This week, narrowing US share gains; drip feed of falling global inflation & rates is good sign for RBA; Federal & state governments making the RBA's job harder; the pros & cons of nuclear; and more. Read moreWhat you need to know
While every care has been taken in the preparation of this article, neither National Mutual Funds Management Ltd (ABN 32 006 787 720, AFSL 234652) (NMFM), AMP Limited ABN 49 079 354 519 nor any other member of the AMP Group (AMP) makes any representations or warranties as to the accuracy or completeness of any statement in it including, without limitation, any forecasts. Past performance is not a reliable indicator of future performance. This document has been prepared for the purpose of providing general information, without taking account of any particular investor’s objectives, financial situation or needs. An investor should, before making any investment decisions, consider the appropriateness of the information in this document, and seek professional advice, having regard to the investor’s objectives, financial situation and needs. This article is solely for the use of the party to whom it is provided and must not be provided to any other person or entity without the express written consent AMP. This article is not intended for distribution or use in any jurisdiction where it would be contrary to applicable laws, regulations or directives and does not constitute a recommendation, offer, solicitation or invitation to invest.
The information on this page was current on the date the page was published. For up-to-date information, we refer you to the relevant product disclosure statement, target market determination and product updates available at amp.com.au.